The QCD Phase Diagram - Theory Center
The QCD Phase Diagram - Theory Center
The QCD Phase Diagram - Theory Center

Create successful ePaper yourself
Turn your PDF publications into a flip-book with our unique Google optimized e-Paper software.
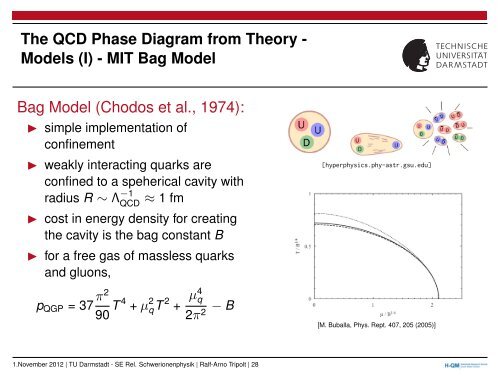
<strong>The</strong> <strong>QCD</strong> <strong>Phase</strong> <strong>Diagram</strong> from <strong>The</strong>ory -<br />
Models (I) - MIT Bag Model<br />
Bag Model (Chodos et al., 1974):<br />
◮ simple implementation of<br />
confinement<br />
◮ weakly interacting quarks are<br />
confined to a speherical cavity with<br />
≈ 1 fm<br />
radius R ∼ Λ −1<br />
<strong>QCD</strong><br />
◮ cost in energy density for creating<br />
the cavity is the bag constant B<br />
◮ for a free gas of massless quarks<br />
and gluons,<br />
pQGP = 37 π2<br />
90 T 4 + µ 2<br />
qT 2 + µ4q − B<br />
2<br />
2π<br />
1.November 2012 | TU Darmstadt - SE Rel. Schwerionenphysik | Ralf-Arno Tripolt | 28<br />
[hyperphysics.phy-astr.gsu.edu]<br />
[M. Buballa, Phys. Rept. 407, 205 (2005)]