The QCD Phase Diagram - Theory Center
The QCD Phase Diagram - Theory Center
The QCD Phase Diagram - Theory Center

Create successful ePaper yourself
Turn your PDF publications into a flip-book with our unique Google optimized e-Paper software.
<strong>The</strong> <strong>QCD</strong> <strong>Phase</strong> <strong>Diagram</strong> from Experiment -<br />
Heavy Ion Collisions (III)<br />
→ talk by G. Dentinger on <strong>The</strong>rmal fits of hadron yields and the <strong>QCD</strong> phase diagram, 8.11.2012<br />
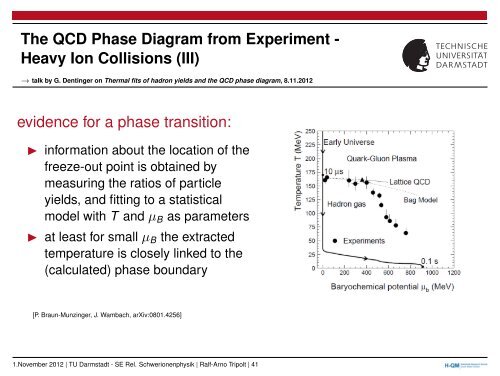
evidence for a phase transition:<br />
◮ information about the location of the<br />
freeze-out point is obtained by<br />
measuring the ratios of particle<br />
yields, and fitting to a statistical<br />
model with T and µB as parameters<br />
◮ at least for small µB the extracted<br />
temperature is closely linked to the<br />
(calculated) phase boundary<br />
[P. Braun-Munzinger, J. Wambach, arXiv:0801.4256]<br />
1.November 2012 | TU Darmstadt - SE Rel. Schwerionenphysik | Ralf-Arno Tripolt | 41