You also want an ePaper? Increase the reach of your titles
YUMPU automatically turns print PDFs into web optimized ePapers that Google loves.
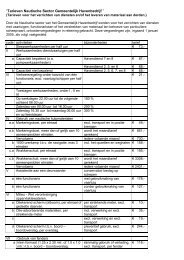
Port of Amsterdam: financial highlights<br />
Invested capital (x € 1m)<br />
<strong>2006</strong> 2005 200 200 2002<br />
Total invested capital 5 2.0 556.0 5 6.0 526.0 89.0<br />
Tangible fixed assets 2.0 58.0 56.0 5.0 09.0<br />
Gross capital expenditure .8 2 .1 .0 5 .0 8.0<br />
Financial impact (x € 1m)<br />
Turnover 100.0 101.0 80.5 0. 69.9<br />
Operating result 29. 21.6 18.8 . 10.0<br />
Depreciation/amortization 16.9 20. 22.1 1 .2 1 .9<br />
Cash flow 6.2 2. 0.9 21.9 2 .9<br />
Key figures<br />
Profit/capital ratio (result+interest on loans as % of total<br />
invested capital) . 6.5 5.9 .5 .<br />
Profit margin (result as % of turnover) 29. 21. 2 . 10.9 11.1<br />
Transshipment (in millions of tons)<br />
Breakdown:<br />
61.0 5 .8 51.9 .5 50.<br />
liquid bulk 25.4 20.7 18.2 13.4 16.5<br />
Dry bulk 30.1 30.0 30.9 28.2 31.0<br />
General cargo 5.5 3.1 2.8 2.9 2.9<br />
Number of ocean-going vessels received 5, 2 5,115 5,026 ,808 ,962<br />
Average port dues per vessel (x € 1) 6,228 6,155 5, 60 ,95 5,2 5<br />
Number of occupied jobs as at financial year-end 20 15 15 19 2<br />
Average salary charges per job x € 1,000 62.8 6 .6 6 .1 61.6 56.<br />
Absenteeism (as %) . 5.0 .9