SIMATIC HMI WinCC V7.0 System Description - DCE FEL ČVUT v ...
SIMATIC HMI WinCC V7.0 System Description - DCE FEL ČVUT v ...
SIMATIC HMI WinCC V7.0 System Description - DCE FEL ČVUT v ...

You also want an ePaper? Increase the reach of your titles
YUMPU automatically turns print PDFs into web optimized ePapers that Google loves.
3.3 Plant Intelligence Options <strong>SIMATIC</strong> <strong>WinCC</strong><br />
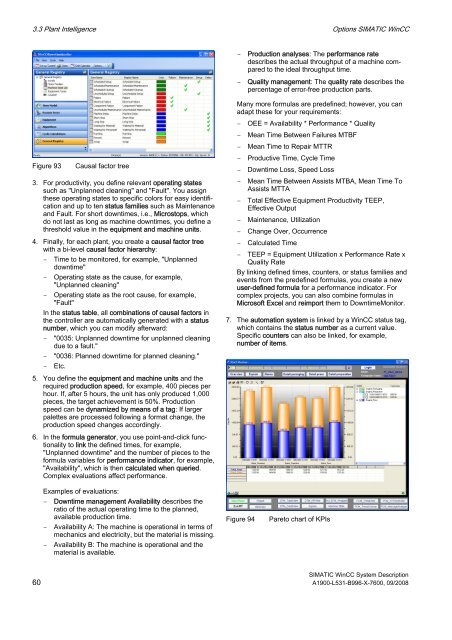
Figure 93 Causal factor tree<br />
3. For productivity, you define relevant operating states<br />
such as "Unplanned cleaning" and "Fault". You assign<br />
these operating states to specific colors for easy identification<br />
and up to ten status families such as Maintenance<br />
and Fault. For short downtimes, i.e., Microstops, which<br />
do not last as long as machine downtimes, you define a<br />
threshold value in the equipment and machine units.<br />
4. Finally, for each plant, you create a causal factor tree<br />
with a bi-level causal factor hierarchy:<br />
– Time to be monitored, for example, "Unplanned<br />
downtime"<br />
– Operating state as the cause, for example,<br />
"Unplanned cleaning"<br />
– Operating state as the root cause, for example,<br />
"Fault"<br />
In the status table, all combinations of causal factors in<br />
the controller are automatically generated with a status<br />
number, which you can modify afterward:<br />
– "0035: Unplanned downtime for unplanned cleaning<br />
due to a fault."<br />
– "0036: Planned downtime for planned cleaning."<br />
– Etc.<br />
5. You define the equipment and machine units and the<br />
required production speed, for example, 400 pieces per<br />
hour. If, after 5 hours, the unit has only produced 1,000<br />
pieces, the target achievement is 50%. Production<br />
speed can be dynamized by means of a tag: If larger<br />
palettes are processed following a format change, the<br />
production speed changes accordingly.<br />
6. In the formula generator, you use point-and-click functionality<br />
to link the defined times, for example,<br />
"Unplanned downtime" and the number of pieces to the<br />
formula variables for performance indicator, for example,<br />
"Availability", which is then calculated when queried.<br />
Complex evaluations affect performance.<br />
Examples of evaluations:<br />
– Downtime management Availability describes the<br />
ratio of the actual operating time to the planned,<br />
available production time.<br />
– Availability A: The machine is operational in terms of<br />
mechanics and electricity, but the material is missing.<br />
– Availability B: The machine is operational and the<br />
material is available.<br />
– Production analyses: The performance rate<br />
describes the actual throughput of a machine compared<br />
to the ideal throughput time.<br />
– Quality management: The quality rate describes the<br />
percentage of error-free production parts.<br />
Many more formulas are predefined; however, you can<br />
adapt these for your requirements:<br />
– OEE = Availability * Performance * Quality<br />
– Mean Time Between Failures MTBF<br />
– Mean Time to Repair MTTR<br />
– Productive Time, Cycle Time<br />
– Downtime Loss, Speed Loss<br />
– Mean Time Between Assists MTBA, Mean Time To<br />
Assists MTTA<br />
– Total Effective Equipment Productivity TEEP,<br />
Effective Output<br />
– Maintenance, Utilization<br />
– Change Over, Occurrence<br />
– Calculated Time<br />
– TEEP = Equipment Utilization x Performance Rate x<br />
Quality Rate<br />
By linking defined times, counters, or status families and<br />
events from the predefined formulas, you create a new<br />
user-defined formula for a performance indicator. For<br />
complex projects, you can also combine formulas in<br />
Microsoft Excel and reimport them to DowntimeMonitor.<br />
7. The automation system is linked by a <strong>WinCC</strong> status tag,<br />
which contains the status number as a current value.<br />
Specific counters can also be linked, for example,<br />
number of items.<br />
Figure 94 Pareto chart of KPIs<br />
<strong>SIMATIC</strong> <strong>WinCC</strong> <strong>System</strong> <strong>Description</strong><br />
60 A1900-L531-B996-X-7600, 09/2008