

Annual Report 2011 Max Planck Institute for Astronomy
Annual Report 2011 Max Planck Institute for Astronomy
Annual Report 2011 Max Planck Institute for Astronomy

Create successful ePaper yourself
Turn your PDF publications into a flip-book with our unique Google optimized e-Paper software.
30 II. Highlights<br />
II.3 In what Galaxies do Black Holes live in the Early Universe?<br />
Using state-of-the-art technology and sophisticated<br />
data analysis tools, a team from MPIA has developed a<br />
new and powerful technique to directly determine the<br />
mass of a galaxy hosting an active supermassive central<br />
black hole at a distance of nearly 9 billion light-years<br />
from Earth. This pioneering method promises a new<br />
approach <strong>for</strong> studying the co-evolution of galaxies and<br />
their central black holes, which typically relies on mass<br />
determinations.<br />
One of the most intriguing developments in astronomy<br />
over the last few decades is the realization that not only<br />
do most galaxies contain central black holes of gigantic<br />
size, but also that the mass of these central black holes<br />
are directly related to the mass of their host galaxies.<br />
These scaling relations with the black hole mass have<br />
been found to exist with the galaxy’s stellar or dynamical<br />
bulge mass, total luminosity and stellar velocity dispersion.<br />
It has recently been realized that these correlations<br />
are expected as a consequence of the current standard<br />
model of galaxy evolution, the so-called hierarchical<br />
model, as astronomers from MPIA have shown (Jahnke<br />
& Macciò <strong>2011</strong>, ApJ, 734, 92). In this standard model of<br />
galaxy <strong>for</strong>mation galaxies evolve and grow by ingesting<br />
smaller galaxies, or through mergers with galaxies of<br />
comparable size. As a a consequence of this hierarchical<br />
<strong>for</strong>mation, the individual relations between bulge and<br />
black hole mass are averaged out, creating a nearly universal<br />
ratio between the two properties in every galaxy.<br />
One of the most robust methods to study how galaxies<br />
and black holes evolve relative to each other is to trace<br />
these scaling relations through cosmic time. This can<br />
pixel<br />
60<br />
50<br />
40<br />
30<br />
20<br />
10<br />
a<br />
–21.4<br />
log (F(Ha) / (W/m<br />
–21<br />
2 ))<br />
–20.6<br />
0.5<br />
10<br />
E<br />
20 30 40 50 60<br />
pixel<br />
N<br />
b<br />
0.5<br />
10<br />
L(Ha) [10 42 ]<br />
0.4<br />
0.3<br />
0.2<br />
0.1<br />
0<br />
–0.1<br />
620<br />
640 660 680 700 720<br />
Wavelength [nm]<br />
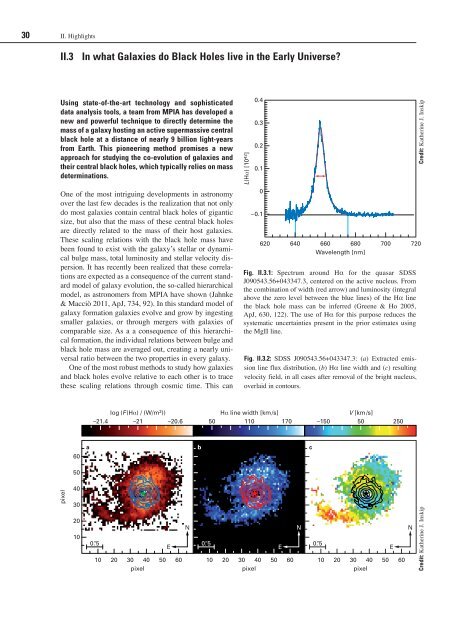
Fig. II.3.1: Spectrum around Hα <strong>for</strong> the quasar SDSS<br />
J090543.56+043347.3, centered on the active nucleus. From<br />
the combination of width (red arrow) and luminosity (integral<br />
above the zero level between the blue lines) of the Hα line<br />
the black hole mass can be inferred (Greene & Ho 2005,<br />
ApJ, 630, 122). The use of Hα <strong>for</strong> this purpose reduces the<br />
systematic uncertainties present in the prior estimates using<br />
the MgII line.<br />
Fig. II.3.2: SDSS J090543.56+043347.3: (a) Extracted emission<br />
line flux distribution, (b) Hα line width and (c) resulting<br />
velocity field, in all cases after removal of the bright nucleus,<br />
overlaid in contours.<br />
50<br />
Ha line width [km/s]<br />
110 170<br />
E<br />
20 30 40 50 60<br />
pixel<br />
N<br />
c<br />
V [km/s]<br />
–150 50<br />
0.5<br />
10<br />
E<br />
250<br />
20 30 40 50 60<br />
pixel<br />
N<br />
Credit: Katherine J. Inskip<br />
Credit: Katherine J. Inskip


