

Annual Report 2011 Max Planck Institute for Astronomy
Annual Report 2011 Max Planck Institute for Astronomy
Annual Report 2011 Max Planck Institute for Astronomy

You also want an ePaper? Increase the reach of your titles
YUMPU automatically turns print PDFs into web optimized ePapers that Google loves.
Credit: E. Schinnerer<br />
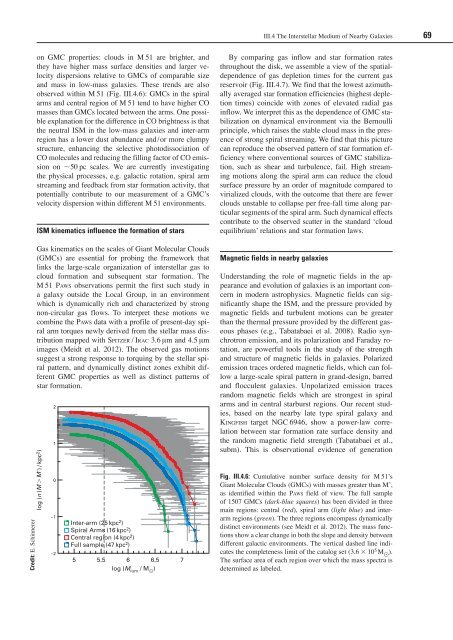
on GMC properties: clouds in M 51 are brighter, and<br />
they have higher mass surface densities and larger velocity<br />
dispersions relative to GMCs of comparable size<br />
and mass in low-mass galaxies. These trends are also<br />
observed within M 51 (Fig. III.4.6): GMCs in the spiral<br />
arms and central region of M 51 tend to have higher CO<br />
masses than GMCs located between the arms. One possible<br />
explanation <strong>for</strong> the difference in CO brightness is that<br />
the neutral ISM in the low-mass galaxies and inter-arm<br />
region has a lower dust abundance and/or more clumpy<br />
structure, enhancing the selective photodissociation of<br />
CO molecules and reducing the filling factor of CO emission<br />
on 50 pc scales. We are currently investigating<br />
the physical processes, e.g. galactic rotation, spiral arm<br />
streaming and feedback from star <strong>for</strong>mation activity, that<br />
potentially contribute to our measurement of a GMC’s<br />
velocity dispersion within different M 51 environments.<br />
ISM kinematics influence the <strong>for</strong>mation of stars<br />
Gas kinematics on the scales of Giant Molecular Clouds<br />
(GMCs) are essential <strong>for</strong> probing the framework that<br />
links the large-scale organization of interstellar gas to<br />
cloud <strong>for</strong>mation and subsequent star <strong>for</strong>mation. The<br />
M 51 paws observations permit the first such study in<br />
a galaxy outside the Local Group, in an environment<br />
which is dynamically rich and characterized by strong<br />
non-circular gas flows. To interpret these motions we<br />
combine the paws data with a profile of present-day spiral<br />
arm torques newly derived from the stellar mass distribution<br />
mapped with spitzer / irac 3.6 µm and 4.5 µm<br />
images (Meidt et al. 2012). The observed gas motions<br />
suggest a strong response to torquing by the stellar spiral<br />
pattern, and dynamically distinct zones exhibit different<br />
GMC properties as well as distinct patterns of<br />
star <strong>for</strong>mation.<br />
log (n (M M) / kpc 2 )<br />
2<br />
1<br />
0<br />
–1<br />
–2<br />
Inter-arm (25 kpc 2 )<br />
Spiral Arms (16 kpc 2 )<br />
Central region (4 kpc 2 )<br />
Full sample (47 kpc 2 )<br />
5<br />
5.5 6<br />
log (M lum / M )<br />
6.5 7<br />
III.4 The Interstellar Medium of Nearby Galaxies 69<br />
By comparing gas inflow and star <strong>for</strong>mation rates<br />
throughout the disk, we assemble a view of the spatialdependence<br />
of gas depletion times <strong>for</strong> the current gas<br />
reservoir (Fig. III.4.7). We find that the lowest azimuthally<br />
averaged star <strong>for</strong>mation efficiencies (highest depletion<br />
times) coincide with zones of elevated radial gas<br />
inflow. We interpret this as the dependence of GMC stabilization<br />
on dynamical environment via the Bernoulli<br />
principle, which raises the stable cloud mass in the presence<br />
of strong spiral streaming. We find that this picture<br />
can reproduce the observed pattern of star <strong>for</strong>mation efficiency<br />
where conventional sources of GMC stabilization,<br />
such as shear and turbulence, fail. High streaming<br />
motions along the spiral arm can reduce the cloud<br />
surface pressure by an order of magnitude compared to<br />
virialized clouds, with the outcome that there are fewer<br />
clouds unstable to collapse per free-fall time along particular<br />
segments of the spiral arm. Such dynamical effects<br />
contribute to the observed scatter in the standard ‘cloud<br />
equilibrium’ relations and star <strong>for</strong>mation laws.<br />
Magnetic fields in nearby galaxies<br />
Understanding the role of magnetic fields in the appearance<br />
and evolution of galaxies is an important concern<br />
in modern astrophysics. Magnetic fields can significantly<br />
shape the ISM, and the pressure provided by<br />
magnetic fields and turbulent motions can be greater<br />
than the thermal pressure provided by the different gaseous<br />
phases (e.g., Tabatabaei et al. 2008). Radio synchrotron<br />
emission, and its polarization and Faraday rotation,<br />
are powerful tools in the study of the strength<br />
and structure of magnetic fields in galaxies. Polarized<br />
emission traces ordered magnetic fields, which can follow<br />
a large-scale spiral pattern in grand-design, barred<br />
and flocculent galaxies. Unpolarized emission traces<br />
random magnetic fields which are strongest in spiral<br />
arms and in central starburst regions. Our recent studies,<br />
based on the nearby late type spiral galaxy and<br />
KiNGfish target NGC 6946, show a power-law correlation<br />
between star <strong>for</strong>mation rate surface density and<br />
the random magnetic field strength (Tabatabaei et al.,<br />
subm). This is observational evidence of generation<br />
Fig. III.4.6: Cumulative number surface density <strong>for</strong> M 51’s<br />
Giant Molecular Clouds (GMCs) with masses greater than M’,<br />
as identified within the paws field of view. The full sample<br />
of 1507 GMCs (dark-blue squares) has been divided in three<br />
main regions: central (red), spiral arm (light blue) and interarm<br />
regions (green). The three regions encompass dynamically<br />
distinct environments (see Meidt et al. 2012). The mass functions<br />
show a clear change in both the slope and density between<br />
different galactic environments. The vertical dashed line indicates<br />
the completeness limit of the catalog set (3.6 10 5 M 0 ).<br />
The surface area of each region over which the mass spectra is<br />
determined as labeled.


