

Annual Report 2011 Max Planck Institute for Astronomy
Annual Report 2011 Max Planck Institute for Astronomy
Annual Report 2011 Max Planck Institute for Astronomy

Create successful ePaper yourself
Turn your PDF publications into a flip-book with our unique Google optimized e-Paper software.
2.3 kpc<br />
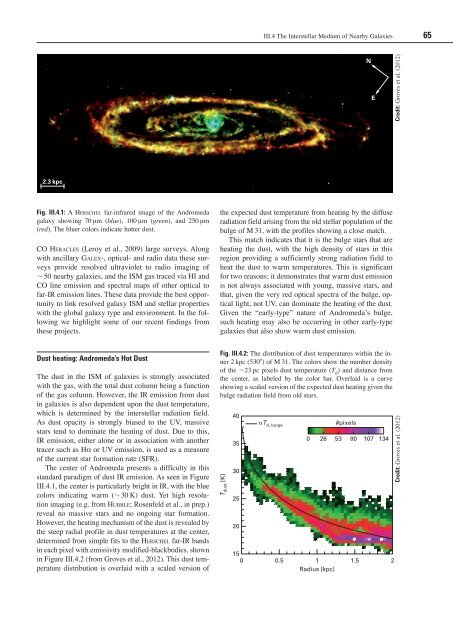
Fig. III.4.1: A herschel far-infrared image of the Andromeda<br />
galaxy showing 70 µm (blue), 100 µm (green), and 250 µm<br />
(red). The bluer colors indicate hotter dust.<br />
CO heracles (Leroy et al., 2009) large surveys. Along<br />
with ancillary Galex-, optical- and radio data these surveys<br />
provide resolved ultraviolet to radio imaging of<br />
50 nearby galaxies, and the ISM gas traced via HI and<br />
CO line emission and spectral maps of other optical to<br />
far-IR emission lines. These data provide the best opportunity<br />
to link resolved galaxy ISM and stellar properties<br />
with the global galaxy type and environment. In the following<br />
we highlight some of our recent findings from<br />
these projects.<br />
Dust heating: Andromeda’s Hot Dust<br />
The dust in the ISM of galaxies is strongly associated<br />
with the gas, with the total dust column being a function<br />
of the gas column. However, the IR emission from dust<br />
in galaxies is also dependent upon the dust temperature,<br />
which is determined by the interstellar radiation field.<br />
As dust opacity is strongly biased to the UV, massive<br />
stars tend to dominate the heating of dust. Due to this,<br />
IR emission, either alone or in association with another<br />
tracer such as Hα or UV emission, is used as a measure<br />
of the current star <strong>for</strong>mation rate (SFR).<br />
The center of Andromeda presents a difficulty in this<br />
standard paradigm of dust IR emission. As seen in Figure<br />
III.4.1, the center is particularly bright in IR, with the blue<br />
colors indicating warm (30 K) dust. Yet high resolution<br />
imaging (e.g. from hubble; Rosenfeld et al., in prep.)<br />
reveal no massive stars and no ongoing star <strong>for</strong>mation.<br />
However, the heating mechanism of the dust is revealed by<br />
the steep radial profile in dust temperatures at the center,<br />
determined from simple fits to the herschel far-IR bands<br />
in each pixel with emissivity modified-blackbodies, shown<br />
in Figure III.4.2 (from Groves et al., 2012). This dust temperature<br />
distribution is overlaid with a scaled version of<br />
III.4 The Interstellar Medium of Nearby Galaxies 65<br />
the expected dust temperature from heating by the diffuse<br />
radiation field arising from the old stellar population of the<br />
bulge of M 31, with the profiles showing a close match.<br />
This match indicates that it is the bulge stars that are<br />
heating the dust, with the high density of stars in this<br />
region providing a sufficiently strong radiation field to<br />
heat the dust to warm temperatures. This is significant<br />
<strong>for</strong> two reasons; it demonstrates that warm dust emission<br />
is not always associated with young, massive stars, and<br />
that, given the very red optical spectra of the bulge, optical<br />
light, not UV, can dominate the heating of the dust.<br />
Given the “early-type” nature of Andromeda’s bulge,<br />
such heating may also be occurring in other early-type<br />
galaxies that also show warm dust emission.<br />
Fig. III.4.2: The distribution of dust temperatures within the inner<br />
2 kpc (530) of M 31. The colors show the number density<br />
of the 23 pc pixels dust temperature (T d ) and distance from<br />
the center, as labeled by the color bar. Overlaid is a curve<br />
showing a scaled version of the expected dust heating given the<br />
bulge radiation field from old stars.<br />
T dust [K]<br />
40<br />
35<br />
30<br />
25<br />
20<br />
aT d, bulge<br />
15<br />
0 0.5<br />
0 26<br />
1<br />
Radius [kpc]<br />
#pixels<br />
N<br />
E<br />
53 80 107 134<br />
1.5 2<br />
Credit: Groves et al. (2012)<br />
Credit: Groves et al. (2012)


