Trade and Fiscal Incentives - National Agricultural and Fishery ...
Trade and Fiscal Incentives - National Agricultural and Fishery ...
Trade and Fiscal Incentives - National Agricultural and Fishery ...

You also want an ePaper? Increase the reach of your titles
YUMPU automatically turns print PDFs into web optimized ePapers that Google loves.
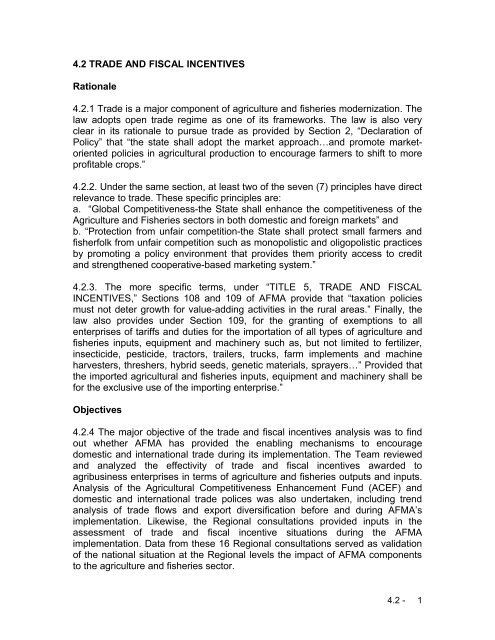
4.2 TRADE AND FISCAL INCENTIVES<br />
Rationale<br />
4.2.1 <strong>Trade</strong> is a major component of agriculture <strong>and</strong> fisheries modernization. The<br />
law adopts open trade regime as one of its frameworks. The law is also very<br />
clear in its rationale to pursue trade as provided by Section 2, “Declaration of<br />
Policy” that “the state shall adopt the market approach…<strong>and</strong> promote marketoriented<br />
policies in agricultural production to encourage farmers to shift to more<br />
profitable crops.”<br />
4.2.2. Under the same section, at least two of the seven (7) principles have direct<br />
relevance to trade. These specific principles are:<br />
a. “Global Competitiveness-the State shall enhance the competitiveness of the<br />
Agriculture <strong>and</strong> Fisheries sectors in both domestic <strong>and</strong> foreign markets” <strong>and</strong><br />
b. “Protection from unfair competition-the State shall protect small farmers <strong>and</strong><br />
fisherfolk from unfair competition such as monopolistic <strong>and</strong> oligopolistic practices<br />
by promoting a policy environment that provides them priority access to credit<br />
<strong>and</strong> strengthened cooperative-based marketing system.”<br />
4.2.3. The more specific terms, under “TITLE 5, TRADE AND FISCAL<br />
INCENTIVES,” Sections 108 <strong>and</strong> 109 of AFMA provide that “taxation policies<br />
must not deter growth for value-adding activities in the rural areas.” Finally, the<br />
law also provides under Section 109, for the granting of exemptions to all<br />
enterprises of tariffs <strong>and</strong> duties for the importation of all types of agriculture <strong>and</strong><br />
fisheries inputs, equipment <strong>and</strong> machinery such as, but not limited to fertilizer,<br />
insecticide, pesticide, tractors, trailers, trucks, farm implements <strong>and</strong> machine<br />
harvesters, threshers, hybrid seeds, genetic materials, sprayers…” Provided that<br />
the imported agricultural <strong>and</strong> fisheries inputs, equipment <strong>and</strong> machinery shall be<br />
for the exclusive use of the importing enterprise.”<br />
Objectives<br />
4.2.4 The major objective of the trade <strong>and</strong> fiscal incentives analysis was to find<br />
out whether AFMA has provided the enabling mechanisms to encourage<br />
domestic <strong>and</strong> international trade during its implementation. The Team reviewed<br />
<strong>and</strong> analyzed the effectivity of trade <strong>and</strong> fiscal incentives awarded to<br />
agribusiness enterprises in terms of agriculture <strong>and</strong> fisheries outputs <strong>and</strong> inputs.<br />
Analysis of the <strong>Agricultural</strong> Competitiveness Enhancement Fund (ACEF) <strong>and</strong><br />
domestic <strong>and</strong> international trade polices was also undertaken, including trend<br />
analysis of trade flows <strong>and</strong> export diversification before <strong>and</strong> during AFMA’s<br />
implementation. Likewise, the Regional consultations provided inputs in the<br />
assessment of trade <strong>and</strong> fiscal incentive situations during the AFMA<br />
implementation. Data from these 16 Regional consultations served as validation<br />
of the national situation at the Regional levels the impact of AFMA components<br />
to the agriculture <strong>and</strong> fisheries sector.<br />
4.2 - 1
Targets<br />
4.2.5 Relative to trade <strong>and</strong> fiscal incentives, the major target of AFMA is to<br />
provide the enabling policy environment such that Philippine agriculture <strong>and</strong><br />
fishery products can have the competitive edge in terms of product quality, price,<br />
<strong>and</strong> volume of output produced with the greatest relative efficiency in the use of<br />
resources, as needed by the domestic <strong>and</strong> global markets.<br />
Empirical Findings<br />
General Trends in <strong>Agricultural</strong> <strong>Trade</strong><br />
4.2.6 <strong>Agricultural</strong> trade has two basic components in this analysis: export <strong>and</strong><br />
imports of agricultural outputs, <strong>and</strong> export <strong>and</strong> imports of agricultural inputs or<br />
those used in the production of agricultural outputs. These two general trends in<br />
agricultural output/input trade are analyzed before (1993-1998) the enactment of<br />
AFMA <strong>and</strong> after (post) enactment (1999-2005) or during AFMA implementation.<br />
4.2.7 The trend in total agriculture output exports before (1993-1998) <strong>and</strong> during<br />
(1999-2005) AFMA implementation is shown in Figure 4.2.1. The average values<br />
of agricultural output exports before <strong>and</strong> after AFMA were almost in the same US<br />
(FOB) $2,000 million levels. Before AFMA, total value of agriculture export<br />
averaged US (FOB) $2,052.3 million. In contrast, agricultural export value after<br />
AFMA implementation averaged US (FOB) $ 2059 million. Several events<br />
affected the agricultural export performance during the AFMA implementation<br />
years. One was the lagged effect of the financial crisis in 1997-1998 which<br />
brought uncertainty in the financial sector. The other more serious problem<br />
during the period was the El Niño phenomenon in crop years 1998-1999,<br />
affecting the volume of exports. During the period 2005 however, total<br />
agricultural output export value peaked at US $ 2,552 million overtaking the<br />
average export value during the pre-AFMA period (Figure 4.2.1).<br />
4.2 - 2
Value (F.O.B in million US$)<br />
Figure 4.2.1 Trends in <strong>Agricultural</strong> <strong>Trade</strong> of <strong>Agricultural</strong> Outputs Pre <strong>and</strong> Post AFMA<br />
3000<br />
2500<br />
2000<br />
1500<br />
1000<br />
500<br />
0<br />
PRE (1993-1998) POST (1999-2005)<br />
1993 1994 1995 1996 1997 1998 1999 2000 2001 2002 2003 2004 2005<br />
Year<br />
Import of <strong>Agricultural</strong> Outputs<br />
Export of <strong>Agricultural</strong> Output<br />
4.2.8 Value of total agricultural output imports on the other h<strong>and</strong>, rose from a low<br />
of US $1,163 million in 1993 to a high of US $2,428 in 1996 during the pre-AFMA<br />
period. Henceforth, output import values averaged US $2,300 million per annum<br />
after AFMA. It is also interesting to note that before AFMA, during the years 1993<br />
to 1995, value of total agricultural exports exceeded that of imports. However,<br />
from 1996 onwards <strong>and</strong> during the entire period after AFMA, total value of output<br />
imports exceeded exports (Figure 4.2.1).<br />
4.2.9 On the average, agricultural output exports were dominated by food <strong>and</strong><br />
live animals before (91%) <strong>and</strong> post (67%) AFMA period. Tobacco became a<br />
major commodity export after AFMA enactment sharing on the average 24% of<br />
total output export receipts (Figure 4.2.2). Import values of agricultural imports<br />
were dominated by food (cereals, cereal preparations, <strong>and</strong> dairy products) <strong>and</strong><br />
crude materials during the pre <strong>and</strong> post AFMA period (Figure 4.2.3).<br />
4.2 - 3
Figure 4.2.2 Average Value of Major Exports of <strong>Agricultural</strong> Outputs, Pre <strong>and</strong> post AFMA<br />
2% 6% 1%<br />
6%<br />
81%<br />
11%<br />
2%<br />
91%<br />
100% = US$ FOB Value<br />
PRE AFMA (1993-1998) POST AFMA (1999-2005)<br />
6%<br />
3%<br />
I. Food <strong>and</strong> Live Animals<br />
24%<br />
II. Tobacco & Tobacco Manufactures<br />
III. Crude Materials<br />
IV. Animal/Vegetable Oils & Fats<br />
Figure 4.2.3 Average Value of Major Imports of <strong>Agricultural</strong> Outputs, Pre <strong>and</strong> post AFMA<br />
100% = US$ FOB Value<br />
PRE AFMA (1993-1998) POST AFMA (1999-2005)<br />
7%<br />
I. Food <strong>and</strong> Live Animals<br />
9%<br />
II. Tobacco & Tobacco Manufactures<br />
III. Crude Materials<br />
IV. Animal/Vegetable Oils & Fats<br />
4%<br />
80%<br />
67%<br />
4.2 - 4
4.2.10 Trends in the agricultural input trade is shown in Figure 4.2.4. Imports of<br />
agricultural inputs surpassed significantly exports during pre <strong>and</strong> post AFMA<br />
periods. Fertilizer (crude <strong>and</strong> manufactured) shared 53 to 59% of total value of<br />
agricultural inputs export values during both pre <strong>and</strong> post AFMA periods.<br />
Likewise, feeding stuff for animals shared a range of 33-36% of average<br />
agricultural input export values during both periods (Figure 4.2.5). Major<br />
agricultural input imports on the other h<strong>and</strong>, were dominated by feedstuff <strong>and</strong><br />
fertilizer with aggregate 72% share of average value during the pre-AFMA period.<br />
In contrast, this aggregate share was almost steady (71%) during the post-AFMA<br />
years but with the emerging imports of agricultural chemicals <strong>and</strong> materials<br />
(22%) during the AFMA implementation years (Figure 4.2.6).<br />
Value (F.O.B. in Million US$)<br />
Figure 4.2.4 Trends in <strong>Agricultural</strong> <strong>Trade</strong> of <strong>Agricultural</strong> Inputs Pre <strong>and</strong> Post AFMA<br />
1000<br />
900<br />
800<br />
700<br />
600<br />
500<br />
400<br />
300<br />
200<br />
100<br />
0<br />
PRE (1993-1998) POST (1999-2005)<br />
1993 1994 1995 1996 1997 1998 1999 2000 2001 2002 2003 2004 2005<br />
Year<br />
Export of <strong>Agricultural</strong> Input<br />
Import of <strong>Agricultural</strong> Inputs<br />
4.2 - 5
Fig 4.2.5 Average Value of Major Exports of <strong>Agricultural</strong> Inputs Pre <strong>and</strong> Post<br />
AFMA<br />
100% = US$ FOB Value<br />
36%<br />
2%<br />
3%<br />
40%<br />
PRE AFMA (1993-1998) POST-AFMA (1999-2005)<br />
15%<br />
13%<br />
59%<br />
32%<br />
I. Fertilizer<br />
33%<br />
6%<br />
II. <strong>Agricultural</strong> Chemicals & Materials<br />
III. <strong>Agricultural</strong> Machinery<br />
8%<br />
IV. Feeding stuff for animal(excluding unmilled cereal)<br />
Figure 4.2.6 Average Value of Major Imports of <strong>Agricultural</strong> Inputs, Pre <strong>and</strong> Post<br />
AFMA<br />
100% = US$ FOB Value<br />
PRE AFMA (1993-1998) POST AFMA (1999-2005)<br />
I. Fertilizer<br />
44%<br />
II. <strong>Agricultural</strong> Chemicals & Materials<br />
III. <strong>Agricultural</strong> Machinery<br />
7%<br />
IV. Feeding stuff for animal(excluding unmilled cereal)<br />
27%<br />
22%<br />
53%<br />
4.2 - 6
Market Shares of Philippine <strong>Agricultural</strong> Exports<br />
4.2.11 The weighted average market shares of selected Philippine agricultural<br />
exports were also computed before <strong>and</strong> after AFMA implementation.<br />
Coconut Oil<br />
4.2.12 The major markets of coconut oil export before <strong>and</strong> after AFMA<br />
implementation showed minimal dispersal of the market for coconut oil export<br />
from the pre-AFMA to the AFMA period. The biggest markets remain to be the<br />
USA <strong>and</strong> the Netherl<strong>and</strong>s, comprising about 70-80% of the market (Figure<br />
4.2.7).<br />
Figure 4.2.7. Major Markets of Coconut Oil Exports, Pre <strong>and</strong> Post AFMA period<br />
Malaysia<br />
1%<br />
Indonesia<br />
6%<br />
Japan<br />
3%<br />
Netherl<strong>and</strong>s<br />
(Holl<strong>and</strong>)<br />
36%<br />
PRE AFMA (1993-1998) POST AFMA (1999-2005)<br />
PRE (1993-1998)<br />
POST (1999-2005)<br />
Others<br />
12%<br />
USA<br />
42%<br />
Malaysia<br />
7%<br />
Japan<br />
5%<br />
Italy<br />
1%<br />
China, People's<br />
Rep. Of<br />
2%<br />
Netherl<strong>and</strong>s<br />
(Holl<strong>and</strong>)<br />
35%<br />
Others<br />
12%<br />
USA<br />
38%<br />
4.2 - 7
Fresh Banana<br />
4.2.13 Figure 4.2.8 shows the major markets for fresh banana before <strong>and</strong> during<br />
AFMA implementation. The chart shows that there is dispersal of the market,<br />
although minimal after AFMA implementation. Japan’s average market share<br />
before AFMA deceased from 63.13% to 56.04% after AFMA. As a result, other<br />
countries like China, Taiwan, <strong>and</strong> Iran gained bigger average shares during this<br />
period.<br />
Saudi Arabia<br />
6%<br />
Korea,<br />
Republic of<br />
7%<br />
United Arab<br />
Emirates<br />
8%<br />
Figure 4.2.8 Major Markets of Banana Exports, Pre <strong>and</strong> Post AFMA period<br />
PRE AFMA PRE (1993-1998)<br />
POST AFMA POST (1999-2005)<br />
China,<br />
People's Rep.<br />
Of<br />
9%<br />
Others<br />
7%<br />
Japan<br />
63%<br />
China, Rep. Of<br />
Taiw an<br />
8%<br />
China, People's<br />
Rep. Of<br />
12%<br />
Korea, Republic<br />
of<br />
7%<br />
United Arab<br />
Emirates<br />
8%<br />
Others<br />
7%<br />
Iran<br />
2%<br />
4.2 - 8<br />
Japan<br />
56%
Shrimps <strong>and</strong> Prawns<br />
4.2.14 Figure 4.2.9 shows that before AFMA, Japan was the biggest market for<br />
shrimp <strong>and</strong> prawn exports accounting for about 80% of the market, on the<br />
average. With AFMA implementation, Japan’s average share in the export<br />
declined to 63%. This gave way to the increase in Korea’s market share after<br />
AFMA.<br />
Figure 4.2.9 Major Markets of Shrimp <strong>and</strong> Prawn Exports, Pre <strong>and</strong> Post AFMA period<br />
PRE AFMA (1993-1998) POST AFMA (1999-2005)<br />
Korea, Republic<br />
of<br />
5%<br />
USA<br />
10%<br />
Others<br />
5%<br />
Japan<br />
80%<br />
Korea,<br />
Republic of<br />
13%<br />
USA<br />
12%<br />
Guam<br />
1%<br />
Spain<br />
3%<br />
Canada<br />
1%<br />
Others<br />
6%<br />
Japan<br />
64%<br />
4.2 - 9
Pineapple <strong>and</strong> Pineapple Products<br />
4.2.15 There was a diversified market for pineapple <strong>and</strong> pineapple products<br />
export after AFMA. Before implementation, only the USA <strong>and</strong> Japan had<br />
substantial market shares in the export of Philippine pineapple <strong>and</strong> pineapple<br />
products. With AFMA implementation, the Netherl<strong>and</strong>s, Korea, <strong>and</strong> some other<br />
countries increased their average share in absorbing the export commodity<br />
(Figure 4.2.10).<br />
Korea,<br />
Republic of<br />
3%<br />
Canada<br />
4%<br />
Netherl<strong>and</strong>s<br />
(Holl<strong>and</strong>)<br />
5%<br />
Figure 4.2.10 Major Markets of Pineapple Exports, Pre <strong>and</strong> Post AFMA period<br />
PRE AFMA (1993-1998) (1993-1998)<br />
Others<br />
17%<br />
Japan<br />
18%<br />
USA<br />
53%<br />
Belgium<br />
0%<br />
Korea,<br />
Republic of<br />
4%<br />
POST AFMA POST (1999-2005)<br />
Canada<br />
2%<br />
Spain<br />
0% Others<br />
17%<br />
Netherl<strong>and</strong>s<br />
(Holl<strong>and</strong>)<br />
5%<br />
Japan<br />
19%<br />
4.2 - 10<br />
USA<br />
53%
Tuna<br />
4.2.16 The average market shares for tuna export before <strong>and</strong> during AFMA<br />
implementation are shown in Figure 4.2.11. The chart shows that before AFMA,<br />
the biggest markets of the Philippines’ tuna export were the USA, Japan, <strong>and</strong><br />
Germany. After AFMA, the average market share of this Philippine export to the<br />
USA slightly increased, while that of Japan <strong>and</strong> Germany’s decreased. Other<br />
countries such as Singapore <strong>and</strong> Taiwan, gained bigger average shares of the<br />
export. Furthermore, the market for the product grew to include more countries,<br />
although with smaller shares.<br />
Singapore<br />
2%<br />
Figure 4.2.11 Major Markets of Tuna Exports, Pre <strong>and</strong> Post AFMA period<br />
PRE AFMA (1993-1998) POST AFMA (1999-2005)<br />
UK & Northern<br />
Irel<strong>and</strong><br />
7%<br />
South Africa,<br />
Republic of<br />
2%<br />
Others<br />
25%<br />
Canada<br />
8%<br />
USA<br />
23%<br />
Germany,<br />
Federal<br />
Republic<br />
12%<br />
Japan<br />
21%<br />
Others<br />
34%<br />
China, Rep. Of<br />
Taiw an<br />
1%<br />
Singapore<br />
6%<br />
Canada<br />
8%<br />
USA<br />
31%<br />
Japan<br />
15%<br />
Germany,<br />
Federal Republic<br />
5%<br />
4.2 - 11
Desiccated Coconut<br />
4.2.17 The markets for desiccated coconut before <strong>and</strong> after the AFMA are<br />
illustrated in Figure 4.2.12. The chart for the period before AFMA shows that the<br />
major market for desiccated coconut was the USA, accounting, on the average,<br />
for about half of the export product. The other half was distributed among a few<br />
other countries. With AFMA’s implementation, USA’s average share decreased<br />
by about 10%. The remaining share is distributed among a more diverse number<br />
of countries such as Belgium, Taiwan, <strong>and</strong> the Netherl<strong>and</strong>s with more significant<br />
shares in the value of export.<br />
Figure 4.2.12 Major Markets of Desiccated Coconut Exports, Pre <strong>and</strong> Post AFMA<br />
period<br />
Canada<br />
5%<br />
Brazil<br />
3%<br />
Others<br />
25%<br />
Germany,<br />
Federal<br />
Republic<br />
7%<br />
PRE AFMA (1993-1998)<br />
Australia<br />
6%<br />
UK & Northern<br />
Irel<strong>and</strong><br />
8%<br />
USA<br />
46%<br />
Netherl<strong>and</strong>s<br />
(Holl<strong>and</strong>)<br />
1%<br />
Belgium<br />
3%<br />
POST AFMA (1999-2005)<br />
China, Rep.<br />
Of Taiwan<br />
2%<br />
Others<br />
32%<br />
Canada<br />
8%<br />
Germany,<br />
Federal<br />
Republic<br />
4%<br />
4.2 - 12<br />
USA<br />
38%<br />
UK &<br />
Northern<br />
Irel<strong>and</strong><br />
10%<br />
Australia<br />
2%
Seaweeds <strong>and</strong> Carrageenan<br />
4.2.18 The market of seaweed <strong>and</strong> carrageenan exports for the years before <strong>and</strong><br />
during AFMA implementation showed consistent diversity (Figure 4.2.13). The<br />
country destinations include the USA, Denmark, Great Britain, <strong>and</strong> France.<br />
4.2.19 In summary, the analysis indicated that imports of both agricultural output<br />
<strong>and</strong> inputs exceeded exports during the AFMA implementation. Furthermore the<br />
analysis also showed no major changes in the destinations of Philippine<br />
agricultural exports before <strong>and</strong> post AFMA <strong>and</strong> despite Philippines’ membership<br />
to GATT-WTO.<br />
Figure 4.2.13 Major Markets of Seaweeds <strong>and</strong> Carrageenan Exports, Pre <strong>and</strong> Post<br />
AFMA period<br />
Korea<br />
1%<br />
Others<br />
43%<br />
Australia<br />
3%<br />
PRE AFMA (1993-1998)<br />
PRE (1993-1998)<br />
Denmark<br />
Germany, 8%<br />
Federal<br />
Republic<br />
1%<br />
USA<br />
15%<br />
France<br />
14%<br />
UK & Northern<br />
Irel<strong>and</strong><br />
15%<br />
Others<br />
45%<br />
Canada<br />
2%<br />
POST AFMA POST (1999-2005)<br />
Hongkong<br />
2%<br />
USA<br />
14%<br />
Denmark<br />
16%<br />
France<br />
13%<br />
UK &<br />
Northern<br />
Irel<strong>and</strong><br />
8%<br />
4.2 - 13
Constraints to Philippine <strong>Agricultural</strong> Export Performance<br />
4.2.20 AFMA was enacted in 1997 as an enabling legislation to enhance the<br />
global competitiveness of Philippine <strong>Agricultural</strong> products. Before the enactment<br />
of AFMA, the Philippines has become a member of the General Agreement on<br />
Tariff <strong>and</strong> <strong>Trade</strong> – Uruguay Rounds (GATT-UR), now currently implemented by<br />
the World <strong>Trade</strong> Organization (WTO). The implementation period of the WTO<br />
agreement (1995-2004) overlapped with the implementation period (1998present)<br />
of AFMA. Given this overlap, Philippine agricultural trade performance<br />
can be viewed within the context of AFMA <strong>and</strong> the GATT-WTO, because by<br />
definition the provisions of AFMA <strong>and</strong> the GATT-WTO were focused on how to<br />
enhance the global competitiveness of Philippine agricultural products.<br />
4.2.21 Two types of commitments were made by the Philippines in joining GATT-<br />
WTO: external commitments of the Philippines in compliance with the<br />
agreement, <strong>and</strong> internal commitments to Filipino farmers. Philippine<br />
commitments to the external agreement include: enhanced market access,<br />
removal of domestic support (13% reduction from 1995 to 2004 for trade<br />
distorting support) <strong>and</strong> no use of export subsidies; tariffication of all quantitative<br />
restrictions (QRs); prohibition of non-tariff measures (NTMs); minimum access<br />
volumes (MAVs) of 3 percent of 1986 to 1988 consumption for 1995 <strong>and</strong> 5% of<br />
1986 to 1988 consumption for 2004; reduction in tariff bindings by 24 percent<br />
with minimum 10 percent cut per tariff line from 1995 to 2004; <strong>and</strong> plant variety<br />
registration <strong>and</strong> protection (patent or sui generis system).<br />
4.2.22 For its internal commitments to farmers, the Philippines promised to<br />
provide an action <strong>and</strong> budget plan for GATT-UR adjustment measures (safety<br />
nets); enactment of appropriate legislations (e.g. Agriculture <strong>and</strong> Fisheries<br />
Modernization Act (AFMA)) to provide tariff reductions on inputs, as well as trade<br />
remedies to act as safeguards against import surges, injuries to domestic<br />
industries <strong>and</strong> dumping; reforms in the value added tax (VAT) for agroprocessors;<br />
budgetary support to agriculture amounting to P73 billion from 1995<br />
to 1998 under GATT-UR Action Plan; <strong>and</strong> support for irrigation, P28.4 billion from<br />
1995 to 1998 <strong>and</strong> P6 billion/year from 1999 to 2004. The assessment of<br />
Philippine compliance was substantial in terms of the external agreement but<br />
mixed <strong>and</strong> inadequate under domestic or internal commitments, <strong>and</strong> less than<br />
satisfactory under the AFMA (Habito, 1999).<br />
4.2.23 Specifically, in the Philippine agricultural sector, the impact of globalization<br />
(GATT-WTO) was generally a decline in global competitiveness among sensitive<br />
Philippine agribusiness products as shown by selected studies of the STRIVE<br />
Foundation (Gonzales, 1999; Gonzales et al., 2000). The global competitiveness<br />
of 5 agricultural products (rice, corn, beef cattle, hogs, broiler <strong>and</strong> eggs) was<br />
analyzed before (1994) <strong>and</strong> after (1999) accession to GATT-WTO under import<br />
<strong>and</strong> export trade regimes <strong>and</strong> demonstrated decline in global cost<br />
competitiveness.<br />
4.2 - 14
4.2.24 <strong>Trade</strong> reforms in the Philippines were unilaterally pursued in search of<br />
sustainable economic development. Agriculture together with the other sectors<br />
was a major component of the trade liberalization strategy even before the<br />
country’s accession to GATT-WTO. Of the four major areas of concern of the<br />
GATT-WTO (market access, domestic subsidies, export subsidies, <strong>and</strong> sanitary<br />
<strong>and</strong> phytosanitary or SPS measures), the major concerns of the Philippines are<br />
market access <strong>and</strong> SPS measures. In line with market access, the Philippines<br />
has removed quantitative restrictions (QRs) <strong>and</strong> converted them into tariffs, with<br />
the exception of rice. The tariffication law of 1995 or Republic Act 8178 provided<br />
for the establishment of minimum access volumes (MAVs) <strong>and</strong> the creation of the<br />
<strong>Agricultural</strong> Competitiveness Enhancement Fund (ACEP) for the development of<br />
the sector, especially those agricultural commodities detrimentally affected by the<br />
GATT-WTO agreement.<br />
4.2.25 The Philippine level of trade-distorting domestic support, in terms of input<br />
subsidies <strong>and</strong> price support for rice, corn <strong>and</strong> sugar, totaled P6.0 billion from<br />
1995-2000 or P1.0 billion per year. These subsidies are way below the de<br />
minimis level of 10% of the value of production <strong>and</strong>, therefore, the Philippines is<br />
not obligated to reduce such support. There has been, however, a conscious<br />
effort to phase out input subsidies in favor of more enduring support for<br />
productivity such as irrigation <strong>and</strong> market infrastructures.<br />
4.2.26 The Philippines did not schedule any export subsidies in its WTO<br />
commitments <strong>and</strong> therefore is not entitled to, nor does in use in practice, export<br />
subsidies. Likewise, all export taxes on agricultural product exports ended in<br />
1996. All export strategies <strong>and</strong> implementation is mainly pursued by the private<br />
sector with minimum assistance from Government.<br />
4.2.27 The Philippines is experiencing difficulties in accessing markets for its<br />
banana <strong>and</strong> pineapple exports to Australia <strong>and</strong> mangoes to the US (although at<br />
least mangoes from Guimaras isl<strong>and</strong> are now accepted in the US) <strong>and</strong> Japan.<br />
These are more related on non-tariff barrier issues which is discussed below.<br />
4.2.28 Harmonization of sanitary <strong>and</strong> phytosanitary measures with international<br />
st<strong>and</strong>ards was one of the commitments of the Philippines with GATT-WTO.<br />
Several studies of the Department of Agriculture APRAAP policy project<br />
indicated that the Philippines has yet to establish its SPS st<strong>and</strong>ards for the<br />
essential components, additives, contaminants, mycotoxin or aflatoxin levels for<br />
meat, eggs, dairy products (Manuel, 1996); SPS measures for processed foods<br />
(de Leon, 1996); SPS measures for fish <strong>and</strong> fishery products (Anzanza, 1996);<br />
<strong>and</strong> SPS for fisheries <strong>and</strong> marine quarantines (Guerrero, 1996).<br />
4.2.29 AFMA also called for the creation of the Bureau of Agriculture <strong>and</strong><br />
Fisheries Products St<strong>and</strong>ards (BAFPS). The BAFPS shall set <strong>and</strong> implement<br />
st<strong>and</strong>ards for fresh, primary- <strong>and</strong> secondary-processed agricultural <strong>and</strong> fishery<br />
4.2 - 15
products. The BAFPS can: a) formulate <strong>and</strong> enforce st<strong>and</strong>ards of quality in the<br />
processing, preservation, packaging, labeling, importation, exportation,<br />
distribution, <strong>and</strong> advertising of agricultural <strong>and</strong> fisheries products; b) conduct<br />
research <strong>and</strong> product st<strong>and</strong>ardization, alignment of local st<strong>and</strong>ards with<br />
international st<strong>and</strong>ards; <strong>and</strong> c) conduct regular inspection of processing plants,<br />
storage facilities, abattoirs, as well as public <strong>and</strong> private markets in order to<br />
ensure freshness, safety <strong>and</strong> quality of products. These two pieces of legislation<br />
lay out the overall policies on food safety <strong>and</strong> together form the legal backbone<br />
by which food st<strong>and</strong>ards are established in the Philippines.<br />
The Philippines to date has not received technical assistance in implementing<br />
SPS measures.<br />
4.2.30 The anticipated impact of the GATT-WTO Agreement was improved<br />
market access for Philippine agricultural exports. In general, markets were<br />
generally open for traditional exports within the already established markets in<br />
developed countries. In these countries volume expansion is generally no<br />
problem. However, despite the MFN status among GATT-WTO member<br />
countries, trade expansion for new products in new markets within the GATT-<br />
WTO membership is still very much a bilateral arrangement. In the case of the<br />
Philippines, both tariff <strong>and</strong> non-tariff barriers (SPS) were reasons for nonexpansion<br />
of Philippine agricultural export products among GATT-WTO<br />
countries. Tuna is a case in point. Tariff rates of Philippine tuna exports to<br />
Europe face a tariff of 24 percent, while exports from African <strong>and</strong> Caribbean<br />
countries are charged zero tariff.<br />
4.2.31 In the case of banana <strong>and</strong> pineapple exports to Australia, SPS<br />
requirements hinder Philippine exports. Under the substantial equivalence<br />
principle in the SPS harmonization agreement, the same quality banana exports<br />
are acceptable in Japan. Australia’s posture in suddenly raising its SPS<br />
st<strong>and</strong>ards to protect its inefficient banana <strong>and</strong> pineapple farmers is a clear<br />
indication of restricted trade. To persuade Australia to seriously consider<br />
dialogue on banana <strong>and</strong> pineapple exports, the Philippines had to suspend the<br />
issuance of veterinary quarantine certificates (VQCs) in 1999 for Australia’s live<br />
cattle exports. To date the issue is not yet resolved pending the verification of the<br />
risk assessment by the Australian Government regarding banana exports.<br />
4.2.32 The study done by Gonzales, Lacson <strong>and</strong> Marges (2005) indicated that<br />
Philippine export products such as mango (to Japan) <strong>and</strong> pineapple <strong>and</strong> banana<br />
(to Australia) have been constrained by SPS requirements by these two<br />
countries. Preliminary estimates of the Authors on the impact of Japan’s SPS<br />
measures in the current “positive list” were unrealized export receipt of<br />
US$127million, loss of corporate income tax revenue of US$ 20 million, <strong>and</strong><br />
forgone farm employment income opportunities close to US$ 12 million. In the<br />
Australian case the indicative estimates of opportunity losses were US$ 64million<br />
in export receipt, US$ 11 million in corporate taxes, <strong>and</strong> US$ 12 million in farm<br />
employment opportunities.<br />
4.2 - 16
4.2.33 The interlocking issues related to market access, domestic support <strong>and</strong><br />
export competition has directly affected the agricultural export performance of the<br />
Philippines. A recent study of Gonzales (2007) on trade performance of 11 less<br />
developed countries (LDCs) <strong>and</strong> 10 developed countries (DCs) of the Asia<br />
Pacific Region, indicated that the Philippines <strong>and</strong> Peru were laggards in terms of<br />
export performance during the periods 1996-1999 <strong>and</strong> 2000-2005. The average<br />
export receipts in the Philippines did not reach US$ 3 billion during the period. In<br />
contrast other LDCs like China, Thail<strong>and</strong>, Russian Federation, Indonesia,<br />
Malaysia Chile <strong>and</strong> Mexico had export revenues ranging from US$10 to 28 billion<br />
in 2005 (Figure 4.2.14)<br />
IV. <strong>Trade</strong> Performance<br />
$ Billion<br />
80<br />
70<br />
60<br />
50<br />
40<br />
30<br />
20<br />
10<br />
0<br />
Agriculture Export, LDCs <strong>and</strong> DCs in<br />
Asia-Pacific<br />
Chile<br />
1996-1999<br />
Ave:LDC=8B;DC=33B<br />
2000-2005<br />
Ave:LDC=10B;DC=35B<br />
China<br />
Indonesia<br />
Malaysia<br />
Source: WTO <strong>Trade</strong> Statistics, 2007<br />
Peru<br />
Philippines<br />
Russian Fed.<br />
Thail<strong>and</strong><br />
Australia<br />
Canada<br />
New Zeal<strong>and</strong><br />
United States<br />
Figure 4.2.14 Agriculture Export Performance of LDCs <strong>and</strong> DCs in the Asia<br />
Pacific Region<br />
4.2.34 To date the WTO negotiations are in temporary st<strong>and</strong>still but majority of<br />
members agreed to resume negotiations; technical discussions are taking place<br />
among members in various formats in multilateral context with simultaneous<br />
4.2 - 17
political guidance; but these discussions have no new set of deadlines <strong>and</strong><br />
window is limited (Dixit, 2007).<br />
4.2.35 The difficulty in the negotiations emanates from the operationalization of<br />
the key pillars of the agreement itself: a) Market access of tariffs <strong>and</strong><br />
tariffications including special safeguards <strong>and</strong> tariff quotas; b) Domestic support<br />
which centers on the interpretation of the green box, blue box, <strong>and</strong> development<br />
programs, <strong>and</strong> amber box including the di minimis principles; c) Export<br />
Competition covering export subsidies, anticircumvention (e.g. state agency<br />
exports) <strong>and</strong> export prohibitions <strong>and</strong> restrictions; <strong>and</strong> d) other rules: special <strong>and</strong><br />
differential treatments, peace clause (now expired), commitments to reforms,<br />
Non food importing developed country decision, <strong>and</strong> agreement on the<br />
application of Sanitary <strong>and</strong> Phytosanitary measures.<br />
4.2.36 The Doha Development Agenda (DDA) considered by many as the most<br />
ambitious undertaking initiated by less developed countries calls for a complete<br />
<strong>and</strong> drastic changes in the following : 80% cut in the amber box aggregate<br />
measure of support (AMS) which was only 20% cut during the UR, reduction of<br />
amber box di minimis of 2.5% of the value of production under DDA as compared<br />
to 5% value of production under the UR; 2.5 to 5% reduction under the blue box<br />
provision which was unlimited during the UR, <strong>and</strong> elimination of all forms of<br />
export subsidies not only for traditional export but other exports in quality <strong>and</strong><br />
budget outlay. How the negotiations under the DDA will be resolved will depend<br />
on the political will of both developed <strong>and</strong> developing member countries of WTO.<br />
<strong>Fiscal</strong> <strong>Incentives</strong> Under AFMA<br />
4.2.37 Section 109 provision under AFMA provides the granting of exemptions to<br />
all enterprises, of tariff <strong>and</strong> duties for the importation of agricultural inputs. From<br />
1999 to 2005 some 344 firms were granted Tariff Exemptions for Fisheries <strong>and</strong><br />
Agriculture Modernization (TEFAM). Over two fifths of these exemptions were<br />
concentrated in Regions 4 <strong>and</strong> 3 (Table 4.2.1). Regions 2, 4-B, 5, CAR, <strong>and</strong><br />
ARMM have not availed of TEFAM so far. During the AFMA implementation<br />
period the aggregate value of imports of agricultural inputs totaled PhP 25.9<br />
billion, with equivalent tariff revenue foregone by the government of PhP 777<br />
million.<br />
4.2 - 18
Table 4.2.1 Number of Firms that availed of Tariff Exemption for Fisheries<br />
<strong>and</strong> <strong>Agricultural</strong> Modernization (TEFAM) 1999 to 2005, By Region,<br />
Philippines<br />
Region / Agency Number Percent<br />
1 8 2.3<br />
2 -<br />
3 52 15.1<br />
4-A 90 26.2<br />
4-B -<br />
5 -<br />
6 23 6.7<br />
7 27 7.8<br />
8 1 0.3<br />
9 7 2<br />
10 18 5.2<br />
11 41 11.9<br />
12 9 2.6<br />
Caraga 1 0.3<br />
BOI 48 14<br />
DTI 1 0.3<br />
BFAR 18 5.2<br />
Total 344 a<br />
Source: DA<br />
100<br />
These firms had a total aggregate value of imports of P25.9 Billion.<br />
4.2.38 Soybean meal dominated the percent share (66%) of import value under<br />
TEFAM before 2003 <strong>and</strong> in 2005. The other imported inputs include machinery<br />
<strong>and</strong> equipment (13%), feed supplement <strong>and</strong> biologics (9.5%), fertilizer (5.5%),<br />
pesticide (2.9%), <strong>and</strong> the others were composed of fishmeal, livestock <strong>and</strong><br />
planting materials (Table 4.2.2). The top ten importers in 2005 under TEFAM<br />
were: San Miguel Foods (37%); Dole Philippines, Inc. (8.98%) <strong>and</strong> the others<br />
sharing to 2 to 7.6 percent of total import value in 2005 include: Philippine<br />
Foremost Milling Corporation, Tyson Agro-Ventures, Inc., Nation Granary Inc.,<br />
Pampanga Angeles Livestock, Southern Negros Development Corporation,<br />
Philippine Super Feed Corporation, Fil-Am Foods, Inc. <strong>and</strong> Vitarich Corporation<br />
(Table 4.2.3).<br />
4.2 - 19
Table 4.2.2. Value <strong>and</strong> Percent Share of Importation by Commodity Under<br />
E.O. 376, 2005<br />
Commodity Value % Share<br />
(in million PhP)<br />
Soybean meal 10,199.90 66.1<br />
Machinery & equipment 2,005.20 13<br />
Feed supplement, vitamins & other veterinary products 1,469.10 9.5<br />
Fertilizers 851.8 5.5<br />
Pesticides 447.9 2.9<br />
Fish meal/whey powder 277 1.8<br />
Livestocks (catte & hogs) 154.9 1<br />
Planting materials (Oil palm) 7.1 0<br />
Others 8.1 0.1<br />
Total 15,421.00 100<br />
Table 4.2.3. Top Ten Importers Under EO 376, 2005.<br />
Name of Enterprise Enterprise Activity Assets Value of Import Percent Tariff Waived<br />
(PhP million) (PhP million) Share (in Million PhP)<br />
1. San Miguel Foods, Inc. Poultry & livestock Prod. & feedmilling 10,641.90 5,713.70 37.04 171.4<br />
2. Dole Phils, Inc. Processing 10,508.70 1,384.60 8.98 41.5<br />
3. Philippine Foremost Milling Corporation Feed manufacturing 3,302.40 1,172.20 7.6 35.2<br />
4. Tyson Agro-Ventures, Inc. Poultry raising 774.9 687.9 4.46 20.6<br />
5. Nation Granary Inc. Post harvest facilities 1,352.30 613.6 3.98 18.4<br />
6. Pampanga-Angeles Livestock Hog production 500 583.6 3.78 17.5<br />
7. Southern Negros Devt. Corp. * Production of sugar 2,919.20 583 3.78 17.5<br />
8. Philippine Super Feed, Corp. Feed manufacturing 624.4 531.5 3.45 15.9<br />
9. Fil-Am Foods, Inc. Hog production 1,201.40 424 2.75 12.7<br />
10. Vitarich Corporation Feed milling 4,264.00 386 2.5 11.6<br />
Sub-total 12,080.20 78.32 362.4<br />
Others** 3,340.90 21.68 100.2<br />
Gr<strong>and</strong> Total 15,421.00 100 462.6<br />
Source: DA<br />
4.2.39 It is worthwhile to note that among the 2005 top ten importers under<br />
TEFAM, seven (7) were involved directly in poultry <strong>and</strong> livestock production <strong>and</strong><br />
feedmilling. Hence, the possible explanation why soybean meal imports, a crucial<br />
ingredient in the manufacture of animal feeds had the highest value share among<br />
the commodity imports of E.O 367. The three other importers were involved in<br />
fruit processing, sugar production <strong>and</strong> post harvest facilities (Table4.2.3) The<br />
major imports were dominated by large firms because small firms <strong>and</strong><br />
cooperatives were constrained by their inability to open letter of credit (LC).<br />
The Agriculture Competitiveness Enhancement Fund (ACEF)<br />
4.2.40 ACEF was created under RA 8178, known as the <strong>Agricultural</strong> Tarrification<br />
Act of 1996. ACEF is a safety net measure that is supposed to enhance the<br />
4.2 - 20
competitiveness of the agricultural sector due to the impact of globalization. It<br />
was credited to special account 183 with automatic appropriation from the<br />
General Fund. The ACEF funds are sourced from in-quota import tariff<br />
collections of the Minimum Access Volume (MAV) of sensitive commodities such<br />
as corn, sugar, poultry, pork, potatoes, <strong>and</strong> coffee.<br />
4.2.41 Although ACEF is not a direct provision of AFMA it has congruence with<br />
fiscal incentives/credit availment by agribusiness enterprises involved in external<br />
trade. Availment of ACEF credit at the Regional level will enhance trade capacity<br />
of stakeholders.<br />
4.2.42 The financial status of ACEF allocation is shown in Table 4.2.4. As of<br />
August 2005, the total actual collections in Fund 183 , since 1999 to 2003 was<br />
PhP 5.484 billion. Of this amount, total ACEF-Executive Committee approved<br />
projects totaling PhP 2.795 billion, composed of 81 regular ACEF projects <strong>and</strong> 93<br />
sugar ACEF projects. The unallocated amount available in Fund 183 as of<br />
August 2006 was PhP 2.688 billion (Table 4.2.4).<br />
Table 4.2.4. Status of the <strong>Agricultural</strong> Competitiveness Enhancement Fund<br />
(ACEF) Summary as of 15 August 2005<br />
Particulars Amount<br />
(PhP)<br />
Total Actual Collections in Fund 183 (ACEF)* 5,483,872,670.20<br />
MAV In-Quota Tariffs (RA 8178, 1996) 4,342,526,703.80<br />
1999 Collections 153,087,725.00<br />
2000 Collections 924,875,557.30<br />
2001 Collections 761,487,265.20<br />
2002 Collections 1,909,316, 391.20<br />
Sugar Conversion Fees (EO 87, 1999) 1,141,345,966.40<br />
Total Cost of ACEF-Executive Committee (EXECOM) Approved Projects 2,795,921,525.00<br />
81 Regular ACEF Projects (AO 39 s.99/AO 10 s.00) 2,195,921,525.00<br />
Released by DBM (for 80 Projects) 2,153,518,125.00<br />
Request from DBM Deferred (for 1 Project) 27,370,000.00<br />
Released by DBM (for NTS/MAVSec Admin. Fund) 5,033,400.00<br />
FS Fund (Unused / Reverted) 10,000,000.00<br />
93 Sugar-ACEF Projects (AO 28 s.00) 600,000,000.00<br />
Released by DBM 599,543,000.00<br />
Requested from DBM 457,000.00<br />
Unallocated Amount Available in Fund 183 2,687,951,145.20<br />
*Certified by the Bureau of Treasury (BTr)<br />
Source: ACEF <strong>National</strong> Technical Committee<br />
4.2.43 The analysis done by CFA-UAP <strong>and</strong> Supply Chain Academy of the<br />
Philippines (2005) indicated the following: Of the total 80 regular ACEF projects<br />
approved, Luzon has the most number of projects with 34. It was followed by<br />
4.2 -<br />
21
Mindanao <strong>and</strong> Visayas with 25 <strong>and</strong> 18 projects, respectively. Only three projects<br />
were categorized as national in scope (Table 4.2.5).<br />
Table 4.2.5. ACEF Loan Approved for Regular Projects by Area<br />
(as of September 2005)<br />
Area Number of Projects ACEF Loan Approved (PhP)<br />
Luzon 34 555,237,212<br />
Visayas 18 187,940,666<br />
Mindanao 25 382,378,893<br />
<strong>National</strong> 3 1,027,961,354<br />
TOTAL 80 2,153,518,125<br />
Source: ACEF <strong>National</strong> Technical Committee, as analyzed by CFA-UAP <strong>and</strong> Supply Chain<br />
Academy of the Philippines (2005)<br />
4.2.44 In terms of value, the ACEF regular projects covering the whole country<br />
accounted for 47% (P1.03 billion for 3 projects) of the total loan. The P1.0 billion<br />
was a wholesale loan to Quedancor for a fee 2% for retail lending to small<br />
farmers at a ceiling of 9.5% (Source: ACEF Technical Committee). Meanwhile,<br />
Luzon was 27% (P555.24 million for 34 projects) of the total loan. Mindanao has<br />
17% (P382.38 million for 25 projects) <strong>and</strong> Visayas 9% (P187.94 million for 18<br />
projects). By Region, the highest number of loans was in Region III (17). It was<br />
followed by Region VI (10) <strong>and</strong> Region XI (9) (Table 4.2.6).<br />
Table 4.2.6. Number of Loans by Loan Size by Region (As of September 2005)<br />
Region Loan Size (in Php)<br />
Less than 5M to less 10M to less 15M to less 20M to less 25M to less 30M <strong>and</strong><br />
5m than 10M than 15 M than 20M than 25M than 30M above<br />
Total<br />
CAR 2 2<br />
I 1 1 2 1 5<br />
II 1 2 3<br />
III 5 3 3 1 3 1 1 17<br />
IV-A 1 2 1 1 1 6<br />
IV-B 1 1<br />
V 0<br />
VI 3 2 3 1 1 10<br />
VII 2 1 1 4<br />
VIII 2 2 4<br />
IX 0<br />
X 1 3 1 1 1 7<br />
XI 1 4 1 2 1 9<br />
XII 1 1 2 4<br />
CARAGA 1 1<br />
ARMM 1 1 1 1 4<br />
NATIONWIDE 1 1 1(A) 3<br />
TOTAL 14 16 18 9 8 8 6 80<br />
Source: ACEF <strong>National</strong> Technical Committee, as analyzed by CFA-UAP <strong>and</strong> Supply Academy of the<br />
Philippines<br />
4.2 - 22
4.2.45 Apparently, ACEF Executive Committee is faced with difficulty in<br />
dispensing the remaining PhP 2.7 billion unallocated amount for two reasons:<br />
first, the DBM has put a cap of PhP 800,000 / year on all projects <strong>and</strong> second,<br />
ACEF will expire by 2007. In this regard, the CFA-UAP <strong>and</strong> Supply Academy of<br />
the Philippines study suggested four strategic options:<br />
a. Extending ACEF to 2015;<br />
b. Converting ACEF into an endowment fund;<br />
c. Merging ACEF into an existing institution; <strong>and</strong><br />
d. Converting ACEF into a venture-capital / credit fund<br />
The pros <strong>and</strong> cons of these options should be further studied in more detail to<br />
arrive at the optimum strategic option(s).<br />
AFMA Regional Consultations<br />
4.2.46 The consultations covered 16 Regions. In addition, questionnaires were<br />
given to participants before <strong>and</strong> during the workshop consultation meetings. The<br />
individual / group questionnaires were focused on the individual perceptions on<br />
the awareness of AFMA. This Regional analysis is focused on two fronts: first,<br />
Regional participants’ individual perception on trade, tariff exemptions <strong>and</strong> the<br />
ACEF; <strong>and</strong> second, group’s Regional workshop outputs on the general impact of<br />
AFMA, in particular, the trade component, on major commodity / subsectors (rice,<br />
corn, grains, high value commercial crops, livestock <strong>and</strong> poultry, <strong>and</strong> fisheries).<br />
Stakeholders’ Perception on <strong>Trade</strong>-Related Issues<br />
4.2.47 When stakeholders were asked to prioritize <strong>and</strong> rank components of<br />
AFMA as central to agricultural modernization, individual respondents across<br />
Regions ranked trade, on the average, at 7.6 (Table 4.2.7) the range was 4 th<br />
(CARAGA) to 10 th rank (CAR, Regions 1 <strong>and</strong> 11). It is underst<strong>and</strong>able why<br />
stakeholders did not see the relative importance of trade at this stage of<br />
Philippine agricultural development. They are more preoccupied with the basic<br />
physical infrastructures (irrigation <strong>and</strong> postharvest facilities, other infrastructures,<br />
e.g. farm to market roads) <strong>and</strong> support services such as credit, marketing<br />
assistance, information support research <strong>and</strong> development, among others, that<br />
are necessary conditions in achieving efficiency in external trade. Since the<br />
envisioned complete package of investment interventions to ensure agricultural<br />
transition to modernization did not take place, farmers were pragmatic in isolating<br />
individual components of these modernization determinants as they see fit.<br />
4.2 - 23
Table 4.2.7. Perceived Respondents' Priority Rankings of <strong>Trade</strong> as<br />
Component of AFMA, By Region<br />
Region Ranking<br />
CAR 10<br />
CARAGA 4<br />
1 10<br />
2 9.5<br />
3 7.5<br />
4a 6<br />
4b 9<br />
5 7<br />
6 8<br />
7 6<br />
8 6<br />
9 5.5<br />
10 5<br />
11 10<br />
12 9<br />
ARMM 9<br />
Average 7.6<br />
Source: AFMA Regional Consultation<br />
4.2.48 Regarding respondents’ satisfaction with export performance of<br />
agricultural products, only 32 percent across Regions were satisfied; 37%, not<br />
satisfied; <strong>and</strong> the remaining 28% had no answer / didn’t know (Table 4.2.8).<br />
Relative to their perception whether agricultural exports improved after AFMA,<br />
only 8 percent of the 180 respondents answered yes; 31% no, <strong>and</strong> majority<br />
(61%) responded didn’t know / no answer (Table 4.2.9). The above responses of<br />
the 180 Regional respondents on trade performance were not farfetched from<br />
national trends on trade <strong>and</strong> earlier analyzed in this report. The performance of<br />
agricultural commodity exports during AFMA implementation was not as robust<br />
as envisioned by the law. Finally only 8% of Regional respondents had<br />
experienced unfair trade practices; 36% had no unfair experience, <strong>and</strong> majority<br />
(56%) had aggregate response of don’t know <strong>and</strong> no answer (Table 4.2.10).<br />
4.2 - 24
Table 4.2.8. Respondents Satisfaction with the Export Performance of<br />
<strong>Agricultural</strong> Products<br />
REGION Not Satisfied Satisfied Don’t Know No Answer Total %<br />
CAR 3 2 2 0 7 3.95<br />
CARAGA 8 2 6 16 9.04<br />
1 8 3 0 0 11 6.21<br />
2 4 2 6 4 16 9.04<br />
3 3 3 0 2 8 4.52<br />
4-A 5 2 0 3 10 5.65<br />
4-B 3 0 0 4 7 3.95<br />
5 6 6 0 3 15 8.47<br />
6 4 7 6 1 18 10.17<br />
7 3 3 0 0 6 3.39<br />
8 2 1 0 6 9 5.08<br />
9 2 2 0 0 4 2.26<br />
10 11 5 2 1 19 10.73<br />
11 0 8 1 0 9 5.08<br />
12 0 8 1 0 9 5.08<br />
ARMM 3 3 7 0 13 7.34<br />
Total 65 57 25 30 177 100.00<br />
% 36.72 32.20 14.12 16.95 100.00<br />
Table 4.2.9. Respondents Perceptions of <strong>Agricultural</strong> Exports Improvement<br />
under AFMA<br />
REGION Yes No Don’t Know No Answer Total %<br />
CAR 0 1 6 0 7 3.89<br />
CARAGA 0 5 9 2 16 8.89<br />
1 2 4 5 11 6.11<br />
2 0 2 10 4 16 8.89<br />
3 0 2 4 2 8 4.44<br />
4-A 0 5 2 3 10 5.56<br />
4-B 1 4 0 2 7 3.89<br />
5 0 8 3 4 15 8.33<br />
6 2 8 7 1 18 10.00<br />
7 0 2 3 1 6 3.33<br />
8 1 1 5 2 9 5.00<br />
9 2 0 3 2 7 3.89<br />
10 2 5 9 3 19 10.56<br />
11 1 3 4 1 9 5.00<br />
12 1 3 4 1 9 5.00<br />
ARMM 2 3 7 1 13 7.22<br />
Total 14 56 81 29 180 100.00<br />
% 7.78 31.11 45.00 16.11 100.00<br />
4.2 - 25
Table 4.2.10. Respondents' Experience of Unfair <strong>Trade</strong> Practices During<br />
the Implementation of AFMA<br />
REGION Yes No Don’t Know No Answer Total %<br />
CAR 1 2 4 0 7 3.89<br />
CARAGA 0 7 7 2 16 8.89<br />
1 1 7 3 0 11 6.11<br />
2 2 5 5 4 16 8.89<br />
3 1 2 4 1 8 4.44<br />
4-A 1 2 4 3 10 5.56<br />
4-B 0 3 3 1 7 3.89<br />
5 0 6 4 5 15 8.33<br />
6 0 8 5 5 18 10.00<br />
7 0 2 4 0 6 3.33<br />
8 0 3 3 3 9 5.00<br />
9 1 4 1 1 7 3.89<br />
10 0 5 6 8 19 10.56<br />
11 4 3 2 0 9 5.00<br />
12 4 3 2 0 9 5.00<br />
ARMM 0 3 5 5 13 7.22<br />
Total 15 65 62 38 180 100.00<br />
% 8.33 36.11 34.44 21.11 100.00<br />
4.2.49 On tariff exemptions in the importation of agricultural inputs under AFMA,<br />
only 4% of respondents affirmed their availment; 53 percent did not avail of tariff<br />
exemptions <strong>and</strong> the rest didn’t know / had no answer (Table 4.2.11). It is worth<br />
noting that only two of the 15 Regional respondents from Regions 3 <strong>and</strong> 4-B<br />
were able to avail tariff exemptions when 41 percent of all firms granted with<br />
agricultural input tariff came from these two Regions. Likewise, there were no<br />
respondents from Regions 6 to 12 where 37% of the tariff exemptions were<br />
issued from 1999 to 2005. Clearly, the trends indicated that tariff exemption in<br />
the importation of agricultural inputs has not been availed off by majority of small<br />
farmers / enterprises in the countryside.<br />
4.2 - 26
Table 4.2.11. Respondents by Availment of Tariff Exemptions Under AFMA<br />
REGION Yes No Don’t Know No Answer Total %<br />
CAR 2 5 0 0 7 3.89<br />
CARAGA 1 7 6 2 16 8.89<br />
1 1 7 2 1 11 6.11<br />
2 1 9 2 4 16 8.89<br />
3 1 5 2 0 8 4.44<br />
4-A 0 5 3 2 10 5.56<br />
4-B 1 3 2 1 7 3.89<br />
5 0 8 2 5 15 8.33<br />
6 0 10 4 4 18 10.00<br />
7 0 4 2 0 6 3.33<br />
8 0 4 2 3 9 5.00<br />
9 0 6 1 0 7 3.89<br />
10 0 8 4 7 19 10.56<br />
11 0 5 2 2 9 5.00<br />
12 0 5 2 2 9 5.00<br />
ARMM 0 4 5 4 13 7.22<br />
Total 7 95 41 37 180 100.00<br />
% 3.89 52.78 22.78 20.56 100.00<br />
4.2.50 Regarding Agriculture Competitiveness Enhancement Fund (ACEF), 42<br />
percent of Regional respondents were familiar with ACEF, 45% unfamiliar <strong>and</strong><br />
the remaining 13 percent had aggregate don’t know <strong>and</strong> no answer responses<br />
(Table 4.2.12). Majority (63%) of the 180 respondents’ general impressions of<br />
ACEF were “can be improved” <strong>and</strong> good (18%), while the remaining 1/5 of<br />
respondents had no answer (Table 4.2.13). Majority (61%) of respondents did<br />
not avail of ACEF loan while only 11% availed (Table 4.2.14). Finally, only 21<br />
percent were satisfied with the performance of ACEF; 38% unsatisfied <strong>and</strong> the<br />
remaining 41% did not know / had no answer (Table 4.2.15).<br />
4.2 - 27
Table 4.2.12. Respondents Familiarity with the Agriculture Competitiveness<br />
Enhancement Fund (ACEF)<br />
REGION Yes No Don’t Know No Answer Total %<br />
CAR 2 5 0 0 7 3.89<br />
CARAGA 3 11 2 0 16 8.89<br />
1 4 6 0 1 11 6.11<br />
2 6 7 0 3 16 8.89<br />
3 0 0 3 5 8 4.44<br />
4-A 5 4 1 0 10 5.56<br />
4-B 3 3 1 0 7 3.89<br />
5 11 4 0 0 15 8.33<br />
6 10 6 0 2 18 10.00<br />
7 2 3 0 1 6 3.33<br />
8 3 5 0 1 9 5.00<br />
9 4 2 0 1 7 3.89<br />
10 12 7 0 0 19 10.56<br />
11 5 4 0 0 9 5.00<br />
12 5 4 0 0 9 5.00<br />
ARMM 0 10 0 3 13 7.22<br />
Total 75 81 7 17 180 100.00<br />
% 41.67 45.00 3.89 9.44 100.00<br />
Table 4.2.13. Respondents General Impression of Agriculture<br />
Competitiveness Enhancement Fund (ACEF)<br />
Can be<br />
REGION improved Good No Answer Total %<br />
CAR 3 1 3 7 3.89<br />
CARAGA 7 9 0 16 8.89<br />
1 9 0 2 11 6.11<br />
2 7 9 0 16 8.89<br />
3 5 1 2 8 4.44<br />
4-A 8 0 2 10 5.56<br />
4-B 5 2 0 7 3.89<br />
5 13 2 0 15 8.33<br />
6 15 0 3 18 10.00<br />
7 2 0 4 6 3.33<br />
8 4 0 5 9 5.00<br />
9 4 3 0 7 3.89<br />
10 12 1 6 19 10.56<br />
11 7 0 2 9 5.00<br />
12 7 2 0 9 5.00<br />
ARMM 5 2 6 13 7.22<br />
Total 113 32 35 180 100.00<br />
% 62.78 17.78 19.44 100.00<br />
4.2 - 28
Table 4.2.14. Respondents by Availment of Agriculture Competitiveness<br />
Enhancement Fund (ACEF) Loan<br />
REGION Yes No Don’t Know No Answer Total %<br />
CAR 2 5 0 0 7 3.89<br />
CARAGA 0 8 2 6 16 8.89<br />
1 1 8 1 1 11 6.11<br />
2 2 7 7 0 16 8.89<br />
3 3 0 1 4 8 4.44<br />
4-A 1 7 0 2 10 5.56<br />
4-B 2 5 0 0 7 3.89<br />
5 0 13 2 0 15 8.33<br />
6 0 15 0 3 18 10.00<br />
7 0 4 1 1 6 3.33<br />
8 0 7 1 1 9 5.00<br />
9 4 0 0 3 7 3.89<br />
10 1 16 0 2 19 10.56<br />
11 3 1 2 3 9 5.00<br />
12 0 7 2 0 9 5.00<br />
ARMM 0 6 3 4 13 7.22<br />
Total 19 109 22 30 180 100.00<br />
% 10.56 60.56 12.22 16.67 100.00<br />
Table 4.12.15. Respondents Satisfaction with Performance of Agriculture<br />
Competitiveness Enhancement Fund (ACEF)<br />
REGION Not Satisfied Satisfied Don’t Know No Answer Total %<br />
CAR 2 1 2 2 7 3.98<br />
CARAGA 6 1 0 9 16 9.09<br />
1 1 3 5 2 11 6.25<br />
2 5 3 2 6 16 9.09<br />
3 3 5 0 0 8 4.55<br />
4-A 4 1 3 2 10 5.68<br />
4-B 1 2 3 1 7 3.98<br />
5 7 5 0 3 15 8.52<br />
6 11 3 0 0 14 7.95<br />
7 1 2 0 3 6 3.41<br />
8 2 1 0 6 9 5.11<br />
9 4 0 0 3 7 3.98<br />
10 12 3 1 3 19 10.80<br />
11 5 4 0 0 9 5.11<br />
12 2 1 6 0 9 5.11<br />
ARMM 0 2 5 6 13 7.39<br />
Total 66 37 27 46 176 100.00<br />
% 37.50 21.02 15.34 26.14 100.00<br />
4.2 - 29
4.2.51 The above results from respondents’ perceptions on ACEF, are reflective<br />
of the general state of affairs of the ACEF credit facility. The fact that around PhP<br />
2.7 billion are still unallocated, implies that the system of ACEF project loan<br />
processing is flawed <strong>and</strong> has not really supported the agricultural modernization<br />
efforts in the countryside.<br />
Impact of AFMA <strong>Trade</strong> Component on Agriculture <strong>and</strong> Fisheries<br />
4.2.52 The Regional consultations / workshops across the 16 Regions took two<br />
days each. The workshops were focused on the general impact of AFMA<br />
components (irrigation, postharvest, other infrastructures, credit, trade,<br />
marketing, information, support, st<strong>and</strong>ardization <strong>and</strong> consumer safety, education,<br />
research <strong>and</strong> development, <strong>and</strong> extension) taken as whole on at least five (5)<br />
commodity groupings (rice, corn, (grains), high value commercial crops, livestock<br />
<strong>and</strong> poultry, <strong>and</strong> fisheries). The AFMA impact assessment at the Regional level<br />
covered discussions on general <strong>and</strong> qualitative impact, budget adequacy <strong>and</strong><br />
prioritization, assessment of level of implementation, priority issues <strong>and</strong><br />
concerns, priority focus of interventions, <strong>and</strong> proposals for improvement. The<br />
succeeding discussions highlight the general assessment of the impact of trade<br />
as a component of AFMA, on the five commodity groupings.<br />
a. <strong>Trade</strong> <strong>and</strong> the Rice Subsector<br />
4.2.53 The general impact of trade as a component of AFMA, reasons for impact,<br />
<strong>and</strong> qualitative level of implementation, <strong>and</strong> proposals for improvement of trade<br />
in the rice subsector are summarized in Table 4.2.16. Of the ten (10) Regions<br />
that discussed the general impact of trade as a component of AFMA on the rice<br />
subsector four (4) Regions (40%) indicated that trade component (including fiscal<br />
incentives in terms of tariff free inputs of agricultural inputs) had no impact on the<br />
rice subsector. The remaining 6 (60%) of the ten (10) Regions affirmed that trade<br />
had low (1 to 3, on a scale of 10, 8 to 10 being high) impact on rice agribusiness<br />
systems.<br />
4.2.54 The major reasons cited for the no impact of trade on rice include: rice is<br />
not competitive, high costs of fertilizer, rice smuggling (Region 2), no specific<br />
program to address trade (Region 8), weak program (Region 10), untimely<br />
importations <strong>and</strong> high costs of inputs (Region 11). On the other h<strong>and</strong>, the major<br />
reasons cited for low impact of trade on the rice subsector were: rice importation<br />
<strong>and</strong> its untimeliness have negative effect on rice production (Regions 4-B, 4-A,<br />
11, <strong>and</strong> 12); high costs of inputs <strong>and</strong> limited availment of imported fertilizer<br />
(Regions 9, 11, 12, <strong>and</strong> CARAGA); lack of information <strong>and</strong> awareness (Region<br />
3); <strong>and</strong> guidelines of the rice program not properly implemented (CARAGA).<br />
4.2 - 30
Table 4.2.16. Impact of AFMA <strong>Trade</strong> Component on the Rice Subsector, by Selected Regions<br />
IMPACT IMPLEMENTATION<br />
SELECTED General<br />
REGION Impact Reasons Level Reasons<br />
2 None Rice not competitive; high costs of Poor Inconsistent gov’t policies at the<br />
fertilizer, smuggling importations<br />
of rice<br />
program level<br />
3 Low Lack of information <strong>and</strong> awareness,<br />
not competitive<br />
4-A Low Farmers as importers program<br />
benefited traders; gov’t importation is<br />
not farmer friendly<br />
4-B Low Importation has negative impact to a<br />
rice surplus region like MIMAROPA;<br />
rice is a political commodity; imports<br />
should be done only during lean<br />
months<br />
Poor Rice remains uncompetitive, presence<br />
of red tape<br />
PROPOSED IMPROVEMENT<br />
Revisit AFMA <strong>and</strong> other policies<br />
Prepare the farmers <strong>and</strong> the product to be<br />
competitive<br />
Policy reforms, self-sufficiency hinders importation<br />
Improve product quality to be competitive<br />
Poor __ Gov’t subsidy for export should be provided for<br />
farm infrastructure <strong>and</strong> support<br />
Poor Policy on importation prematurely<br />
announced, bad for the region<br />
8 None No specific program to address trade Poor Smuggling / importations affect prices<br />
of produce; high costs of farmer inputs<br />
9 Low Limited availment of imported fertilizer<br />
through NFA<br />
Scrap farmer as importer program<br />
Negate the effects of WTO<br />
Timely importation during lean months only<br />
Consolidation of farmers resources to import rice<br />
through NFA, not individually<br />
Abolish NFA (suggested by some stakeholders)<br />
Gradual abolition of importation through legislation<br />
Poor Selected beneficiaries only Prioritize <strong>and</strong> identify farmer receipts of duty free<br />
importation of inputs<br />
Utilize local organic / indigenous fertilizer<br />
Request exclusion of Region 9 in import rice<br />
distribution<br />
4.2 - 31
IMPACT IMPLEMENTATION<br />
SELECTED General<br />
REGION Impact Reasons Level Reasons<br />
10 None Weak program Poor High costs of inputs / timeliness of rice<br />
importation<br />
11 (Grains) None Untimely importations, high costs of<br />
inputs<br />
12 (Grains) Low Input prices remain high; dumping of<br />
imported rice reduces prices; untimely<br />
entry of imported rice<br />
CARAGA Low Guidelines on programs not properly<br />
implemented; high input costs;<br />
smuggling not controlled; not<br />
sustainable production<br />
Source: AFMA Regional Consultations<br />
Poor Laws unfriendly to farmers; too<br />
focused on consumers than producers;<br />
failure in establishing price system<br />
PROPOSED IMPROVEMENT<br />
Organize farmers for bulk importation<br />
Conduct R&D in producing inorganic fertilizer<br />
Imports should not come during harvest time<br />
Promote sustainable system in irrigated rice<br />
Farmer orgs should do importation<br />
Adopt mitigating reasons to reduce impact of<br />
globalization<br />
<strong>National</strong>ize products<br />
Strict monitoring of warehouses owned by cartels<br />
Review policies on tariff rates<br />
Create rice <strong>and</strong> corn board<br />
Strengthen price stabilization council<br />
Poor Lack of consultations with stakeholders PAFC should be part in recommending<br />
importations<br />
Poor Ineffective program implementation<br />
Advocacy for inorganic fertilizer<br />
Implement “abono Filipino” in the region<br />
Increase rice production through new technologies,<br />
increase area, increase productivity<br />
Proper implementation of trade policies<br />
4.2 - 32
4.2.55 In terms of level of program implementation, all the 10 Regions (100%)<br />
rated it poor (score of 1 to 3) with 10 as the highest possible score. The major<br />
reasons cited varied from inconsistencies of government policies (e.g. rice<br />
imports’ timeliness <strong>and</strong> bias to consumers) affecting the program level;<br />
government red tapes <strong>and</strong> ineffective program implementation; selective<br />
beneficiaries of the program; <strong>and</strong> lack of consultations with stakeholders.<br />
4.2.56 The Regional consultations also made several proposed improvements on<br />
how to make the trade component of AFMA be more effective. These are<br />
generally categorized into four: rice trade policies (export-imports, tariff <strong>and</strong><br />
competitiveness), efficiency <strong>and</strong> competitiveness in rice production through the<br />
adoption of technologies <strong>and</strong> other measures, stakeholders’ participation, <strong>and</strong><br />
institutional reforms (Table 4.2.16).<br />
b. <strong>Trade</strong> <strong>and</strong> the Corn Subsector<br />
4.2.57 Seven Regions provided inputs in the analysis of trade impact on the corn<br />
subsector. These are Regions 1, 2, 3, 4-A, 4-B, 5, <strong>and</strong> 7. Regional participants<br />
indicated a range of none (no score), to high (score of 8 to 10) on the general<br />
impact of trade on the corn subsector. Regions 2 <strong>and</strong> 7 affirmed no impact of<br />
AFMA trade component on corn; had poor (score of 1 to 3) level of<br />
implementation due to government corn importation, corn smuggling <strong>and</strong><br />
minimum government intervention. On the other h<strong>and</strong>, four Regions (1, 4-A, 4-B,<br />
5) indicated low impact of AFMA trade component <strong>and</strong> poor level of program<br />
implementation due to common reasons of: importation during peak harvest;<br />
mostly for domestic use <strong>and</strong> no surplus for export; <strong>and</strong> minimum government<br />
assistance (interventions) to corn farmers.<br />
4.2.58 There was one Region (Region 3) however, whose participants affirmed<br />
the high (score of 8 to 10) impact <strong>and</strong> good (score of 8 to 10) level of program<br />
implementation of AFMA trade component on the corn sector. The reasons cited<br />
for high impact were: the Region is strategically located in a high dem<strong>and</strong> area<br />
where market prices received by farmers are high. Likewise, the private sector<br />
participation was cited as a major reason for good program implementation.<br />
4.2.59 Finally, the proposed measures for improvement suggested by the<br />
Regional participants include: strong political will to stop untimely imports <strong>and</strong><br />
smuggling; monetization of fertilizer donated by foreign countries; closer<br />
monitoring of prices; subsidy on fertilizer <strong>and</strong> advocacy on the use of BIO-N<br />
fertilizer; <strong>and</strong> intensification of e-trade project of DA (Table 4.2.17).<br />
4.2 - 33
Table 4.2.17. Impact of AFMA <strong>Trade</strong> Component on the Corn Subsector, by Selected Regions<br />
IMPACT IMPLEMENTATION<br />
SELECTED General<br />
PROPOSED IMPROVEMENT<br />
REGION Impact Reasons Level Reasons<br />
1 Low Importations during peak harvest Poor No assistance is provided on Fertilizer donated by other countries should be<br />
reduce price<br />
prevailing price of corn which<br />
should help farmers sell their<br />
produce<br />
monetized <strong>and</strong> sold to farmers at lower prices<br />
Closer monitoring of corn prices<br />
Subsidize fertilizer or through self-loan;<br />
promote use of BIO-N<br />
Stop corn imports during peak harvest season<br />
2 None Gov’t allows unnecessary corn Poor No intervention, corn smuggling in Strong political will<br />
importation<br />
North Cotabato<br />
Corn importation allowed during<br />
peak harvest<br />
LGU / <strong>National</strong> gov’t should stop smuggling<br />
Imports should only be allowed only during<br />
lean months<br />
3 High Region III strategically located in Good Presence of private sector Intensify e-trade project of DA through 7 e-<br />
high dem<strong>and</strong> centers<br />
trading consultations amounting to P350,000<br />
High market prices Existence of e-trade for corn<br />
4-A Low No surplus for export, more for<br />
domestic market<br />
Poor No surplus for export __<br />
4-B Low Quality of corn produced doesn’t<br />
meet GATT-WTO st<strong>and</strong>ards<br />
Poor No intervention reported __<br />
5 Low No international export Poor No intervention done __<br />
7 None Production only for domestic<br />
market<br />
Poor No known intervention __<br />
Source: AFMA Regional Consultations<br />
4.2 - 34
c. <strong>Trade</strong> <strong>and</strong> the High Value Commercial Crops (HVCC) Subsector<br />
4.2.60 Participants from 12 out of 16 Regions indicated their assessment of the<br />
impact of AFMA trade component on the HVCC subsector (Table 4.2.18).<br />
Participants from Regions 1, 8, 10, <strong>and</strong> CARAGA were very direct in expressing<br />
their “no impact” assessment of trade on the HVCC subsector. The major<br />
reasons were not fully aware of the program due to poor information<br />
dissemination <strong>and</strong> HVCC products are not yet in commercial production <strong>and</strong><br />
therefore not exported.<br />
4.2.61 Participants from Regions 2, 4-B, 5, 11, <strong>and</strong> ARMM thought that the<br />
impact of trade on HVCC stakeholders was “low” due to inadequate information<br />
<strong>and</strong> awareness on trade; failure to meet quality requirements for export crops<br />
(e.g. mango <strong>and</strong> calamansi); no improvement in market sales; <strong>and</strong> most farmers<br />
are not commercial producers. Three Regions (3, 4-A, 4-B for abaca / coconut on<br />
the other h<strong>and</strong>, expressed that the impact on trade on HVCC in their area was<br />
“moderate” (score of 4 to 7). This “moderate” assessment was made due to<br />
private sector participation, <strong>and</strong> despite stringent quality requirements of<br />
importing countries, <strong>and</strong> lack of support mechanisms to take advantage of export<br />
opportunities.<br />
4.2.62 In terms of program implementation, Regions that generally signified<br />
“none / low“ impact of trade also indicated poor (score of 1 to 4) level of<br />
implementation. Lack of information dissemination, inadequate budget,<br />
unorganized stakeholders, not felt in the Region specially by small farmers, <strong>and</strong><br />
questionable selection of participants in trade fairs were the major reasons given<br />
for low levels of implementation. For the Regional workshop participants who<br />
indicated fair level of program implementation, adequate fund support <strong>and</strong> many<br />
development activities introduced by DOST, DTI / DOT through trade fairs <strong>and</strong><br />
trainings, were the reasons cited.<br />
4.2.63 Several positive measures to improve the impact of trade on HVCC were<br />
proposed by the stakeholders. These were: intensify information campaign<br />
through trimedia; control smuggling; production of competitive products in volume<br />
<strong>and</strong> quality; setting up of quality st<strong>and</strong>ards through basic support services (e.g.<br />
quarantine <strong>and</strong> certification services, training on HACP) from government;<br />
development of data bases (prices, markets, dem<strong>and</strong>); <strong>and</strong> direct marketing<br />
assistance to cooperative in the case of abaca (Table 4.2.18).<br />
4.2 - 35
Table 4.2.18. Impact of AFMA <strong>Trade</strong> Component on the High Value Commercial Crops (HVCC) Subsector, by<br />
Selected Regions<br />
IMPACT IMPLEMENTATION<br />
SELECTED General<br />
PROPOSED IMPROVEMENT<br />
REGION Impact Reasons Level Reasons<br />
1 None Not Fully Aware of program; Poor Poor Lack of information from gov’t Intensify info campaign through trimedia<br />
information dissemination<br />
implementors<br />
No budget for info campaign Concerned agencies should assist farmers<br />
No product st<strong>and</strong>ardization Production of competitive products in volume <strong>and</strong><br />
quality<br />
2 Low Failure to meet quality requirements Poor Limited support in technology, etc; Control smuggling<br />
for export mango / calamansi<br />
importation <strong>and</strong> smuggling<br />
Strict implementation of quarantine<br />
laws of importing countries<br />
Forge market linkages<br />
Strengthen safety nets for affected sectors<br />
3 Moderate Quality requirements stringent in<br />
importing / exporting countries<br />
Fair Supported by adequate funds Establish good R&D facilities to check st<strong>and</strong>ards<br />
Implement IPM to improve quality<br />
4-A Moderate Lack of support mechanism to take Fair Absence of certifying bodies in organic Provide support mechanisms (certification<br />
advantage of export opportunities,<br />
products; (e.g. quarantine <strong>and</strong> services, quarantine) to enhance competitiveness<br />
low awareness of program<br />
certification services)<br />
4-B HVCC Low awareness on support activities Poor Limited funding, unorganized Conduct training, Re: HACCP, POT <strong>and</strong> quality<br />
(Low) for export<br />
stakeholders<br />
requirements<br />
Abaca /<br />
Coconut<br />
(Moderate)<br />
Private sector takes care of export<br />
production of abaca fibers, VCO,<br />
coconut oil, <strong>and</strong> other by- products<br />
5 Low No change in sales before <strong>and</strong> after<br />
AFMA, limited funding<br />
Lack of marketing data on exports Develop data bases on prices, markets, dem<strong>and</strong>,<br />
etc.<br />
Fair Not all producers adopt VCO st<strong>and</strong>ards Massive info dissemination for VCO st<strong>and</strong>ards;<br />
exp<strong>and</strong> domestic <strong>and</strong> international market<br />
Quota set by buyer exports on value of<br />
VCO<br />
Pricing system disadvantageous to<br />
farmers at the farm level for abaca<br />
Fair Many activities are undertaken by<br />
DOST / DTI / DOT through trade fairs<br />
<strong>and</strong> skills training<br />
Direct market assistance <strong>and</strong> cooperative<br />
marketing for abaca farmers<br />
BAFPS should formulate st<strong>and</strong>ards<br />
4.2 - 36
SELECTED<br />
REGION<br />
IMPACT I MPLEMENTATION<br />
General<br />
Impact Reasons Level Reasons<br />
8 None Not yet commercialized Poor No intervention known<br />
10 None Most HVCC products are not<br />
exported<br />
11 Low Micro-enterprises not aware of trade<br />
policies / opportunities<br />
Poor Not felt in the locality; very few are<br />
exporting<br />
Poor Small farmers are not able to avail of<br />
Program; lack of info dissemination<br />
PROPOSED IMPROVEMENT<br />
Provision for production services to increase area<br />
Info dissemination of st<strong>and</strong>ards to farmers<br />
Re focus agrarian reform from l<strong>and</strong> acquisition to<br />
support services<br />
Provision of centralized data system; market<br />
information<br />
Common service facility for mango for export<br />
Make Tagaloan International Container Port<br />
operational<br />
Fast track construction of international airport<br />
Establishing trading posts in all provinces to<br />
address export concerns<br />
Strengthen one-stop shop processing of<br />
documents for trade (DTI)<br />
Massive info drive<br />
Extend scope / range of clientele<br />
Exp<strong>and</strong> coverage of PITL, consultations<br />
Enhance crop’s capability<br />
12 Low No information about trade Poor Not aware of trade components Info dissemination<br />
Provisions of necessary trade info to regional<br />
CARAGA None No info on trade component of<br />
AFMA<br />
ARMM Low Most farmers are not commercial<br />
producers<br />
Poor Lack of info dissemination<br />
levels for dissemination to HVCC farmers<br />
Unified trading system<br />
Questionable selection of participants<br />
in trade fairs<br />
Weak organization of HVCC farmers<br />
within region <strong>and</strong> disintegrated<br />
program on trade<br />
Poor No information about trade, lack of<br />
awareness about trade component of<br />
AFMA<br />
Allocation of funds for organizational linkages<br />
Conduct information dissemination on trade<br />
4.2 - 37
d. <strong>Trade</strong> <strong>and</strong> the Livestock <strong>and</strong> Poultry Subsector<br />
4.2.64 The workshop discussions on the impact of AFMA in general, <strong>and</strong> trade in<br />
particular, on the livestock <strong>and</strong> poultry subsector were conducted in 14 out of the<br />
16 Regions (Table 4.2.19). Workshop participants from 7 Regions (1, 2, 4-B, 6, 7,<br />
8 (none), 10, 12, <strong>and</strong> ARMM) who rated “low” impact of trade on the livestock<br />
<strong>and</strong> poultry subsector, also indicated corresponding “poor” levels of program<br />
implementation. The major reasons for the low impact of trade were: high<br />
logistics costs <strong>and</strong> high costs of biologics, smuggling <strong>and</strong> dumping; low tariffs of<br />
imported meat products; lack of information, facilities (e.g. storage, halal<br />
certifying services) <strong>and</strong> infrastructure (port); <strong>and</strong> no export because of FMD.<br />
These reasons mentioned above were generally the same reasons for poor<br />
program implementation. On the other h<strong>and</strong>, participants from three Regions (3,<br />
5, CARAGA) indicated “moderate” impact <strong>and</strong> “fair” to “good” levels of program<br />
implementation, while workshop participants’ from Regions 4-A <strong>and</strong> 9 were<br />
exceptional in assessing as “high,” the impact of trade on livestock <strong>and</strong> poultry<br />
<strong>and</strong> “fair to good” levels of program implementation. For “high” impact <strong>and</strong> “fair”<br />
to “good” level implementing Regions, the major reasons cited was availment of<br />
tax free importations of equipments <strong>and</strong> inputs under Section 109 of AFMA.<br />
(Table 4.2.19)<br />
4.2.65 The proposed improvements to enhance the impact of AFMA trade<br />
component on the livestock <strong>and</strong> poultry subsector were related to trade (imports,<br />
tariffs of outputs <strong>and</strong> inputs); enforcement of existing laws affecting the livestock<br />
subsector (anti-smuggling, quarantine laws); efficiency measures to enhance<br />
global competitiveness of meat products (efficiency in corn / feed production;<br />
incentives for investors / exporters; upgrading for quality st<strong>and</strong>ards in the meat<br />
agribusiness supply chain, improvement of breeding stocks, animal health<br />
measures, <strong>and</strong> postharvest <strong>and</strong> storage facilities); strengthen information<br />
dissemination, <strong>and</strong> strict monitoring of developments in production <strong>and</strong> trade of<br />
meat <strong>and</strong> livestock products (Table 4.2.19).<br />
e. <strong>Trade</strong> <strong>and</strong> the Fisheries Subsector<br />
4.2.66 Fourteen (14) out of 16 Regions covered by the Regional<br />
consultation/workshops evaluated the general impact of trade <strong>and</strong> the level of<br />
program implementation on the fisheries subsector (Table 4.2.20). Workshop<br />
participants of Regions 5, 6, 11, <strong>and</strong> CARAGA (“no” impact) evaluated the<br />
general impact of AFMA trade component as “low” with “poor” level of<br />
implementation. The major reasons cited for this assessment were: fisheries<br />
trade was controlled by traders; lack of capital for small fishermen; local market<br />
not favorable in high density production <strong>and</strong> stakeholders have no access to<br />
facilities. Participants from seven Regions (1,2, 3, 4-B, 7, 10, 12) on the other<br />
h<strong>and</strong>, rated the general impact of trade as “moderate” (score of 5 to 7) with<br />
“poor” to “good” program implementation.<br />
4.2 - 38
Table 4.2.19. Impact of AFMA <strong>Trade</strong> Component on the Livestock <strong>and</strong> Poultry Subsector, by Selected Regions<br />
IMPACT IMPLEMENTATION<br />
SELECTED General<br />
PROPOSED IMPROVEMENT<br />
REGION Impact Reasons Level Reasons<br />
1 Low High logistics costs Poor Smuggling of meat Stricter implementation of policies on meat imports<br />
<strong>National</strong> level implemented but not<br />
regionally<br />
Strengthen coops to address competitiveness<br />
Bias in implementation <strong>and</strong> corruption<br />
in gov’t<br />
Reduce tariffs of feed ingredients <strong>and</strong> other inputs<br />
Conflict of interests of gov’t<br />
Improve efficiency of corn production for<br />
implementers<br />
competitiveness<br />
2 Low Low tariff of livestock / poultry Poor High cost of vet medicines Review tariff rates of imported meats affecting the<br />
products<br />
industry<br />
High costs of imported vet medicines<br />
<strong>and</strong> equipment<br />
Smuggling Lower tariff for imported medicines / equipment<br />
Smuggling Strict enforcement of anti-smuggling law<br />
Pass quarantine law for imported meat <strong>and</strong> meat<br />
products<br />
3 Moderate Has saved on cost <strong>and</strong> encouraged Fair Some importers availed of tax Strengthen info dissemination<br />
investments<br />
exemptions for business purposes<br />
Increase incentives for investors<br />
Upgrade product quality <strong>and</strong> come out with<br />
st<strong>and</strong>ards<br />
Enforce anti-smuggling law<br />
4-A High Low price <strong>and</strong> better quality of Good (same reasons as in impact) Review list of equipment under Appendix B of IRR<br />
imported equipment<br />
under EO 376<br />
Accessibility of raw materials Develop / support local fabricators<br />
Tax free importations<br />
Job generation<br />
Strict implementation of importation policies in<br />
coordination with BOC<br />
4.2 - 39
IMPACT IMPLEMENTATION<br />
SELECTED General<br />
PROPOSED IMPROVEMENT<br />
REGION Impact Reasons Level Reasons<br />
4-B Low High cost of production Poor (Same reasons as in impact) Upgrade local stocks <strong>and</strong> establish post harvest<br />
facilities<br />
<strong>Trade</strong> liberalization Conduct consultations on trade liberalization <strong>and</strong><br />
related matters<br />
Non-compliance to importation<br />
policies<br />
Strict implementation of importation policies<br />
Smuggling Impose sanctions on smugglers<br />
5 Moderate Able to compete with international Fair Prices of imported goods are lower Upgrade breeder stocks<br />
market<br />
than local; high production cost <strong>and</strong><br />
insufficient supply of raw materials<br />
Strict implementation of quarantine laws<br />
Implement interventions to reduce production<br />
costs<br />
Strict adherence to MAV<br />
6 Low Smuggling Poor Same reasons under impact Strengthen political will, strict enforcement of laws<br />
Dumping of meat products Intensify info campaign<br />
Lack of info Establish world class facilities<br />
Lack of facilities Compliance with international st<strong>and</strong>ards<br />
Need for international ports Provide adequate storage facilities<br />
Need to comply with international<br />
st<strong>and</strong>ards<br />
High production / h<strong>and</strong>ling / shipping<br />
costs<br />
Limited storage facilities<br />
Impose sanctions on smugglers<br />
7 Low Globally uncompetitive Poor Same reasons under impact Provide export guidelines on export of new meat<br />
products<br />
No guidelines to be able to export<br />
new products<br />
Strengthen info dissemination on livestock trade<br />
Rampant smuggling<br />
Low tariff rates<br />
Unstable currency<br />
No budget to import genetically<br />
improved livestock<br />
Punish smugglers<br />
4.2 - 40
IMPACT IMPLEMENTATION<br />
SELECTED General<br />
PROPOSED IMPROVEMENT<br />
REGION Impact Reasons<br />
Weak info dissemination<br />
Level Reasons<br />
8 None Small program in the region Poor No intervention felt Strict monitoring of importation of meat <strong>and</strong> meat<br />
products<br />
9 High Was granted tariff exemption under<br />
Section 9 of AFMA to 2015<br />
10 Low GATT-WTO more importations; high<br />
production cost<br />
Impose price ceiling on livestock<br />
Fair High political intervention Intensify info dissemination; Limit political<br />
intervention; lobby to support GMA Program on<br />
Poor Importations discourage poultry raisers<br />
to exp<strong>and</strong> production<br />
Goal 7; accelerating agribusiness development<br />
Allow importation of cattle as fatteners<br />
Impose regular tariffs on poultry;<br />
Increase local production with soft credits <strong>and</strong><br />
breeding program<br />
Lower tariffs for imported feed ingredients<br />
Ban imports of meat <strong>and</strong> meat products in disease<br />
stricken countries<br />
12 Low No export because of FMD Poor No organized / federated raisers for Strengthen policy interventions <strong>and</strong> regulatory<br />
Small farmers need gov’t assistance<br />
to be able to import livestock<br />
Gov’t allows importation of meat from<br />
FMD countries (carabeef from India)<br />
small <strong>and</strong> large ruminants<br />
services<br />
CARAGA Moderate __ Fair __ Provide tax holidays to breeders <strong>and</strong> exporters<br />
Explore overseas market for our bird-flu free<br />
production<br />
ARMM Low Smuggling Poor REZA law not yet implemented Creation of halal certifying body<br />
Low production Implementation of GRP-MNLF peace accord<br />
No halal certifying body in the region Enforce quarantine <strong>and</strong> anti-smuggling laws<br />
4.2 - 41
Table 4.2.20. Impact of AFMA <strong>Trade</strong> Component on Fisheries Subsector, by Selected Regions<br />
IMPACT IMPLEMENTATION<br />
SELECTED General<br />
PROPOSED IMPROVEMENT<br />
REGION Impact Reasons Level Reasons<br />
1 Moderate Only small scale fishing, investors Good For seaweeds, sea urchins, <strong>and</strong> fish Promotion of investments in other sites<br />
were discouraged<br />
processing<br />
Unstable business decisions<br />
More conducive to invest in<br />
Pangasinan<br />
Plenty of investors, <strong>and</strong> good market<br />
dem<strong>and</strong> from Manila<br />
2 Moderate Not enough production to meet local Fair Positive coverage of fishing area; good Observe fair trade laws<br />
dem<strong>and</strong><br />
domestic trade with regions 1, 3, <strong>and</strong><br />
CAR<br />
Poor distribution system <strong>and</strong> multilayered<br />
marketing channels<br />
Supported by private sector Enhance measures to stabilize prices<br />
Good exports of goby marine fish in<br />
Taiwan, Japan, Korea, Hong Kong<br />
Good distribution of freshwater <strong>and</strong><br />
marine fishes in the region<br />
Encourage more private sector participation<br />
3 Moderate Quality requirements (HACCP) are<br />
met satisfactorily<br />
Good Meet EU st<strong>and</strong>ard requirements Maintain quality st<strong>and</strong>ards<br />
Enhance support services to exp<strong>and</strong> production<br />
<strong>and</strong> market<br />
4-B Moderate Domestic trading is active; export Poor Local interests (LGUs) hamper Adherence to national trade laws should be<br />
trading is indirect through existing<br />
interpretation of laws on domestic <strong>and</strong> instituted<br />
exporters<br />
international trade<br />
Access to capital for effective trading should be<br />
made available<br />
Appropriate trainings for entrepreneurs should be<br />
done<br />
CHED should design multi-level training for<br />
entrepreneurs<br />
4.2 - 42
IMPACT IMPLEMENTATION<br />
SELECTED General<br />
PROPOSED IMPROVEMENT<br />
REGION Impact Reasons Level Reasons<br />
5 Low Fisheries trade controlled by traders, Poor Lack of capital for small<br />
Strict implementation of product st<strong>and</strong>ards<br />
surplus in Tilapia locally<br />
fisherfolks/traders<br />
Limited partnership with DA Organize small fisherfolk for direct trading<br />
Conduct trainings on values formation<br />
6 Low Mostly private sector initiative; direct Poor Lack of market intelligence (dem<strong>and</strong>, Target global market<br />
importation by foreign buyers (firm to<br />
firm transactions)<br />
supply, price st<strong>and</strong>ards, markets)<br />
Improve access to market information<br />
7 Moderate Private sector led; foreign investors Good Good but not AFMA funded; joint gov’t- Establish one stop shop for exporters (DTI, DAprivate<br />
sector initiative<br />
BFAR, Customs, DOH<br />
Support establishment of trade center in Cebu City<br />
as proposed by DTI<br />
Establish separate fisheries court<br />
Upgrade <strong>and</strong> exp<strong>and</strong> processing facilities for<br />
seaweeds<br />
Establish fund sourcing from local <strong>and</strong> foreign<br />
sources<br />
Improved productivity of seaweed farmers <strong>and</strong><br />
explore alternative products<br />
Support seaweed industry<br />
8 High Was able to access feeds free from Poor Plenty of seminars related to trade not Training to be done by BFAR<br />
tariff/duties in Tacloban, Leyte<br />
known<br />
Fingerling supply adequate Trading linkage still to be set up Provide tax haven for pioneering activities<br />
especially in the fisheries subsector<br />
Needs assistance for trade Needs support services<br />
10 Moderate Region has existing trade products<br />
in prawns <strong>and</strong> seaweeds<br />
Fair Basically initiated by private sector Improve extension services<br />
Enhanced transport cost because of<br />
the RORO transport system<br />
Provide adequate facilities<br />
4.2 - 43
IMPACT IMPLEMENTATION<br />
SELECTED General<br />
PROPOSED IMPROVEMENT<br />
REGION Impact Reasons Level Reasons<br />
11 Low Local market not favorable in high Fair Needs info dissemination on trade; Simplify requirements (One-stop shop)<br />
density production<br />
gov’t should extend trade promotion<br />
only<br />
Export market not developed for<br />
small fishermen, only big companies<br />
High input costs<br />
Tuna products are h<strong>and</strong>led only by<br />
the private sector<br />
LGUs <strong>and</strong> NGOs collaborate for trade info<br />
12 Moderate Construction of roads increased Poor Capitalists are the ones benefiting from Transparency of safety nets <strong>and</strong> measures<br />
trade<br />
trade, while small fisherfolks are left<br />
behind<br />
implemented by LGUs<br />
Investors coming in<br />
Unscrupulous use of chemicals not<br />
good for the subsector<br />
Increased presence of traders<br />
increased prices of fish<br />
Gov’t favoring support to GOCCs<br />
CARAGA None Not felt locally Poor Stakeholders have no access to<br />
facilities<br />
Provide access of the program to small fisherfolks<br />
CAR High Monopoly of businessmen on prices<br />
of feeds/fish<br />
Poor Dependent on location of aquaculture Schedule harvests<br />
Problem with marketing assistance;<br />
Provide accessible credit to producers to avoid<br />
high production costs in fish culture<br />
harassment of traders<br />
ARMM High ARMM produces 80% of seaweeds<br />
plus fishes<br />
Poor Chinese controlling seaweeds trade Set up seaweed semi-processing plants<br />
Private sector initiative Many fly by night traders from Malaysia Federate / organize all seaweed producers<br />
Gov’t not serious to help seaweeds<br />
industry<br />
DA should assist in marketing<br />
4.2 - 44
4.2.67 The major reasons for this “moderate” impact were due mainly to high<br />
private sector participation, high international <strong>and</strong> domestic market dem<strong>and</strong>s,<br />
<strong>and</strong> adequate infrastructures reducing production <strong>and</strong> logistics costs. Some of<br />
the exportable fishery products with high dem<strong>and</strong> were seaweeds <strong>and</strong> sea<br />
urchins (Region 1 <strong>and</strong> ARMM); seaweeds <strong>and</strong> prawns (Region 10); tilapia<br />
(Region 3) <strong>and</strong> goby marine fish (Region 2). Similar reasons mentioned above<br />
were given by participants from Regions 8, CAR, <strong>and</strong> ARMM, why they evaluated<br />
the general impact of trade in fisheries as “high.”<br />
4.2.68 To enhance the efficiency <strong>and</strong> competitiveness of the fisheries subsector,<br />
especially, relative to trade, the participants proposed the following<br />
improvements: more private sector participation, appropriate trainings for<br />
entrepreneurs for quality st<strong>and</strong>ards by CHED <strong>and</strong> BFAR; enhancement of<br />
support services <strong>and</strong> capital to exp<strong>and</strong> production <strong>and</strong> markets; organization of<br />
small fisherfolk for direct trading <strong>and</strong> better access to the program, establish<br />
more access to market information <strong>and</strong> one stop shops for exporters; provide tax<br />
incentives <strong>and</strong> establish fund sourcing from local <strong>and</strong> foreign sources; set up<br />
processing <strong>and</strong> storage for seaweeds <strong>and</strong> fishery products; <strong>and</strong> other measures<br />
related to production, processing, marketing, <strong>and</strong> storage efficiency of fishery<br />
products (Table 4.2.20).<br />
Conclusions<br />
4.2.69 The analysis of the trade <strong>and</strong> fiscal incentives component of AFMA<br />
indicated the following:<br />
a. The trends in the export <strong>and</strong> import of agricultural outputs <strong>and</strong> inputs<br />
showed that the Philippines had consistently become a net importer<br />
during AFMA implementation period;<br />
b. There were no major changes in the market destinations of Philippines’<br />
major product exports before <strong>and</strong> post AFMA period. Some of the little<br />
changes in market destinations occurred in pineapple <strong>and</strong> pineapple<br />
products, tobacco <strong>and</strong> to some extent, tuna during AFMA<br />
implementation period;<br />
c. The agriculture export performance of the Philippines was partly<br />
stymied by the WTO-Agreement. The difficulty in the negotiations<br />
emanates from the operationalization of the key pillars of the<br />
agreement itself: a) Market access of tariffs <strong>and</strong> tariffications including<br />
special safeguards <strong>and</strong> tariff quotas; b) Domestic support which<br />
centers on the interpretation of the green box, blue box, <strong>and</strong><br />
development programs, <strong>and</strong> amber box including the di minimis<br />
principles; c) Export Competition covering export subsidies,<br />
anticircumvention (e.g. state agency exports) <strong>and</strong> export prohibitions<br />
4.2 - 45
<strong>and</strong> restrictions; <strong>and</strong> d) other rules: special <strong>and</strong> differential treatments,<br />
peace clause (now expired), commitments to reforms, Non food<br />
importing developed country decision, <strong>and</strong> agreement on the<br />
application of Sanitary ad Phytosanitary measures;<br />
d. The interlocking issues related to market access, domestic support <strong>and</strong><br />
export competition has directly affected the agricultural export<br />
performance of the Philippines. A recent study of Gonzales (2007) on<br />
trade performance of 11 less developed countries (LDCs) <strong>and</strong> 10<br />
developed countries (DCs) of the Asia Pacific Region, indicated that<br />
the Philippines <strong>and</strong> Peru were laggards in terms of export performance<br />
during the periods 1996-1999 <strong>and</strong> 2000-2005. The average export<br />
receipts in the Philippines did not reach US 3 billion during the period.<br />
In contrast other LDCs like China, Thail<strong>and</strong>, Russian Federation,<br />
Indonesia, Malaysia Chile <strong>and</strong> Mexico had export revenues ranging<br />
from US$10 to 28 billion in 2005;<br />
e. The Philippines is also faced with difficulties in accessing markets of<br />
developed countries due to strict implementation of Sanitary <strong>and</strong><br />
Phytosanitary (SPS) measures The study done by Gonzales, Lacson<br />
<strong>and</strong> Marges (2005) indicated that Philippine export products such as<br />
mango (to Japan) <strong>and</strong> pineapple <strong>and</strong> banana (to Australia) have been<br />
constrained by SPS requirements by these two countries. Preliminary<br />
estimates of the Authors on the impact of Japan’s SPS measures <strong>and</strong><br />
the current “positive list” were unrealized export receipt of<br />
US$127million, loss of corporate income tax revenue of US$ 20<br />
million, <strong>and</strong> forgone farm employment income opportunities close to<br />
US$ 12 million. In the Australian case the indicative estimates of<br />
opportunity losses were US$ 64million in export receipt, US$ 11 million<br />
in corporate taxes, <strong>and</strong> US$ 12 million in farm employment<br />
opportunities<br />
f. Availment of Tariff Exemptions on Fisheries <strong>and</strong> Agriculture<br />
Modernization (TEFAM) was dominated by firms in Regions 4-A <strong>and</strong> 3,<br />
during the post AFMA period. Likewise, big agribusiness firms were the<br />
major recipients of TEFAM. Tariff waiver for soya bean meal imports<br />
shared the major value (66%) of agricultural input imports, because 70<br />
percent of the top ten agribusiness firms were engaged in poultrylivestock<br />
production <strong>and</strong> feedmilling activities.<br />
g. The Agriculture Competitiveness Enhancement Fund (ACEF), although<br />
not a direct provision of AFMA, is supposed to augment AFMA’s thrust<br />
in modernizing agriculture. However, it is beset with operational<br />
problems. Around PhP 2.7 billion of ACEF credit facility are still<br />
unallocated <strong>and</strong> must be disposed by 2007 if its existence is not<br />
extended beyond this period.<br />
4.2 - 46
h. The results of stakeholders’ interviews <strong>and</strong> 16 Regional<br />
consultation/workshops indicated that trade as component of AFMA<br />
was not ranked “high” by stakeholders in the Region. The major reason<br />
for this, was the inadequacy of physical infrastructures <strong>and</strong> support<br />
services, <strong>and</strong> “low” level of agricultural development in the countryside<br />
that constrain the competitiveness of agricultural products in global<br />
trade;<br />
i. The general impact of trade as AFMA component, indicated generally<br />
“none” <strong>and</strong> “low” impact <strong>and</strong> “poor” level of implementation across the<br />
commodity subsectors. However, bright spots of export<br />
competitiveness are emerging in high value crops <strong>and</strong> fishery<br />
subsectors in some of the regions. The common ingredients of some of<br />
the more successful programs relative to trade are active private sector<br />
participation <strong>and</strong> market-driven orientation.<br />
Recommendations<br />
4.2.70 Given the empirical findings of the trade <strong>and</strong> fiscal incentives analysis, the<br />
following recommendations are suggested:<br />
a. Pursuance of a more vigorous macro <strong>and</strong> subsectoral policy<br />
reforms <strong>and</strong> law enforcement relative to agricultural trade, to<br />
enhance the evolving gains in export competitiveness during<br />
AFMA implementation period. Enforcement of existing laws (e.g.<br />
anti-smuggling, quarantine) <strong>and</strong> enhancement of domestic support<br />
measures to gain competitiveness are in the right directions.<br />
b. Continue stronger trade negotiation initiatives with other members<br />
of the LDCs (Group of 20, Group of 33 <strong>and</strong> AFTA) of WTO to level<br />
the playing field in agricultural trade. This Implies strengthening of<br />
the Policy Analysis Division of DA to backstaff trade negotiations.<br />
c. Assist small-medium enterprises <strong>and</strong> cooperatives in the regions to<br />
avail of tariff exemptions of imported agricultural inputs, to enhance<br />
their competitiveness in the export market.. The feasibility of<br />
removing all forms of tariff that constrains agricultural<br />
modernization should be explored as a policy.<br />
d. Revisit the ACEF, extend its economic life if necessary, <strong>and</strong> study<br />
alternative strategies to make it more effective as an enhancing<br />
mechanism to global competitiveness in the agriculture <strong>and</strong><br />
fisheries sector;<br />
e. Reprioritize the remaining budget of ACEF so that it can provide<br />
funding for strategic public investments closest to the major project<br />
areas of already ongoing ACEF projects <strong>and</strong> allocate grants to<br />
special projects for technical assistance (Feasibility Studies,<br />
Management Guidance, etc) among small farmers’ organizations<br />
<strong>and</strong> cooperatives applying for funding under ACEF Facility.<br />
f. Revisit the implementation mechanisms of ACEF to separate the<br />
policy <strong>and</strong> oversight functions with the management<br />
4.2 - 47
implementation of the facility. Some of the delays in project<br />
approvals in the past were due to unclear interpretations of these<br />
functions.<br />
g. <strong>Trade</strong> issues should be integrated in the national development<br />
agenda, especially those related to poverty reduction, increasing<br />
productivity <strong>and</strong> competitiveness, providing compensation <strong>and</strong><br />
human development safeguards, <strong>and</strong> diversification of exports <strong>and</strong><br />
markets. At the regional / international development levels, trade<br />
issues should build credible alliances, achieve fairer terms of trade,<br />
target technical assistance, strengthen the SDT provisions of the<br />
WTO Agreement, offer aid for trade <strong>and</strong> focus on human<br />
development.<br />
h. To make trade work for human development (UNDP 2007) the<br />
following eight (8) point national agenda are recommended:<br />
1. Invest for competitiveness – This implies public investment<br />
in infrastructures, human capital, R&D <strong>and</strong> ICT;<br />
2. Adopt strategic <strong>Trade</strong> Policies – select strategic goods /<br />
services with great potential linkage with other industries;<br />
3. Restore focus on Agriculture- agriculture should be the<br />
core of development strategy to combat poverty <strong>and</strong> food<br />
insecurity;<br />
4. Combat Jobless Growth – Target agro industries that<br />
promote sustainable rural employment not for short term<br />
growth;<br />
5. Prepare a new tax regime – progressive tax structure that<br />
doesn’t hurt the poor (customs tax, corporate taxes)<br />
should be encouraged to fund the process of adjustment<br />
under trade liberalization<br />
6. Maintain stable exchange rate – realistic rates to<br />
encourage investments;<br />
7. Persist with Multilateralism – avoid bilateral trade, go for<br />
multilateral trade arrangements; <strong>and</strong><br />
8. Cooperate with neighbors- Regional <strong>Trade</strong> Agreements<br />
complemented with other forms of cooperation (e.g.<br />
financial arrangement)<br />
i. Finally, since the findings on the general impact of AFMA are not<br />
as robust as envisioned by the law, revisiting the law’s IRR is in<br />
order, including a strong political will to provide budgetary<br />
allocation to the agriculture <strong>and</strong> fisheries sector to make it more<br />
competitive.<br />
4.2 - 48