Budget/Finance - National Agricultural and Fishery Council ...
Budget/Finance - National Agricultural and Fishery Council ...
Budget/Finance - National Agricultural and Fishery Council ...

You also want an ePaper? Increase the reach of your titles
YUMPU automatically turns print PDFs into web optimized ePapers that Google loves.
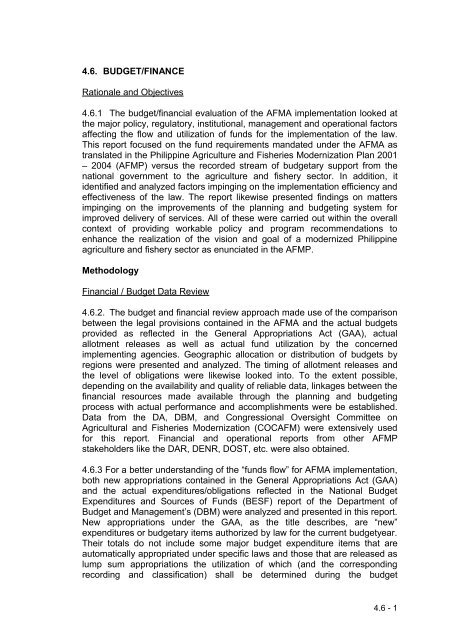
4.6. BUDGET/FINANCE<br />
Rationale <strong>and</strong> Objectives<br />
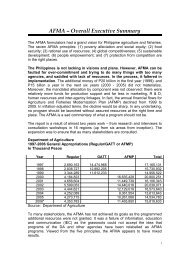
4.6.1 The budget/financial evaluation of the AFMA implementation looked at<br />
the major policy, regulatory, institutional, management <strong>and</strong> operational factors<br />
affecting the flow <strong>and</strong> utilization of funds for the implementation of the law.<br />
This report focused on the fund requirements m<strong>and</strong>ated under the AFMA as<br />
translated in the Philippine Agriculture <strong>and</strong> Fisheries Modernization Plan 2001<br />
– 2004 (AFMP) versus the recorded stream of budgetary support from the<br />
national government to the agriculture <strong>and</strong> fishery sector. In addition, it<br />
identified <strong>and</strong> analyzed factors impinging on the implementation efficiency <strong>and</strong><br />
effectiveness of the law. The report likewise presented findings on matters<br />
impinging on the improvements of the planning <strong>and</strong> budgeting system for<br />
improved delivery of services. All of these were carried out within the overall<br />
context of providing workable policy <strong>and</strong> program recommendations to<br />
enhance the realization of the vision <strong>and</strong> goal of a modernized Philippine<br />
agriculture <strong>and</strong> fishery sector as enunciated in the AFMP.<br />
Methodology<br />
Financial / <strong>Budget</strong> Data Review<br />
4.6.2. The budget <strong>and</strong> financial review approach made use of the comparison<br />
between the legal provisions contained in the AFMA <strong>and</strong> the actual budgets<br />
provided as reflected in the General Appropriations Act (GAA), actual<br />
allotment releases as well as actual fund utilization by the concerned<br />
implementing agencies. Geographic allocation or distribution of budgets by<br />
regions were presented <strong>and</strong> analyzed. The timing of allotment releases <strong>and</strong><br />
the level of obligations were likewise looked into. To the extent possible,<br />
depending on the availability <strong>and</strong> quality of reliable data, linkages between the<br />
financial resources made available through the planning <strong>and</strong> budgeting<br />
process with actual performance <strong>and</strong> accomplishments were be established.<br />
Data from the DA, DBM, <strong>and</strong> Congressional Oversight Committee on<br />
<strong>Agricultural</strong> <strong>and</strong> Fisheries Modernization (COCAFM) were extensively used<br />
for this report. Financial <strong>and</strong> operational reports from other AFMP<br />
stakeholders like the DAR, DENR, DOST, etc. were also obtained.<br />
4.6.3 For a better underst<strong>and</strong>ing of the “funds flow” for AFMA implementation,<br />
both new appropriations contained in the General Appropriations Act (GAA)<br />
<strong>and</strong> the actual expenditures/obligations reflected in the <strong>National</strong> <strong>Budget</strong><br />
Expenditures <strong>and</strong> Sources of Funds (BESF) report of the Department of<br />
<strong>Budget</strong> <strong>and</strong> Management’s (DBM) were analyzed <strong>and</strong> presented in this report.<br />
New appropriations under the GAA, as the title describes, are “new”<br />
expenditures or budgetary items authorized by law for the current budgetyear.<br />
Their totals do not include some major budget expenditure items that are<br />
automatically appropriated under specific laws <strong>and</strong> those that are released as<br />
lump sum appropriations the utilization of which (<strong>and</strong> the corresponding<br />
recording <strong>and</strong> classification) shall be determined during the budget<br />
4.6 - 1
implementation phase. A good example is the Priority Development<br />
Assistance Fund (PDAF), a lump sum fund whose disbursements are under<br />
Congressional prerogative. The bulk of PDAF go to the construction <strong>and</strong><br />
repairs of farm-to-market roads, post-harvest facilities <strong>and</strong> other AFMArelated<br />
activities or projects. However, the estimated amounts are not<br />
reflected as part of the AFMA budget appropriations in the GAA. Recordings<br />
of expenditures are done after the fact in the BESF as obligations incurred<br />
under the AFMA. In this connection, the expenditures budget was used in this<br />
study. A table showing the comparisons of the budget shortfalls/excesses<br />
using the new appropriations <strong>and</strong> the expenditures figures over the amount<br />
prescribed under the law was presented in this study.<br />
Financial Data Gathering Limitations<br />
No regular reports submissions<br />
4.6.4 At this juncture it is important to note that the DA is m<strong>and</strong>ated to<br />
“submit to the Senate Committee on <strong>Finance</strong>, the House Committee on<br />
Appropriations <strong>and</strong> the COCAFM a consolidated quarterly financial <strong>and</strong><br />
narrative report on the implementation of the AFMA”. 1 However, findings<br />
showed the lack of compliance to this in so far as regular quarterly reporting<br />
to the COCAFM is concerned. Copies of the DA Annual Reports are<br />
submitted to COCAFM.<br />
Differences in budget data reported by DBM vs. DA <strong>and</strong> DAR<br />
4.6.5 The Consultant also discovered that the records of DBM did not tally<br />
with those of the DA <strong>and</strong> DAR in terms of the reported appropriations,<br />
obligations <strong>and</strong> actual cash disbursements over time. And, there are no efforts<br />
to date to reconcile the reported figures.<br />
4.6.6 GAA version of DA for AFMA vary with that of the DBM because DBM<br />
includes all items which DA claims are not within its concern. For example,<br />
the DA AFMA budget computations exclude most items recorded under the<br />
2005 General Appropriations Act Section XXXVI-B (State Universities &<br />
Colleges); C (PCAFNRRD); D (<strong>Budget</strong>ary Support to GOCCs except PCA)<br />
<strong>and</strong> E (Allocations to Local Government Units) except for the Southern<br />
Philippines Irrigation Sector Project, Mindanao Rural Development Program<br />
under the MDF, <strong>and</strong> the Cordillera Highl<strong>and</strong> <strong>Agricultural</strong> Resource<br />
Management Project under the LGEF. According to DA, reconciliation of<br />
figures will only be possible through analysis of each individual special<br />
allotment release orders (SARO) issued by DBM against those received by<br />
DA, which is a long <strong>and</strong> tedious process. On the other h<strong>and</strong>, according to<br />
DAR there is no special Agrarian Reform Fund particularly intended for AFMA<br />
1 General Appropriations Act. Special provisions for the establishment <strong>and</strong> utilization of the<br />
AFMP Special Purpose Fund.<br />
4.6 - 2
implementation only fund attributions from the CARP <strong>Budget</strong> for Program<br />
Beneficiaries Development. DAR <strong>and</strong> DBM totals do not likewise tally.<br />
4.6.7 As a result, in view of the fact that the DBM is the official government<br />
agency tasked to officially report on the overall government budget, the<br />
Consultant decided to use the DBM figures for purposes of this study.<br />
Regional Consultations<br />
4.6.8 Regional consultations were conducted with the following objectives,<br />
among others: first, gathering information, from stakeholders’ viewpoint, on<br />
actual budget releases for specific industries <strong>and</strong> if these were translated to<br />
specific output; <strong>and</strong>, second, drawing out proposals for improvement -<br />
knowing that funds are scarce <strong>and</strong> all needs cannot be addressed.<br />
4.6.9 The workshop made use of plenary <strong>and</strong> focus group discussions<br />
(FGDs). Participants were requested to assess whether the budget for AFMA<br />
was adequate or inadequate <strong>and</strong> why. The reason/s included perceptions on<br />
budget releases, which were translated to specific outputs. In addition, they<br />
were likewise asked for their suggestions on where the limited AFMA<br />
budgetary resources should be focused. Given the present budget<br />
constraints, the workshop participants prioritized the following components for<br />
modernization by ranking them from highest to lowest with 1 being the<br />
highest: irrigation; post harvest facilities; other infrastructure like farm-tomarket-roads,<br />
etc.; credit; trade; marketing assistance; information support;<br />
product st<strong>and</strong>ardization <strong>and</strong> consumer safety; education; research <strong>and</strong><br />
development (R&D); extension; <strong>and</strong> others. They selected <strong>and</strong> ranked,<br />
through frequency count of FGD participants, five priority areas for<br />
intervention where a limited budget can be focused.<br />
Agriculture <strong>and</strong> Fisheries Performance<br />
4.6.10 The DA has over the years, been ever-present in all aspects of<br />
agriculture operations: production, procurement, financing, credit, marketing<br />
<strong>and</strong> distribution. Such practice exerts tremendous pressure on its limited<br />
resources, financial, manpower <strong>and</strong> other logistics. Oftentimes, the DA had<br />
been criticized to have had spread itself too thinly resulting in mediocre<br />
delivery of services <strong>and</strong> a lot of unmet expectations <strong>and</strong> at times dampening<br />
private sector initiatives. The AFMA is a serious attempt to give the much<br />
needed direction, convergence strategy as well as resources for the DA to<br />
spearhead the realization of a modernized Philippine agriculture <strong>and</strong> fishery<br />
sector.<br />
4.6 - 3
The AFMP <strong>and</strong> the <strong>Budget</strong><br />
4.6.11 The AFMP was prepared in accordance with the Medium-Term<br />
Philippine Development Plan (MTPDP) for 2001 to 2004. The MTPDP<br />
contained the blueprint for the planned achievement of the broad-based <strong>and</strong><br />
sustainable development for the country. It sought to operationalize the<br />
AFMA-defined principles in modernizing the agriculture <strong>and</strong> fisheries sector<br />
<strong>and</strong> specified in detailed the m<strong>and</strong>ated programs <strong>and</strong> stream of public<br />
investments necessary.<br />
4.6.12 The AFMP provided the strategic context for the annual budget. It<br />
presented the strategic framework to harmonize <strong>and</strong> unify the various<br />
agriculture <strong>and</strong> fishery development programs, projects <strong>and</strong> activities in the<br />
country. It likewise afforded the Congress <strong>and</strong> DBM the sound bases for the<br />
review <strong>and</strong> support of the annual budget proposals in support of agriculture<br />
<strong>and</strong> fisheries sector modernization. Past accomplishments, constraints faced<br />
<strong>and</strong> the long-term vision <strong>and</strong> short- to medium-range plans that will assure the<br />
continued support for farmers <strong>and</strong> fisherfolks regardless of changes in the<br />
political arena, set the stage for the crafting of the AFMP budget for 2001 –<br />
2004.<br />
4.6.13 The AFMP rationalized <strong>and</strong> translated the AFMA’s provisions for<br />
increased budgetary support to modernize the agriculture <strong>and</strong> fisheries sector.<br />
It had been pointed out that the “historically inadequate government support<br />
to agriculture is one major cause of the under-performance of the sector”. 2<br />
AFMA is an attempt to remedy the situation.<br />
AFMA Funding Provisions<br />
4.6.14 AFMA provides for an initial year (1999) funding of P20 billion in<br />
addition to the 1998 DA budget. Under Rule 112, the DBM was m<strong>and</strong>ated to<br />
include in the President’s budget program, <strong>and</strong> correspondingly release, P20<br />
billion for the period 2000 to 2004 (at least P17 billion per year in addition to<br />
the DA’s 1998 appropriation of P2.771 billion). The P20 billion a year will<br />
provide for the needed steady flow of public investment support to the<br />
agriculture <strong>and</strong> fisheries sector. The planned allocation is enumerated in<br />
Table 4.6.1.<br />
2 Department of Agriculture, The Philippine Agriculture <strong>and</strong> Fisheries Modernization Plan<br />
2001-2004.<br />
4.6 - 4
Table 4.6.1 Planned Annual <strong>Budget</strong> Allocation of PhP20 Billion Funds for<br />
AFMA For FY 2000 – 2004 Implementation<br />
Particulars % of<br />
Amount<br />
In PhP<br />
Total Billion<br />
1. Irrigation 30.00 6.00<br />
2. Post-harvest Facilities 10.00 2.00<br />
3. Agro-Industry Modernization Credit <strong>and</strong><br />
Financing<br />
10.00 2.00<br />
4. Other Infrastructure 10.00 2.00<br />
5. Research <strong>and</strong> Development (R&D) 10.00 2.00<br />
6. Marketing Assistance 8.00 1.60<br />
7. Salary Supplement of Extension<br />
Workers / Extension Services<br />
6.00 1.20<br />
8. Capability Building 5.00 1.00<br />
9. <strong>National</strong> Agriculture <strong>and</strong> Fisheries<br />
Education System<br />
5.00 1.00<br />
10.<strong>National</strong> Information Network 4.00 0.80<br />
11.Rural Non-Farm Employment Training 1.75 0.35<br />
12.Identification of Strategic Agriculture<br />
<strong>and</strong> Fisheries Development Zones<br />
0.25 0.05<br />
Total 100.00 20.00<br />
4.6.15 Starting the year 2001 R&D well as agriculture <strong>and</strong> fisheries extension<br />
shall each have annual budget allocation of not be less than 1% of agriculture<br />
Gross Value Added or GVA (including livestock <strong>and</strong> fisheries) reported by the<br />
<strong>National</strong> Statistics Coordinating Board (NSCB) 2 years before the current<br />
budget year. For example, for 2001, 1% shall be based on the 1999 GVA. For<br />
each, these should translate to not less than the following (in billion pesos):<br />
2001, P5.06; 2002, P5.22; 2003, P5.47; 2004, P5.97; 2005, P6.29; <strong>and</strong> 2006,<br />
P7.31. These computations were based on 1% of the nominal values of GVA<br />
excluding forestry for each year.<br />
Planning <strong>and</strong> Financial Management Organization for AFMA<br />
4.6.16 Rule 111.1 of AFMA required the DA to “identify all of its offices,<br />
agencies, functions, programs, projects <strong>and</strong> activities whether regular or<br />
related to GATT adjustments, including the corresponding appropriations, <strong>and</strong><br />
classify these according to the specific items/categories provided in items (1)<br />
through (12) of Section 111” (as shown in Table 4.6.2). As such, the<br />
corresponding planning <strong>and</strong> financial management systems of the DA <strong>and</strong><br />
other AFMA implementing agencies should have been restructured <strong>and</strong><br />
rationalized along the lines of the AFMP. They should have included the<br />
monitoring <strong>and</strong> evaluation of physical accomplishments vis-à-vis<br />
budget/financial performance in the implementation of the AFMA.<br />
4.6 - 5
4.6.17 The DA had taken positive steps to implement the called for reforms in<br />
the planning <strong>and</strong> financial/budgeting systems <strong>and</strong> processes within the<br />
agriculture bureaucracy. With the end in view of reorienting <strong>and</strong> even<br />
restructuring the DA agencies <strong>and</strong> operations towards functional lines in<br />
accordance with the AFMA <strong>and</strong> the public expenditure management reforms<br />
of the government, several organizational studies were conducted <strong>and</strong><br />
detailed implementation plans prepared. These include the following:<br />
Improving Governance for <strong>Agricultural</strong> Bureaucracy (IGAB); Capacity Building<br />
for Policy Formulation, Planning; Monitoring <strong>and</strong> Evaluation for the Agriculture<br />
Sector (CBAPP); Public Resource Allocation System (PRAS) Study; Plan,<br />
Performance Monitoring Indicator System (PPMIS); <strong>and</strong> a comprehensive<br />
training needs assessment under the Grains Sector Development Project<br />
(GSDP). 3 However, despite these initiatives, the DA still finds itself grappling<br />
with the same problems as before <strong>and</strong> with its operations not quite attuned<br />
with the principles <strong>and</strong> priorities laid down by the AFMA.<br />
4.6.18 The obvious disconnect between the DA’s planning <strong>and</strong> budgeting<br />
systems had resulted in the incongruence between what it needs to do <strong>and</strong><br />
what it actually does. The much needed changes <strong>and</strong> improvements in the<br />
planning <strong>and</strong> financial systems, particularly in developing close linkages<br />
between its operational plans/targets <strong>and</strong> its financial <strong>and</strong> other resources are<br />
yet to be put into place/implemented <strong>and</strong> institutionalized.<br />
4.6.19 At present, the DA <strong>and</strong> the whole national government bureaucracy is<br />
undertaking a rationalization program that will hopefully address the above<br />
concerns.<br />
Total Funding Support to Agriculture: 1993 – 2005<br />
4.6.20 As shown in Table 4.6.2, for the 13 year period 1993 – 2005 the<br />
national government provided a total of PhP226.59 billion new appropriations<br />
under the DA regular budget <strong>and</strong> GATT-related adjustment measures/AFMA<br />
funds. Of these, expenditures or obligations amounted to PhP210.81 billion,<br />
equivalent to 88.67% fund utilization. Disbursement during 1999 to 2005<br />
showed an improvement of about 8% compared with the 1993 to 1998 period.<br />
Appropriations <strong>and</strong> obligations were only slightly higher during the1999 to<br />
2005 AFMA years at 53% <strong>and</strong> 55.28%, respectively compared with the 1993<br />
to 1998 pre-AFMA years.<br />
3 DA, Diversified Farm Income <strong>and</strong> Market Development Project (DFIMDP) document.<br />
4.6 - 6
Table 4.6.2. DA + GATT + AFMA Appropriations & Obligations, 1993 –<br />
2005 (In Million Pesos)<br />
PARTICULARS Total<br />
<strong>Budget</strong> Program By<br />
Appropriation Source<br />
Department of Agriculture 57,194<br />
GATT-related Adjustment<br />
Measures / AFMA Fund 169,395<br />
TOTAL 226,589<br />
<strong>Budget</strong> Expenditures, Obligation<br />
Basis<br />
Department of Agriculture 59,706<br />
GATT-related Adjustment<br />
Measures / AFMA Fund 34,732<br />
TOTAL 210,806<br />
% Obligations to<br />
Appropriations 88.67%<br />
4.6.21 <strong>Budget</strong> expenditures growth rate over the 13 year period was<br />
recorded at 24.73%. The growth was much higher at 57.25% during the pre-<br />
AFMA years compared with only 1.15% during the 1999 to 2005 AFMA<br />
period. Among the regions, Regions 3 <strong>and</strong> 8 received the largest budget of a<br />
little over P5.0 billion each, while CARAGA, ARMM <strong>and</strong> CAR received the<br />
lowest totals at PhP795 million, PhP878 million <strong>and</strong> PhP894 million,<br />
respectively over the 13-year period. Table 4.6.3.<br />
4.6 - 7
Table 4.6.3. <strong>Budget</strong> Expenditures: DA + GATT + AFMA, 1993 to 2005 (In Million Pesos)<br />
1993-2005 PRE AFMA (1993-1998) AFMA PERIOD (1999-2005)<br />
Particulars<br />
Total<br />
(Million P)<br />
Growth<br />
Rate (%)<br />
% Share Total<br />
(Million P)<br />
Growth<br />
Rate (%)<br />
% Share Total<br />
(Million P)<br />
Growth<br />
Rate (%)<br />
% Share<br />
Total 210,807.91 24.73 100.00 94,438.71 57.25 100.00 116,369.20 1.15 100.00 23.22<br />
Nationwide 94,112.41 43.80 44.64 51,871.67 52.43 54.93 42,240.74 (0.10) 36.30 (18.57)<br />
Central Office 85,978.71 826.05 40.79 34,127.09 1,464.06 36.14 51,851.62 3.02 44.56 51.94<br />
NCR - - - - - - - - - -<br />
CAR 1,224.82 30.10 0.58 407.62 57.34 0.43 817.19 2.83 0.70 100.48<br />
Region1 894.75 20.18 0.42 230.64 23.14 0.24 664.11 (1.04) 0.57 187.94<br />
Region 2 1,759.46 21.01 0.83 415.22 23.48 0.44 1,344.23 0.83 1.16 223.74<br />
Region 3 5,027.07 167.75 2.38 662.09 104.11 0.70 4,364.99 0.88 3.75 559.28<br />
Region 4 3,254.46 29.15 1.54 1,328.51 60.52 1.41 1,925.96 1.15 1.66 44.97<br />
Region 5 1,475.68 17.77 0.70 417.10 26.42 0.44 1,058.58 1.08 0.91 153.80<br />
Region 6 1,645.83 87.01 0.78 731.05 197.18 0.77 914.78 2.33 0.79 25.13<br />
Region 7 2,015.10 41.70 0.96 710.43 82.46 0.75 1,304.67 0.82 1.12 83.65<br />
Region 8 5,043.98 145.90 2.39 829.17 192.74 0.88 4,214.81 4.97 3.62 408.32<br />
Region 9 1,887.60 83.33 0.90 799.19 169.82 0.85 1,088.42 0.32 0.94 36.19<br />
Region 10 1,460.77 45.04 0.69 528.44 81.69 0.56 932.34 1.48 0.80 76.43<br />
Region 11 1,611.94 14.29 0.76 438.20 15.83 0.46 1,173.74 0.45 1.01 167.86<br />
Region 12 1,762.09 65.55 0.84 314.76 17.95 0.33 1,447.33 1.46 1.24 359.82<br />
CARAGA 794.99 273.55 0.38 20.52 814.59 0.02 774.47 1.15 0.67 3,675.15<br />
ARMM 878.25 - 0.42 607.03 - 271.22 - 0.23 -<br />
B/A<br />
Inc./<br />
(Dec.)<br />
4.6 - 8
Pre-AFMA Years: 1993 - 1998<br />
4.6.22 Table 4.6.4 shows the budget program by appropriations <strong>and</strong> expenditures<br />
of the DA under the regular fund <strong>and</strong> the special fund allocations for GATT-related<br />
adjustment measures for the period 1993 to 1998. Total appropriations amounted<br />
to PhP106.50 billion of which PhP23.935 billion was for DA regular programs <strong>and</strong><br />
the bulk of PhP82.565 billion was for the implementation of the intended safety<br />
nets. Fund utilization over the period was registered at 88.67% of appropriations.<br />
The highest utilization in terms of peso value was in 1995 when a total of<br />
PhP28.998 billion was spent. This is equivalent to 85.43% of appropriations.<br />
1994 <strong>and</strong> 1997 both registered utilization rate of 104.04% <strong>and</strong> 103.98%,<br />
respectively. This was possible because of the continuing nature of the additional<br />
appropriations under the GATT-related measures special funds.<br />
Table 4.6.4. DA + GATT-Related Measures Appropriations & Obligations,<br />
1993 – 1998 (In Million Pesos)<br />
PARTICULARS Total 1993 1994 1995 1996 1997 1998<br />
<strong>Budget</strong> Program By<br />
Appropriation Source<br />
Department of<br />
Agriculture 23,935 8,226 6,430 1,913 2,342 2,252 2,772<br />
GATT-related<br />
Adjustment<br />
Measures Fund 82,565 32,030 16,895 17,728 15,912<br />
TOTAL 106,500 8,226 6,430 33,943 19,237 19,980 18,684<br />
<strong>Budget</strong> Expenditures,<br />
Obligation Basis<br />
Department of<br />
Agriculture 59,706 6,174 6,690 4,730 7,466 20,775 13,871<br />
GATT-related<br />
Adjustment<br />
Measures Fund 34,732 24,268 10,464<br />
AFMA<br />
TOTAL 94,438 6,174 6,690 28,998 17,930 20,775 13,871<br />
% Obligations to<br />
Appropriations 88.67% 75.05% 104.04% 85.43% 93.21% 103.98% 74.24%<br />
4.6.23 It appeared that at least 90% of total budget was controlled at the DA<br />
Central Office (DACO) with only 10% or less going to the regions. As shown in<br />
Table 4.6.5, 42.44% of regular budget expenditures was under the DACO<br />
operations while the 47. 64% was for the implementation of the nationally funded<br />
production programs for rice, corn, livestock, high value commercial crops, etc.<br />
The amounts were sub-allotted to the DA Regional Field Units (DARFU). In terms<br />
of expenditures of the GATT-related measures special funds 67.45% went to<br />
nationwide operations while only 25.30% went to the DACO support to operations.<br />
It is important to note that all the DARFUs were highly dependent on the DACO<br />
for actual releases of sub-allotments <strong>and</strong> the corresponding cash for the use of<br />
nationally-funded production programs. Regions 4, 6, 8 <strong>and</strong> 9 received the highest<br />
4.6 - 9
udget allocations – from around PhP800 million to PhP1.30 billion, for the period<br />
1993 to 1998. Region 4 received the highest total amount for the period.<br />
4.6.24 Following the DA’s contention that budget for nationwide program<br />
implementation went to the field offices, DACO’s overall share of total budgets<br />
(excluding the amount set aside for national programs) was equivalent to more<br />
than one third or 36% of total. Data on the actual breakdown of expenditures to<br />
each region contained a lot of cost attributions with the accounting reports not<br />
attuned to a more effective AFMA program monitoring.<br />
Table 4.6.5. Regional Allocation of DA <strong>and</strong> GATT-Related Measures<br />
Expenditures <strong>Budget</strong>, 1993 – 1998 (In Million Pesos)<br />
Department of Agriculture GATT-Related Adj. Measures<br />
Particulars<br />
Total<br />
1993-<br />
Growth<br />
Rate (%) % Share<br />
Total<br />
1993-<br />
Growth<br />
Rate (%) % Share<br />
1998<br />
1998<br />
Total 59,706.39 36.39 100 34,732.32 - 100.00<br />
Nationwide 28,443.16 179.29 47.64 23,428.52 - 67.45<br />
Central Office 25,339.57 262.49 42.44 8,787.56 - 25.30<br />
NCR - - - - - -<br />
CAR 388.591 54.27 0.65 19.03 - 0.05<br />
Region1 93.72 4.95 0.32 36.92 - 0.11<br />
Region 2 403.79 20.78 0.68 11.43 - 0.03<br />
Region 3 372.46 14.87 0.62 289.62 - 0.83<br />
Region 4 1,077.66 28.12 1.81 250.65 - 0.72<br />
Region 5 354.85 11.42 0.59 62.24 - 0.18<br />
Region 6 707.09 194.44 1.18 23.96 - 0.07<br />
Region 7 456.05 17.24 0.76 254.38 - 0.73<br />
Region 8 573.19 115.04 0.96 255.98 - 0.74<br />
Region 9 354.93 15.29 0.59 444.25 - 1.28<br />
Region 10 342.04 25.51 0.57 186.39 - 0.54<br />
Region 11 376.52 3.13 0.63 61.67 - 0.18<br />
Region 12 302.08 16.23 0.51 12.68 - 0.04<br />
CARAGA 20.52 814.59 0.03 - - -<br />
ARMM - - - 607.03 - 1.75<br />
Source of Basic Data: DBM<br />
4.6 - 10
AFMA Years: 1999 - 2005<br />
4.6.25 It was noted that inflows of financial resources to the agriculture sector did<br />
not increase as expected with the passage of AFMA.<br />
Actual <strong>Budget</strong> vs AFMA Prescribed <strong>Budget</strong> 1999 – 2005<br />
4.6.26 Total actual budget fell below what were prescribed by the law both in<br />
terms of new appropriations <strong>and</strong> obligations. As shown in Table 4.6.6 new<br />
appropriations totaled PhP120.089 billion from 1999 to 2005. This is PhP61 billion<br />
(34%) less than the P181.438 billion set by the law 4 . The biggest budget shortfalls<br />
were experienced in 2004 <strong>and</strong> 2005 when total new appropriations amounted to<br />
only PhP12.25 billion <strong>and</strong> PhP13.18 billion, respectively. These were equivalent<br />
to a measly 43% <strong>and</strong> 45% of the requirements for 2004 <strong>and</strong> 2005, respectively,<br />
despite the law’s intent <strong>and</strong> unequivocal provisions.<br />
4.6.27 Total obligations of PhP116.37 billion, (as reported by the DBM based on<br />
expenditures attribution to the AFMA implementation), was incurred over 1999 to<br />
2005. Except for the year 2000, when actual obligations exceeded by a measly<br />
2% of the AFMA recommended amount as computed (by the Consultant), annual<br />
obligations always fell way below the prescribed budget for each corresponding<br />
year. Shortfalls were always around 50% during the last 3 years at 50%, 53% <strong>and</strong><br />
50% in 2003, 2004 <strong>and</strong> 2005, respectively. Table 4.6.7.<br />
Fund Utilization Efficiency, 1999 - 2005<br />
4.6.28 Fund utilization efficiency as evidenced by the amount of obligations<br />
incurred vis-à-vis the available new appropriations was registered at 96.90% for<br />
the period 1999 to 2005 Table 4.6.8. This showed an improvement of about 8%<br />
over the six-year disbursement efficiency of 88.67% over the period 1993 to 1998.<br />
Nevertheless, actual expenditures still fell short by a total of PhP3.72 billion (3%)<br />
during the AFMA years. As such, this put to question the DA’s absorptive capacity<br />
to manage <strong>and</strong> disburse the tremendous increase in financial resources. For the<br />
years 2000, 2002 <strong>and</strong> 2003 DBM recorded unutilized appropriations at 10%, 23%<br />
<strong>and</strong> 29%, respectively.<br />
4.6.29 As mentioned earlier, AFMA provided for a continuing appropriations <strong>and</strong><br />
comprehensive releases of allotments. As such, a shortfall in fund utilization for<br />
one year can be offset by increases in the succeeding year/years’ spending.<br />
4 Based on computations made by the Consultant: budgets for R&D <strong>and</strong> extension each at 1% of<br />
GVA at current prices two years before the budget year (i.e, 1999 GVA to compute for 2001<br />
budget) minus the current allocation of PhP2 billion <strong>and</strong> PhP1.2 billion, respectively.<br />
4.6 - 11
Table 4.6.6. New Appropriations vs. AFMA Prescribed <strong>Budget</strong>, 1999-2005<br />
(In Million Pesos)<br />
PARTICULARS TOTAL 1999 2000 2001 2002 2003 2004 2005<br />
New Appropriations<br />
Department of Agriculture<br />
AFMA (a)<br />
TOTAL -DA+AFMA<br />
33,2<br />
59<br />
86,<br />
830<br />
120,<br />
089<br />
14,06<br />
2 3,167<br />
19,3<br />
-<br />
85<br />
14,06 22,5<br />
2 52<br />
Computed at AFMA prescribed minimum of 1% of GVA for research <strong>and</strong> another 1% of GVA for extension minus P3.2 billion allocation.:<br />
2,91<br />
3<br />
12,03<br />
5<br />
14,94<br />
8<br />
4,19<br />
4 3,118 2,889 2,916<br />
19,48 16,30 9,36<br />
7<br />
1<br />
1 10,261<br />
23,68 19,41 12,25<br />
1<br />
9<br />
0 13,177<br />
AFMA Prescribed <strong>Budget</strong><br />
1988 DA <strong>Budget</strong> level 19,404 2,772 2,772 2,772 2,772 2,772 2,772 2,772<br />
Additional <strong>Budget</strong> 122,000 20,000 17,000 17,000 17,000 17,000 17,000 17,000<br />
2% of GVA for research<br />
<strong>and</strong> extension (b) 40,034 6,928 7,250 7,734 8,740 9,382<br />
Total Prescribed <strong>Budget</strong> 181,438 22,772 19,772 26,700 27,022 27,506 28,512 29,154<br />
<strong>Budget</strong> Excess/(Shortfall) -61,349 -8,710 2,780 -11,752 -3,341 -8,087 -16,262 -15,977<br />
% Approp to Prescribed 66.19% 61.75% 114.06% 55.99% 87.64% 70.60% 42.96% 45.20%<br />
% Excess/ (Shortfall) -33.81% -38.25% 14.06% -44.01% -12.36% -29.40% -57.04% -54.80%<br />
Source of Basic Data: DBM <strong>and</strong> NCSB<br />
(a) Includes new appropriations under the Agrarian Reform Fund, Department of Agriculture, SUCs, DOST,<br />
<strong>Budget</strong>ary support to GOCCs <strong>and</strong> Allocation to LGUs attributable to AFMA implementation.<br />
(b) GVA Excluding Forestry in Current Prices. Source of data, NCSB<br />
4.6 - 12
Table 4.6.7. Actual Obligations vs. AFMA Prescribed <strong>Budget</strong>, 1999 - 2005<br />
(In Million Pesos)<br />
PARTICULARS TOTAL 1999 2000 2001 2002 2003 2004 2005<br />
Expenditures, Obligation Basis<br />
Department of Agriculture 38,405 16,302 3,407 3,796 4,963 3,733 3,088 3,116<br />
AFMA 77,963 - 16,783 15,872 13,378 10,064 10,429 11,437<br />
Total DA+AFMA 116,368 16,302 20,190 19,668 18,341 13,797 13,517 14,553<br />
AFMA Prescribed <strong>Budget</strong><br />
1988 DA <strong>Budget</strong> level 19,404 2,772 2,772 2,772 2,772 2,772 2,772 2,772<br />
Additional <strong>Budget</strong> 122,000 20,000 17,000 17,000 17,000 17,000 17,000 17,000<br />
2% of GVA¹ for research &<br />
Extension 40,034 6,928 7,250 7,734 8,740 9,382<br />
Total Prescribed <strong>Budget</strong> 181,438 22,772 19,772 26,700 27,022 27,506 28,512 29,154<br />
<strong>Budget</strong> Excess/(Shortfall) -65,070 -6,470 418 -7,032 -8,681 -13,709 -14,995 -14,601<br />
% Obligations to Prescribed <strong>Budget</strong> 64.14% 71.59% 102.11% 73.66% 67.87% 50.16% 47.41% 49.92%<br />
% Excess/ (Shortfall) -35.86% -28.41% 2.11% -26.34% -32.13% -49.84% -52.59% -50.08%<br />
Source of Basic Data: DBM <strong>and</strong> NCSB<br />
1 1998-2003 GVA for Agriculture Excluding Forestry at Current Prices.<br />
4.6 - 13
Table 4.6.8. New Appropriations vs. Obligations, 1999-2005<br />
(In Million Pesos)<br />
PARTICULARS TOTAL 1999 2000 2001 2002 2003 2004 2005<br />
New<br />
1 1<br />
1 2 1 1 13,<br />
Appropriations 20,089 4,062 22,552 4,948 3,681 9,419 2,250 177<br />
116,36 16,30 20,19 19,66<br />
13,51 14,55<br />
Obligations<br />
Excess /<br />
8 2 0 8 18,341 13,797 7 3<br />
(Shortage) 3,721 -2,240 2,362 -4,720 5,340 5,622 -1,267 -1,376<br />
% Utilization 96.90% 115.93% 89.53% 131.58% 77.45% 71.05% 110.34% 110.44%<br />
% Excess /<br />
(Shortage) 3.10% -15.93% 10.47% -31.58% 22.55% 28.95% -10.34% -10.44%<br />
Source of Basic Data: DBM <strong>and</strong> NCSB<br />
Fund Distribution: DACO <strong>and</strong> DARFUs<br />
4.6.30 In terms of geographic distribution of funds, DACO remained in control of<br />
total funds with at least 80% of total allocated to nationwide programs <strong>and</strong> Central<br />
Office operations. Only about 20% went to the regions of which Regions 3 <strong>and</strong> 8<br />
received the highest amount of funds with a total of a little over PhP4 billion each<br />
over the last 7 years. ARMM received the least followed by Region 1 at PhP271<br />
million <strong>and</strong> PhP664.11 million, respectively for the same period as shown in Table<br />
4.6.9.<br />
4.6.31 In one of its reports, the DA pointed out that “majority of the releases to<br />
DARFUs, in the form of ASA (Advise of Sub-allotment), are unfunded (no cash)”. 5<br />
The latter reported of difficulties encountered requesting for cash releases from<br />
the DACO to cover the ASAs. Allegations of favoritisms to downright<br />
incompetence within DACO were aired. On the other h<strong>and</strong>, information from the<br />
DBM showed that cash releases to a national agency are done automatically if<br />
<strong>and</strong> when the latter’s cash balances with the L<strong>and</strong> Bank of the Philippines (LBP)<br />
fall below the set minimum levels. The DBM has direct online access to LBP’s real<br />
time records of transactions with national government agencies that enables it to<br />
closely monitor the government’s daily cash balances. As a result, no cash<br />
releases are made to agencies with outst<strong>and</strong>ing cash balances more than the set<br />
minimum.<br />
5 DA Planning Service, “Review of the Agriculture <strong>and</strong> Fisheries Modernization Plan, 2001-2004<br />
draft report”. 2005<br />
4.6 - 14
Table 4.6.9. DA <strong>and</strong> AFMA Expenditures <strong>Budget</strong>, 1999 – 2005 (In Million<br />
Pesos)<br />
Department of Agriculture AFMA<br />
Particulars<br />
Total<br />
1999-<br />
2005<br />
Growth<br />
Rate<br />
(%)<br />
% Share<br />
Total<br />
1999-<br />
2005<br />
Growth<br />
Rate<br />
(%)<br />
% Share<br />
Total 38,406.44 (0.64) 100 77,962.77 1.51 100.00<br />
Nationwide 21,238.25 (1.49) 55.30 21,002.49 0.64 26.94<br />
Central Office 5,167.79 443.97 13.46 46,683.83 2.88 59.88<br />
NCR - - - - - -<br />
CAR 570.49 0.48 1.49 246.70 9.40 0.32<br />
Region1 366.50 1.03 0.95 297.61 (4.94) 0.38<br />
Region 2 766.19 0.29 1.99 578.05 0.83 0.74<br />
Region 3 1,847.57 0.30 4.81 2,517.42 2.36 3.23<br />
Region 4 1,401.90 0.13 3.65 524.06 3.62 0.67<br />
Region 5 691.67 0.26 1.80 366.91 1.92 0.47<br />
Region 6 602.95 2.20 1.57 311.83 1.58 0.40<br />
Region 7 925.37 0.46 2.41 379.30 1.22 0.49<br />
Region 8 1,000.44 (0.62) 2.60 3,214.37 (0.49) 4.12<br />
Region 9 755.17 (0.06) 1.97 333.25 1.24 0.43<br />
Region 10 589.49 1.16 1.53 342.85 1.80 0.44<br />
Region 11 681.835 (0.45) 1.78 491.91 0.51 0.63<br />
Region 12 1,088.60 1.22 2.83 358.74 3.23 0.46<br />
CARAGA 461.00 1.55 1.20 313.47 1.88 0.40<br />
ARRM 271.22 - 0.71 - - -<br />
Source of Basic Data: DBM<br />
Compliance with AFMA Prescribed <strong>Budget</strong>ary Allocations<br />
4.6.32 An analysis of compliance with the budgetary allocations prescribed under<br />
the law was not possible. The DA <strong>and</strong> other AFMA implementing agencies’<br />
budget <strong>and</strong> accounting systems are not structured to generate the required<br />
monitoring reports <strong>and</strong> the corresponding level of details needed. Efforts at<br />
preparing the AFMA prescribed reports of fund allocation monitoring had been<br />
observed to be tedious <strong>and</strong> at the same time very subjective. Question on the<br />
integrity of available data was raised mainly due to the process of arbitrary<br />
attribution being employed in determining allocations of funds utilization.<br />
4.6 - 15
<strong>Finance</strong>-Related Factors Hindering AFMA Implementation<br />
4.6.33 The DA Planning Service conducted its own evaluation of the AFMA<br />
progress during the 2001 to 2004 period 6 . The report identified the following<br />
factors that slowed down program implementation: political intervention, delayed<br />
releases of cash allocation <strong>and</strong> institutional problems. These were consistent with<br />
the Consultant’s findings.<br />
4.6.34 Political interventions resulted in having a substantial portion of AFMA<br />
funds to be utilized for activities/projects that were not within the AFMP’s identified<br />
strategies <strong>and</strong> activities. On the other h<strong>and</strong>, the much delayed payment of<br />
calendar year 2003 accounts payable resulted in the DA’s tremendous problems<br />
with the seed production industry. Related to this were the experiences with<br />
unfunded sub-allotments to DARFUs discussed above.<br />
The institutional problems are as follows:<br />
6 Ibid.<br />
a. The bulk of AFMA budget for extension/training went to pay for<br />
incentive allowances of LGU agriculture technicians instead of<br />
going to actual production program interventions. For example,<br />
approximately PhP200 million under the GMA-Rice program were<br />
used to pay incentive allowances.<br />
b. The LGU counter-parting scheme did not materialize as expected.<br />
The planned cost-sharing with LGUs was not well accepted by<br />
majority of local chief executives (LCE) who remained heavily<br />
reliant on the DA as provider of funds. This despite the passage of<br />
the Local Government Code devolving the provision of extension<br />
services from the national government to the LGUs.<br />
c. In some DARFUs, good working relationships between <strong>and</strong> among<br />
DARFUs, LGU-provinces/municipalities did not exist. The<br />
devolution brought about by the passage of the Local Government<br />
Code presented problems to the DA as it can no longer fully tap the<br />
LGU agriculture staff to fully support DA program implementation.<br />
This became more evident in areas where the LCE had his/her own<br />
agenda, or even the lack of it, for agriculture or a different set of<br />
priorities in the use of the LGU resources. Also, some LGU<br />
extension workers lacked the commitment to implement national<br />
programs.<br />
d. Related to the above, the lack of LGU support in terms of traveling<br />
allowances, supplies <strong>and</strong> materials to its agriculture extension<br />
workers hindered the implementation/ monitoring of DA programs;<br />
<strong>and</strong>,<br />
e. The COA ruling that suspended the utilization by the DA of the seed<br />
collection under the DA-NFA Seed Subsidy Component of the GMA<br />
4.6 - 16
Rice program <strong>and</strong> the remittance of collections to the <strong>National</strong><br />
Treasury adversely affected the cash flow of DA <strong>and</strong> consequently<br />
caused tremendous delays in program implementation.<br />
4.6.35 Lastly, the lack of appreciation or underst<strong>and</strong>ing of the fact that AFMA<br />
implementation should be a concerted effort among the national government,<br />
LGUs, <strong>and</strong> the private sector (corporations <strong>and</strong> individual farmers) seemed to<br />
have lodged the financial burden of program implementation on the national<br />
government or the DA in particular. The LGUs active role in the agriculture sector<br />
modernization had been overshadowed by the DA’s initiatives <strong>and</strong> implementation<br />
of nationally-managed crop production programs.<br />
Proposed <strong>Budget</strong>ary Allocation by AFMA Components/Activities<br />
4.6.37 Participants in the consultation workshops conducted by the AFMA Review<br />
Team were clustered into major commodity groups. Each group was asked to<br />
prioritize the various components <strong>and</strong> correspondingly allocate the budget for<br />
AFMA to each of the component in accordance with the participants’ perceived<br />
needs <strong>and</strong> the apparent effects of these budgetary allocations in terms of<br />
increasing crop production <strong>and</strong> yield, improving the quality <strong>and</strong> quantity of<br />
produce, increasing incomes of stakeholders, generating more jobs <strong>and</strong> the<br />
overall modernization of the agriculture sector.<br />
Proposed Allocation by AFMA Component by Commodity<br />
4.6.39 As shown in Table 4.6.10, for all commodity groups, the overall results<br />
showed that provision of post harvest facilities was identified as the most<br />
important intervention, <strong>and</strong> as such, an average of 17.3% of the annual budget<br />
should be devoted to it. This was followed by credit assistance with an 11.3%<br />
allocation. Third priority was for irrigation with 10.7%. A close fourth was for the<br />
provision of other infrastructure including farm-to-market roads, foot bridges, cold<br />
storage, abattoirs, etc. It was given 10.2% share. The grains sector, however,<br />
particularly rice, identified irrigation as the most important intervention allocating<br />
almost one-fourth (24.6%) of the annual budget. All other commodity sectors, on<br />
the other h<strong>and</strong>, considered postharvest facilities particularly mechanical dryers,<br />
low-cost processing/treatment facilities (for HVCCs), etc., as vital in improving the<br />
quality of their produce.<br />
4.6 - 17
Table 4.6.10. Proposed <strong>Budget</strong> Allocation by AFMA Component <strong>and</strong> Major<br />
Commodity<br />
4.6 - 18
Commodity/<br />
AFMA<br />
Component<br />
Postharvest<br />
Facilities<br />
<strong>Budget</strong> Allocation (%)<br />
Grains Rice Corn HVCC<br />
Coconut/<br />
Abaca<br />
Livestoc<br />
k &<br />
Poultry<br />
Fisheries Total<br />
Overall<br />
Average<br />
14.5 14.8 19.4 15.2 18.6 18.3 17.4 103.7 17.28<br />
Proposed <strong>Budget</strong> Allocation<br />
by AFMA Component By<br />
Region<br />
4.6.36 At the regional<br />
perspective, provision of<br />
post harvest facilities<br />
likewise emerged as the<br />
most important support,<br />
allocating 16.9% of the<br />
annual budget, followed by<br />
the other infrastructure<br />
facilities (11.5%). Table<br />
4.6.11.<br />
Credit 10.8 7.6 7.3 9.5 19.0 11.9 12.5 67.9 11.32<br />
Irrigation 22.8 24.6 8.4 12.2 13.0 2.7 3.5 64.4 10.73<br />
Other<br />
Infrastructure<br />
Research &<br />
20.6 11.3 11.4 11.9 6.2 9.9 10.4 61.2 10.20<br />
Development 5.5 8.2 6.3 9.6 10.4 10.9 13.0 58.4 9.74<br />
Extension<br />
Services<br />
5.8 8.2 8.7 8.2 11.6 7.4 6.8 50.9 8.49<br />
Marketing 7.9 9.3 6.6 10.9 10.1 7.6 44.5 7.42<br />
Assistance<br />
Education 3.3 5.0 2.8 4.9 5.2 8.2 9.7 35.8 5.96<br />
Table 4.6.11. Proposed<br />
Regional <strong>Budget</strong><br />
Product<br />
Allocation by AFMA<br />
St<strong>and</strong>ardization 3.0 2.8 3.7 7.0 5.0 7.6 7.2 33.4 5.57 Component <strong>and</strong> Region<br />
Region/AFMA<br />
Information 3.0 3.7 3.0 6.6 4.4 <strong>Budget</strong> Allocation 7.2 (%) 6.3 31.2 5.20<br />
Component Support CAR R1 R2 R3 R4a R4b R5 R6 R7 R8 R9 R10 R11 R12 R13 ARM Total<br />
Postharvest Trade - 3.0 - 3.3 11.7 0.9 - 16.53.817.4 15.5 6.6 17.0 24.0 5.8 15.0 17.9 5.4 17.8 25.8 16.5 4.30 13.0 12.6 20.3 16.9<br />
Facilities Other Services 1.1 21.4 22.5 3.76<br />
Other Total<br />
Infrastructure<br />
100.0 - - 100.0 7.6 100.0 - 17.4 100.09.8 11.9 100.0 11.6 100.0 8.8 7.0 100.0 10.3 600.0 17.3 8.3100.00 7.2 19.0 12.9 11.5<br />
Irrigation - - 9.6 - 9.6 10.0 7.5 7.4 5.4 18.0 9.6 11.3 15.3 9.3 10.0 16.0 10.3<br />
Credit - - 6.4 - 3.2 12.5 7.6 11.8 14.0 15.0 7.9 8.5 17.0 18.0 6.6 9.4 10.2<br />
Research &<br />
Development<br />
- - 9.5 - 8.2 10.7 11.9 9.8 10.4 10.0 9.7 9.3 7.1 9.7 10.5 6.7 9.5<br />
Marketing<br />
Assistance<br />
- - 8.4 - 12.2 15.2 4.1 7.6 7.0 5.5 10.5 7.3 14.0 8.8 6.3 5.7 8.9<br />
4.6 - 19
Region/AFMA<br />
<strong>Budget</strong> Allocation (%)<br />
Component CAR R1 R2 R3 R4a R4b R5 R6 R7 R8 R9 R10 R11 R12 R13 ARM Total<br />
Postharvest<br />
Facilities<br />
- - 11.7 - 16.5 17.4 15.5 17.0 24.0 15.0 17.9 17.8 16.5 13.0 12.6 20.3 16.9<br />
Extension<br />
Services<br />
- - 11.3 - 5.6 8.1 10.2 10.2 6.0 10.5 5.3 6.3 5.1 7.7 7.7 6.7 7.7<br />
Education - - 3.0 - 8.0 3.9 5.4 6.0 7.6 6.5 7.2 4.0 4.3 10.3 11.9 5.6 6.1<br />
Product<br />
St<strong>and</strong>ardization<br />
- - 4.0 - 6.3 4.4 5.2 7.4 6.4 4.5 6.4 6.3 4.3 5.0 5.8 6.9 5.7<br />
Information<br />
Support<br />
- - 2.9 - 6.3 4.9 5.6 5.8 3.0 5.0 9.2 4.8 5.1 5.3 5.8 5.7 5.3<br />
Trade - - 2.3 - 4.7 2.8 3.8 4.8 3.4 3.0 3.9 7.5 3.1 5.7 3.8 4.2 4.0<br />
Other Services - - 23.5 - 2.0 0.3 11.3 0.6 4.0 - 2.4 - - - - - 4.0<br />
Total - - 100 - 100 100 100 100 100 100 100 100 100 100 100 100 100<br />
4.6 - 20
Focus Area by AFMA Component By Commodity<br />
4.6.37 It then follows that majority of the commodity sector selected post harvest<br />
facilities as their priority focus area specially the corn, coconut/abaca, livestock<br />
<strong>and</strong> poultry <strong>and</strong> fisheries sectors. Consequently, only the rice sector ranked<br />
irrigation as its main priority area, while the grains sector in general, identified<br />
marketing assistance as the primary focus area. Table 4.6.12.<br />
Table 4.6.12. Priority Ranking of Focus Areas by AFMA Component <strong>and</strong><br />
Major Commodity<br />
Commodity/AFMA<br />
Component<br />
Recommendations<br />
Ranking of Focus Areas<br />
Grains Rice Corn HVCC<br />
Coconut/<br />
Abaca<br />
Livestock &<br />
Poultry Fisheries<br />
DA to Define its Strategic Priorities Consistent with Its Core Functions Under the<br />
AFMA<br />
4.6.40 For a more efficient use of its limited resources for the delivery of effective<br />
support services <strong>and</strong> other interventions, the DA needs to clearly define its<br />
strategic priorities <strong>and</strong> make them consistent with its core functions under the<br />
AFMA. It should be able to direct its resources in the performance of its m<strong>and</strong>ated<br />
functions through a transparent financial budget. The ongoing <strong>and</strong> about to be<br />
concluded rationalization program of the national government is a major enabling<br />
milestone for the DA to fine tune the agriculture bureaucracy to meet the<br />
challenges posed by the AFMA towards a modernized <strong>and</strong> dynamic agriculture<br />
sector.<br />
Overall<br />
Ranking<br />
Postharvest Facilities 3 5 1 4 1 1 1 1<br />
Credit 4 3 3 3 2 4 3 2<br />
Irrigation 3 1 2 9 5 3<br />
Marketing Assistance 1 4 6 5 2 7 4 4<br />
Education 2 4 1 5 6 5<br />
Extension 1 2 7 6 3 6 7 6<br />
Other Infrastructure 7 5 9 2 8 7<br />
Research &<br />
Development 5 6 8 2 3 8 2 8<br />
Information Support 2 7 3 9 9<br />
Product<br />
St<strong>and</strong>ardization 8 9 8 10 10 10<br />
Trade 9 10 9 10 11<br />
Other Services 4 12<br />
4.6 - 21
DA to Implement <strong>Budget</strong> Reform Measures<br />
4.6.41 DA has started instituting measures in accordance with the principles of<br />
public expenditures management reforms espoused by the DBM. New budget<br />
formats that will enable the DA to structure its budgetary allocation in accordance<br />
with its Major Final Outputs (MFO) as the basic unit of performance <strong>and</strong><br />
budgetary allocation had been started. These new formats should facilitate the<br />
reconciliation of authorized expenditures with their MFOs, <strong>and</strong> consequently their<br />
priority areas for spending. Table 4.6.12 shows the DA’s MFOs. The performance<br />
indicators identified are: 1) increase in the volume, quality <strong>and</strong> value of agriculture<br />
<strong>and</strong> fisheries production for domestic consumption <strong>and</strong> for exports; 2) reduction in<br />
post-harvest losses; 3) increase in the number/types <strong>and</strong> quality of processed<br />
agricultural <strong>and</strong> fishery products; 4) increase in the number of international trading<br />
partners in agriculture <strong>and</strong> fishery products; 5) increase in the number of<br />
sustainable agriculture <strong>and</strong> fisheries firms engaged in domestic production,<br />
processing, marketing <strong>and</strong> export activities; 6) increase in <strong>and</strong> wider level of<br />
entrepreneurship among farmers <strong>and</strong> fisherfolks in the area; 7) increase in the<br />
number of farms engaged in diversified farming; <strong>and</strong> 8) reduced use of agrochemicals<br />
that are harmful to health <strong>and</strong> the environment.<br />
Table 4.6.13. Major Final Outputs of the Department of Agriculture<br />
Major Final Outputs AFMA-M<strong>and</strong>ated Functions<br />
A. Agriculture <strong>and</strong> fishery support<br />
services for increased productivity <strong>and</strong><br />
income<br />
B. Dynamic, client-responsive <strong>and</strong><br />
rationalized applied <strong>and</strong> basic<br />
research <strong>and</strong> development<br />
C. Dynamic, client-responsive <strong>and</strong><br />
rationalized applied <strong>and</strong> basic<br />
research <strong>and</strong> development<br />
D. Comprehensive Regulatory<br />
Services<br />
E. Plans, policy, programs <strong>and</strong><br />
product formulation, coordination,<br />
advocacy, monitoring <strong>and</strong><br />
evaluation<br />
F. Human Resources Development<br />
G. Program Management<br />
1. Production Support Services<br />
2. Market Development Services<br />
3. Credit Facilitation Services<br />
4. Irrigation Development Services<br />
5. Other Infrastructure <strong>and</strong> Post-<br />
Harvest Development Services<br />
6. Extension Support, Education <strong>and</strong><br />
Training Services<br />
7. Research <strong>and</strong> Development Services<br />
8. Regulatory Services<br />
9. Information / Data Base System<br />
10. Policy Formulation, Planning <strong>and</strong><br />
Advocacy Services<br />
4.6 - 22
DA to Institutionalize Agency-wide Reforms<br />
4.3.42 The implementation of the World Bank-assisted Diversified Farm Income<br />
<strong>and</strong> Market Development will provide the much needed boost to the<br />
institutionalization of reforms. This project will implement five interlinked<br />
components designed to underpin an agency-wide change <strong>and</strong> development<br />
process. The first three components have to do with investing in assets that are<br />
needed to improve delivery of essential public services in support of competitive<br />
business operations <strong>and</strong> strategic decision-making of the private sector, namely<br />
market development, regulatory <strong>and</strong> research <strong>and</strong> development services. The<br />
fourth component pertains to the planning <strong>and</strong> budgeting system of the agency<br />
<strong>and</strong> innovations that are needed to ensure that the allocation of budgetary<br />
resources supports the desire of the DA to enhance its effectiveness in the<br />
delivery of these services. The fifth component deals with rural infrastructure<br />
investments <strong>and</strong> technical support for DA’s clients to enhance market<br />
competitiveness of farmer groups in selected focus areas. 7<br />
<strong>Budget</strong> Allocation Priorities to Take Into Account Results of Regional<br />
Consultations<br />
4.6.43 The priorities defined <strong>and</strong> shown above should be given serious<br />
consideration in the decisions on future resources allocations.<br />
DA to Enjoin More Active Participation By the Private Sector <strong>and</strong> LGUs<br />
4.6.44 As the DARFU Executive Director Joel Rudinas of Region 10 so aptly put<br />
during the regional workshop - “It is true that the additional resources did not<br />
come as envisioned, but agriculture <strong>and</strong> fishery modernization is not just driven by<br />
public investment, but largely by private sector investment”. Therefore, the DA’s<br />
major role should be to encourage private sector investments that would<br />
dynamically induce agricultural development <strong>and</strong> modernization. It should<br />
concentrate on providing a more conducive policy environment for the private<br />
sector initiatives to thrive. Also, concentration on major infrastructure<br />
development, outside the ambit <strong>and</strong> financial reach of the private sector, would<br />
result in improved symbiotic relationship between government <strong>and</strong> private sector.<br />
4.6.45 Relationships with the LGUs should be fostered by more consultations<br />
between the DARFUs <strong>and</strong> the LCEs <strong>and</strong> other LGU staff. To the extent possible,<br />
the latter should be involved starting the planning phase of any national programs<br />
to be implemented within the LGU concerned. Detailed terms of reference for<br />
program/project implementations with particular focus on the financial<br />
arrangements <strong>and</strong> cost-sharing schemes should be clarified with the LCE <strong>and</strong><br />
his/her staff <strong>and</strong> commitments made prior to any implementation of programs or<br />
projects in the locality.<br />
7 DA, Diversified Farm Income <strong>and</strong> Market Development Project TE Team Report. May 2004<br />
4.6 - 23
DA to Reconcile its Records with the DBM<br />
4.6.46 In addition, it is important that efforts be made by the DA to reconcile its<br />
records with that of the DBM. This should include all the other records pertaining<br />
to fund attributions to the AFMA special funds. The effect of not using the same<br />
set of data when requesting (on the part of the DA) <strong>and</strong> analyzing <strong>and</strong> deciding on<br />
the budget approvals <strong>and</strong> fund releases (on the part of the DBM) cannot be<br />
overemphasized.<br />
4.6 - 24