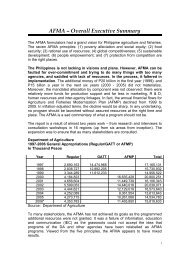
5. Key Commodity Performance - National Agricultural and Fishery ...
5. Key Commodity Performance - National Agricultural and Fishery ...
5. Key Commodity Performance - National Agricultural and Fishery ...

You also want an ePaper? Increase the reach of your titles
YUMPU automatically turns print PDFs into web optimized ePapers that Google loves.
<strong>5.</strong> <strong>Key</strong> <strong>Commodity</strong> <strong>Performance</strong><br />
This chapter analyzes the performance <strong>and</strong> competitiveness of the selected key<br />
industries from 1993-1998 (pre-AFMA) <strong>and</strong> 1999-2004 (post AFMA). These<br />
industries are as follows:<br />
• Rice;<br />
• Corn;<br />
• Coconut;<br />
• Sugarcane;<br />
• Banana;<br />
• Mango;<br />
• Onion;<br />
• Swine;<br />
• Broiler;<br />
• Chicken egg;<br />
• Bangus;<br />
• Tilapia;<br />
• Tuna; <strong>and</strong><br />
• Seaweeds.<br />
The specific areas discussed were production volume, area harvested <strong>and</strong> yield,<br />
trade performance, benchmarking with relevant Asian countries (e.g. China,<br />
Indonesia, Malaysia, Thail<strong>and</strong>, Vietnam), competitiveness analysis, <strong>and</strong><br />
strengths, weaknesses, opportunities <strong>and</strong> threats (SWOT) analysis.<br />
5- 1
<strong>5.</strong>1 RICE<br />
Production, Area, <strong>and</strong> Yield<br />
<strong>5.</strong>1.1 Palay production has been increasing over the last twelve years averaging<br />
4.9% growth. However, the severest El Niño that hit the country in 1998 caused<br />
production to decline by 24% although recovery was made in the following years<br />
with sustained growth. Growth over the pre-AFMA years (1993-1997) without the<br />
effect of the severe El Niño averaged 4.7% which was slightly above the growth<br />
during the post AFMA years (1999-2004) at 4.2%.<br />
<strong>5.</strong>1.2 Area harvested over the pre-AFMA years grew by 4.1% annually<br />
excluding the year 1998 when it dropped by 17.5%. During the post AFMA years,<br />
area hardly moved at 0.6% growth <strong>and</strong> stood at four million hectares over the six<br />
year period.<br />
Figure <strong>5.</strong>1.1 PALAY: Production <strong>and</strong> Area harvested, 1993-2004<br />
Production ('M tons)<br />
16.00<br />
14.00<br />
12.00<br />
10.00<br />
8.00<br />
6.00<br />
4.00<br />
2.00<br />
Source: BAS<br />
-<br />
Volume Area<br />
93 94 95 96 97 98 99 00 01 02 03 04<br />
<strong>5.</strong>1.3 Considering 1993 as a reference year, it would be noted that succeeding<br />
productions were all above the base year at an increasing rate except for 1998<br />
due to the severe El Niño phenomenon.<br />
Figure <strong>5.</strong>1.2 RICE: Production Index, 1993-2004<br />
Production index<br />
(1993=100)<br />
180<br />
160<br />
140<br />
120<br />
100<br />
80<br />
60<br />
40<br />
20<br />
-<br />
<strong>5.</strong>00<br />
4.00<br />
3.00<br />
2.00<br />
1.00<br />
-<br />
Area harvested ('M<br />
ha)<br />
93 94 95 96 97 98 99 00 01 02 03 04<br />
Source of basic data: BAS<br />
5- 2
<strong>5.</strong>1.4 In terms of regional distribution, five regions account for almost 60% of<br />
total production. The highest contributor to rice production has been Central<br />
Luzon with total share of 16-18% over the years. Western Visayas <strong>and</strong> Cagayan<br />
Valley occupy the second <strong>and</strong> third positions with almost the same share while<br />
the Ilocos is stable in the fourth spot. Bicol has been moved out of the fifth spot<br />
by Soccsksargen. There has been no considerable change in production<br />
distribution among the regions in the pre <strong>and</strong> post AFMA years.<br />
Figure <strong>5.</strong>1.3 RICE: Regional Distribution of Production, 1993, 1998 <strong>and</strong> 2004<br />
Others<br />
41%<br />
1993<br />
Total: 9,434,208 tons<br />
Bicol<br />
7%<br />
Source of basic data: BAS<br />
Ilocos<br />
9%<br />
Others<br />
40%<br />
Central<br />
Luzon<br />
18%<br />
Cagay an<br />
Valley<br />
9%<br />
Western<br />
Visay as<br />
16%<br />
Others<br />
41%<br />
2004<br />
Total: 14,496,784 tons<br />
Soccsk<br />
sargen<br />
8%<br />
Ilocos<br />
9%<br />
Central<br />
Luzon<br />
17%<br />
1998<br />
Total: 8,554,824 tons<br />
Soccsk<br />
sargen<br />
8%<br />
Cagay an<br />
Valley<br />
13%<br />
Western<br />
Visay as<br />
13%<br />
Ilocos<br />
10%<br />
Central<br />
Luzon<br />
16%<br />
Cagay an<br />
Western<br />
Visay as<br />
<strong>5.</strong>1.5 Production growth during the post AFMA years has been largely due to<br />
the sustained growth of yield averaging 3.6% during the period compared to the<br />
0.5% growth from 1993-1997. The post AFMA years were characterized by the<br />
intensified campaign on the use of hybrid <strong>and</strong> inbred seeds.<br />
12%<br />
Valley<br />
13%<br />
5- 3
Figure <strong>5.</strong>1.4 RICE: Average Yield, 1993-2004<br />
Yield (ton/ha)<br />
4.00<br />
3.50<br />
3.00<br />
2.50<br />
2.00<br />
1.50<br />
1.00<br />
0.50<br />
-<br />
Source: BAS<br />
Trade<br />
93 94 95 96 97 98 99 00 01 02 03 04<br />
<strong>5.</strong>1.6 The Philippines is still a net importer of rice despite the m<strong>and</strong>ate of AFMA<br />
for self-sufficiency. There was minimal import in 1993-1995 which shot up in<br />
1996 likely caused by the 1995 El Niño phenomenon. Imports peaked in 1998 to<br />
two million tons as a result of the severe El Niño <strong>and</strong> again reached over one<br />
million tons in 2002. Rice imports during the pre-AFMA period averaged<br />
690,0000 tons which grew to an average 840,000 tons from 1999-2004. Total<br />
import expenditure amounted to $1.27 billion <strong>and</strong> $1.13 billion during the pre-<br />
AFMA <strong>and</strong> post-AFMA period, respectively. It is expected that total imports for<br />
2005 will reach 1.6 million tons.<br />
<strong>5.</strong>1.7 Comparing the volume indices, it can be seen that there have not been<br />
enough spikes in production to abate the seeming periodic surges in imports<br />
following the occurrence of an extreme weather disturbance such as the El Niño.<br />
Figure <strong>5.</strong>1.5 RICE: Production <strong>and</strong> Import Volume Index, 1993-2004<br />
Volume Index<br />
(1993=100)<br />
1,200<br />
1,000<br />
800<br />
600<br />
400<br />
200<br />
-<br />
Production<br />
Import<br />
93 94 95 96 97 98 99 00 01 02 03 04<br />
Source of basic data: BAS <strong>and</strong> NSO<br />
5- 4
Benchmarking<br />
<strong>5.</strong>1.8 Benchmarking yield levels among selected Asian countries indicated that<br />
the Philippines remains to be far behind China, Vietnam, <strong>and</strong> Indonesia although<br />
it has overtaken Malaysia. Philippine yield performance from 1993-1998 was<br />
lowest at negative 1.2% but it topped yield growth from 1999-2004 with 4.5%<br />
followed only by Vietnam. The growth was probably driven by the strong push for<br />
hybrid rice commercialization.<br />
Table <strong>5.</strong>1.1. RICE: Comparative Yields of Selected Asian Countries, 1993,<br />
1998 <strong>and</strong> 2004<br />
Country Yield (ton/ha)<br />
1993 1998 2004<br />
China <strong>5.</strong>85 6.35 6.31<br />
India 2.83 2.88 3.03<br />
Indonesia 4.38 4.20 4.54<br />
Malaysia 3.03 2.88 3.25<br />
Philippines 2.87 2.70 3.51<br />
Thail<strong>and</strong> 2.17 2.47 2.59<br />
Viet Nam 3.48 3.96 4.82<br />
Source of basic data: FAO<br />
<strong>5.</strong>1.9 In terms of producer prices, the Philippines came out to be the most<br />
expensive producer of rice among selected Asian countries by a relatively wide<br />
margin. The trend has not changed with the coming of AFMA although there was<br />
a significant decrease in prices in 2002 for all countries except Indonesia.<br />
Table <strong>5.</strong>1.2. RICE: Comparative Producer Prices of Selected Asian<br />
Countries, 1993, 1998 <strong>and</strong> 2002<br />
Country Price ($/ton)<br />
1993 1998 2002<br />
China 149.43 16<strong>5.</strong>00 140.87<br />
India 141.38 119.73 116.09<br />
Indonesia 147.28 93.86 132.47<br />
Philippines 199.12 207.48 170.92<br />
Thail<strong>and</strong> 126.97 160.28 103.00<br />
Source of basic data: FAO <strong>and</strong> IFS<br />
Competitiveness analysis<br />
The discussion on competitiveness draws heavily on the study undertaken by the<br />
UA&P Foundation on Global Competitiveness <strong>and</strong> Benchmarking (2000).<br />
<strong>5.</strong>1.10 Rice production has been for domestic consumption over the past two<br />
decades. The export parity/domestic price ratios were generally less than one at<br />
exchange rates between P3<strong>5.</strong>00 <strong>and</strong> P40.00 per dollar implying that rice<br />
5- 5
provincial domestic prices were not competitive with the rice export parity price.<br />
This price uncompetitiveness could be due to the relatively high per unit cost of<br />
production across the rice production technologies <strong>and</strong> the long distances<br />
between the producing provinces to the Manila wholesale market. (UA&P<br />
Foundation, 2000)<br />
<strong>5.</strong>1.11 The analysis of the import parity/domestic price comparisons showed that<br />
domestic wholesale prices of rice across four major rice producing provinces<br />
were competitive with price of rice imports. The price ratios were all greater than<br />
one at different exchange rates (P35, P40, <strong>and</strong> P45) implying price<br />
competitiveness. The results showed further that as the exchange rate increases,<br />
the more domestic rice prices become competitive. (UA&P Foundation, 2000)<br />
<strong>5.</strong>1.12 In terms of cost, the analysis showed that in general, the Philippines had<br />
no competitive advantage in rice export except marginal competitiveness for high<br />
technologies at the exchange rate of P4<strong>5.</strong> (UA&P Foundation, 2000)<br />
<strong>5.</strong>1.13 Results of the estimation showed that at different exchange rates <strong>and</strong> at<br />
different production systems showed that the Philippines is generally an efficient<br />
producer of rice to substitute for imports. The RCRs, the indicators of global<br />
competitiveness were generally less than one, implying competitive advantage.<br />
(UA&P Foundation, 2000)<br />
SWOT Analysis<br />
<strong>5.</strong>1.14 The strength-weakness-opportunity-threat (SWOT) analysis of an industry<br />
will provide an underst<strong>and</strong>ing as to its overall condition, problems besetting the<br />
industry <strong>and</strong> opportunities waiting to be tapped. The SWOT analysis is therefore<br />
a vital input to formulation of strategies <strong>and</strong> action programs that should be<br />
implemented to attain the goals of the industry.<br />
<strong>5.</strong>1.15 The strengths, weaknesses, opportunities <strong>and</strong> threats of the rice industry<br />
were identified across the various segment of the supply chain.<br />
<strong>5.</strong>1.16 The SWOT analysis suggests that a holistic approach is necessary where<br />
the actions of the different sectors converge to move the rice industry towards a<br />
sustainable growth. Farmers must be willing to adapt to the recommended inputs<br />
<strong>and</strong> mechanization. Grains businessmen must be willing to invest in modern<br />
facilities. The government must provide the public infrastructures in transport <strong>and</strong><br />
irrigation. It must provide the investment climate together with improved policies<br />
on credit, trade, <strong>and</strong> distribution (Table <strong>5.</strong>1.3).<br />
<strong>5.</strong>1.17 The rice industry is endowed with resources that are highly regarded as<br />
modern <strong>and</strong> improved technologies. One of the strengths of the industry is the<br />
availability of the high-yielding cultivars. Pest <strong>and</strong> disease resistant seeds <strong>and</strong><br />
adverse environment-tolerant rice varieties are available in the country. However,<br />
5- 6
there is a problem with distribution of these HYV seeds. The instability of the cost<br />
of fossil fuel-based inputs adds to the burden of the farmer.<br />
<strong>5.</strong>1.18 An increase in the yield of the farmers can also be attributed to fertilizer<br />
<strong>and</strong> pesticide use. Inputs such as these are available through local suppliers.<br />
However, farmers complain of high price quotation to such inputs. High prices of<br />
these inputs can be partly due to monopoly that exists in the inputs sub-sector.<br />
An opportunity can be seen in the development of the biological/organic fertilizer<br />
sources due to the high dem<strong>and</strong> for organic rice abroad.<br />
<strong>5.</strong>1.19 Credit allows rice farmers to exp<strong>and</strong> <strong>and</strong> continue their production. Thus,<br />
presence of informal creditors makes it easy for farmers to adjust to farming<br />
systems that can increase their yields. But high transaction cost for the loan<br />
lowers the net income of the farmers. The industry also identified the limited<br />
accessibility of the farmers to formal loan sources. This can be due to<br />
complicated requirements when applying for loans, high interest rates offered by<br />
the banking institutions <strong>and</strong> low repayment performance of the borrower.<br />
<strong>5.</strong>1.20 The Philippine rice industry is backed-up by the extensive R&D program<br />
particularly from those of the academe <strong>and</strong> the government research agencies.<br />
However, practices such as low utilization of certified seeds <strong>and</strong> low fertilizer<br />
usage decrease the yield level that can be realized by the farmer. The local rice<br />
farming shows a heavy dependence on inorganic fertilizers <strong>and</strong> pesticides. Low<br />
farm mechanization is prevalent in the farm areas because of the high<br />
investment costs for this technology. A typical rice farm shows lower yield but<br />
studies conducted for the industry shows otherwise. Thus, adoption of the<br />
recommendations posted by the R&D institutions can help the farmers increase<br />
its annual yield.<br />
<strong>5.</strong>1.21 Natural resources such as l<strong>and</strong> <strong>and</strong> water, shows favorable condition for<br />
rice farming. We have a high precipitation nationwide that gives farmers a<br />
potential for high cropping intensity. However, only 44% of potential irrigable<br />
areas are covered by irrigation services. Rapid l<strong>and</strong> conversion, declining quality<br />
of l<strong>and</strong> <strong>and</strong> water due to salinization, declining water supply <strong>and</strong> irrigation<br />
investments are identified as threats to rice production.<br />
<strong>5.</strong>1.22 Rice sector is characterized by the availability of highly capable human<br />
resource. These human resources are recognized as industrious farmers. An<br />
intensive training in integrated crop management, balanced fertilization strategy<br />
<strong>and</strong> crop diversification is necessary to increase yield, income <strong>and</strong> consequently<br />
the farmer’s expertise. On the other h<strong>and</strong>, urban migration <strong>and</strong> aging farm labor<br />
decreases the labor force available for the rice sector.<br />
<strong>5.</strong>1.23 Processing subsystem is in charge of changing the form of the product.<br />
The palay is processed to become milled rice, rice-based products or other rice<br />
by-products as desired by the consumer. The processing subsystem offers<br />
5- 7
strong technical competence on processing technologies. However, postharvest<br />
facilities are lacking during the main season. Processors complain of high cost of<br />
mechanical drying. Facilities available for them are either outmoded or poorly<br />
managed. There are also inadequate processing facilities in the rural areas. The<br />
dem<strong>and</strong> for the postharvest facilities enhances the research <strong>and</strong> acquisition of<br />
the government <strong>and</strong> private sector of the modern postproduction technologies.<br />
These technologies increase the capacity of the postproduction manufacturing<br />
industry <strong>and</strong> after-sale services. The investment for processing technologies is<br />
needed because there is an increasing dem<strong>and</strong> for rice-based food products.<br />
<strong>5.</strong>1.24 One of the problems of the agricultural sector is the instability of supply of<br />
the commodity such as rice in a given time of the year. Thus, a facility like<br />
storage is needed to make rice available at any time. The rice sector is gifted<br />
with the availability of warehouse spaces. However, storage facilities are either<br />
not in good condition or located at displaced areas. Farmers should consider<br />
storage because of the seasonality in supply. Prices are high when the<br />
commodity is not in season. The industry should take into consideration the<br />
declining public investments in storage facilities.<br />
<strong>5.</strong>1.25 Established marketing channels characterize the marketing subsystem of<br />
the rice sector. However, presence of the numerous market intermediaries<br />
makes marketing <strong>and</strong> distribution perform inefficiently. There is an increase in the<br />
marketing costs as another middleman joins the system. High transport costs<br />
also add to the price paid by the consumers. Also, inadequate infrastructure<br />
increases the cost of the middleman. Although the marketing subsystem is<br />
confronted by quite a number of inefficiencies, there are still markets not totally<br />
exploited. Rice sector has a continually growing huge consumer base because it<br />
is the staple food for the Filipino. Dem<strong>and</strong> for rice will increase as population<br />
increases. The threats to marketing <strong>and</strong> distribution subsystem include the<br />
budgetary constraints of NFA limiting procurement to less than 10% of total<br />
marketed paddy, entry of cheaper imports <strong>and</strong> rice smuggling.<br />
<strong>5.</strong>1.26 The institution subsystem shows the rice sector having strong linkages<br />
<strong>and</strong> partnership with institutions focusing on rice researches such as PhilRice<br />
<strong>and</strong> Rice R&D Network, IRRI, UPLB, SCUs, NFA, <strong>and</strong> other private companies.<br />
These institutions extend consultations <strong>and</strong> services to the rice sector with the<br />
aim of increasing the yield per hectare <strong>and</strong> the income received by the farmers.<br />
However, the institution subsystem performs poorly in terms of governance. Rice<br />
programs are put off because of frequent turnover of DA leadership. There is<br />
also ineffective implementation of the national rice programs. Access of the rice<br />
sector to international donor agencies like the FAO <strong>and</strong> USAID make it possible<br />
for the government to continue research <strong>and</strong> development. An expansion of the<br />
market for the rice sector is also possible because of the country’s membership<br />
to international trade associations such as AFTA <strong>and</strong> WTO. Coordination among<br />
the national <strong>and</strong> local governments is imperative in the implementation of rice<br />
programs.<br />
5- 8
Table <strong>5.</strong>1.3. RICE INDUSTRY: SWOT Analysis<br />
STRENGTHS WEAKNESSES<br />
Inputs<br />
1. Availability of HYVs <strong>and</strong> modern<br />
technologies<br />
1. Limited distribution <strong>and</strong> access to HYV<br />
seeds<br />
2. Presence of input suppliers 2. High costs of inputs (hybrid seeds,<br />
fertilizers, pesticides)<br />
3. Presence of informal creditors 3. High transaction cost<br />
4. Slow irrigation development<br />
Farm Production<br />
4. Extensive R&D program <strong>5.</strong> Low utilization of certified seeds<br />
<strong>5.</strong> Adequate production technologies 6. Low fertilizer usage<br />
6. Wide adoption of modern varieties 7. Dependence on inorganic chemicals<br />
7. High precipitation nationwide 8. Low farm mechanization<br />
9. High production losses<br />
10. Poor maintenance of irrigation<br />
systems<br />
11. High production cost<br />
Processing<br />
8. Presence of mills 12. Low milling recovery<br />
9. Strong technical competence on 13. Lack of postharvest facilities during<br />
processing technologies<br />
main season<br />
10. Availability of warehouse space 14. Outmoded processing facilities<br />
1<strong>5.</strong> High cost of mechanical drying<br />
16. Lack of incentive for quality drying<br />
17. Inadequate farm level grains center<br />
18. Dilapidated warehouse facilities<br />
19. Presence of diverse grain types<br />
Marketing <strong>and</strong> Distribution<br />
11. Established marketing channels 20. Numerous market intermediaries<br />
21. High marketing cost<br />
22. High transaction cost (transport)<br />
23. Inadequate infrastructure (FMRs)<br />
Institutions<br />
12. Presence of institutions focused 24. No continuity of rice programs<br />
on rice both government <strong>and</strong> private (frequent change of DA leadership)<br />
13. Presence of national rice program 2<strong>5.</strong> Ineffective implementation of national<br />
rice program<br />
14. Presence of trained extension 26. Weak extension system due to<br />
workers <strong>and</strong> agricultural technicians devolution<br />
5- 9
OPPORTUNITIES THREATS<br />
1. Vitamin-enriched seeds 1. Spiraling cost of oil-based inputs<br />
2. Biotic <strong>and</strong> abiotic stress-tolerant<br />
varieties<br />
2. Monopolies of input sources<br />
3. Development of biological/organic<br />
fertilizers<br />
3. Limited access to formal loan sources<br />
4. Increasing yield levels 4. Pests <strong>and</strong> diseases<br />
<strong>5.</strong> Organic rice for export <strong>5.</strong> L<strong>and</strong> conversion<br />
6. Balanced fertilization strategy 6. Declining water supply<br />
7. Development of productivity- 7. Declining investment on irrigation<br />
enhancing technologies<br />
systems<br />
8. Crop diversification 8. Aging farm labor<br />
9. Availability of modern post- 9. Unregulated entry of imported rice <strong>and</strong><br />
production technologies<br />
rice-based products (smuggling)<br />
10. Growing consumer base 10. Low cost of imported rice<br />
11. Opportunities for grain quality 11. Low priority of LGUs to agriculture<br />
12. Presence of international donor 12. Lack of coordination between NG<br />
agencies<br />
Source: STRIVE <strong>and</strong> CFA-UA&P<br />
<strong>and</strong> LGU in implementing rice programs<br />
5- 10
<strong>5.</strong>2 CORN<br />
Production, Area, <strong>and</strong> Yield<br />
<strong>5.</strong>2.1 Corn production has been growing very slowly over the last twelve years<br />
averaging 1.5% growth. The severest El Niño in 1998 caused production to<br />
decline by 12% with no sustainable growth pattern in the following years. Growth<br />
over the pre-AFMA years (1993-1997) even without the effect of the severe El<br />
Niño averaged a negative 2.4% which was very much smaller than the growth<br />
during the post AFMA years (1999-2004) at 3.7%.<br />
<strong>5.</strong>2.2 Area harvested was on the decline for most of the years. It decreased<br />
during the pre-AFMA years by 3.4% annually excluding the year 1998 when it<br />
dropped by 13.6%. During the post AFMA years, area declined at a much lesser<br />
pace at 0.8% <strong>and</strong> averaged 2.5 million hectares over the six year period.<br />
Figure <strong>5.</strong>2.1 CORN: Production <strong>and</strong> Area harvested, 1993-2004<br />
Production ('M tons)<br />
6.00<br />
<strong>5.</strong>00<br />
4.00<br />
3.00<br />
2.00<br />
1.00<br />
Source: BAS<br />
-<br />
Volume Area<br />
93 94 95 96 97 98 99 00 01 02 03 04<br />
<strong>5.</strong>2.3 <strong>Performance</strong> has not been encouraging based on production indices.<br />
Corn production indices have been below the 1993 level for all years except<br />
2004. The pre-AFMA years exhibited lower indices whereas improvement was<br />
manifested in the post-AFMA period. There is need to sustain growth as in 2004.<br />
3.50<br />
3.00<br />
2.50<br />
2.00<br />
1.50<br />
1.00<br />
0.50<br />
-<br />
Area harvested ('M<br />
ha)<br />
Figure <strong>5.</strong>2.2 CORN: Production Index, 1993-2004<br />
Production index<br />
(1993=100)<br />
120<br />
100<br />
-<br />
80<br />
60<br />
40<br />
20<br />
93 94 95 96 97 98 99 00 01 02 03 04<br />
Source of basic data: BAS<br />
5- 11
<strong>5.</strong>2.4 The top five corn producing regions account for 75-80% of total<br />
production. The highest contributor to production has been changing over the<br />
years: Soccsksargen (38%) in 1993, Northern Mindanao (22%) in 1998, <strong>and</strong><br />
Cagayan Valley (22%) in 2004. Cagayan Valley considerably increased its share<br />
of production from only 9% in 1993 to 22% in 2004 while Soccsksargen halved<br />
its share from 38% to 19% in the same period. Northern Mindanao, ARMM <strong>and</strong><br />
Davao have generally maintained their production share.<br />
Figure <strong>5.</strong>2.3 CORN: Regional Distribution of Production, 1993, 1998 <strong>and</strong><br />
2004<br />
Dav ao<br />
Region<br />
5%<br />
Cagay an<br />
Valley<br />
9%<br />
1993<br />
Total: 4,797,977 tons<br />
Others<br />
21%<br />
ARMM<br />
10%<br />
Source of basic data: BAS<br />
Northern<br />
Mindanao<br />
Dav ao<br />
Region<br />
5%<br />
17%<br />
Others<br />
25%<br />
ARMM<br />
12%<br />
Soccsk<br />
sargen<br />
38%<br />
Ilocos<br />
Others<br />
25%<br />
6%<br />
ARMM<br />
12%<br />
2004<br />
Total: 5,413,386 tons<br />
Northern<br />
Mindanao<br />
17%<br />
Cagay an<br />
Valley<br />
22%<br />
1998<br />
Total: 3,823,184 tons<br />
Soccsk<br />
Cagay an<br />
Valley<br />
15%<br />
Northern<br />
Mindanao<br />
22%<br />
Soccsk<br />
<strong>5.</strong>2.5 During the post AFMA years, production growth was sustained with<br />
increased yield growth averaging 4.4% as against the 1.1% growth from 1993-<br />
1997. However, these yield growths were unable to offset the reductions in area<br />
harvested to greatly influence production levels. Corn yields have been very low<br />
throughout the years thus the need to intensify the use of hybrid <strong>and</strong> open<br />
pollinated varieties.<br />
sargen<br />
19%<br />
sargen<br />
20%<br />
5- 12
Figure <strong>5.</strong>2.4 CORN: Average Yield, 1993-2004<br />
Yield (ton/ha)<br />
2.50<br />
2.00<br />
1.50<br />
1.00<br />
0.50<br />
-<br />
Source: BAS<br />
Trade<br />
93 94 95 96 97 98 99 00 01 02 03 04<br />
<strong>5.</strong>2.6 The Philippines is a net importer of corn with AFMA’s m<strong>and</strong>ate for selfsufficiency<br />
limited to white corn. There was minimal import in 1993-1994 which<br />
surged over 300 times in 199<strong>5.</strong> Imports peaked in 1996 <strong>and</strong> 2000 to a little over<br />
400,000 tons while 2004 exhibited the lowest imports at only 364 tons. Corn<br />
imports during the pre-AFMA period averaged 210,000 tons which contracted to<br />
an average 160,000 tons from 1999-2004. Total import expenditure amounted to<br />
$41 million <strong>and</strong> $24 million during the pre-AFMA <strong>and</strong> post-AFMA period,<br />
respectively. It should be noted that bulk of the total imports are used for feeds<br />
<strong>and</strong> that there is also a considerable imports of corn substitutes.<br />
<strong>5.</strong>2.7 From the volume indices of production <strong>and</strong> import, it can be seen that<br />
production has not influenced imports which do not necessarily follow the pattern<br />
of extreme weather disturbances.<br />
Figure <strong>5.</strong>2.5 CORN: Production <strong>and</strong> Import Volume Index, 1993-2004<br />
Volume Index<br />
(1993=100)<br />
66,000<br />
47,000<br />
28,000<br />
9,000<br />
100<br />
(10,000)<br />
Production<br />
Import<br />
93 94 95 96 97 98 99 00 01 02 03 04<br />
Source of basic data: BAS <strong>and</strong> NSO<br />
5- 13
Benchmarking<br />
<strong>5.</strong>2.8 Benchmarking corn yield levels among selected Asian countries indicated<br />
that the Philippines lags far behind China, Thail<strong>and</strong>, <strong>and</strong> Indonesia although it<br />
has overtaken India in 2004. Philippine yield performance from 1993-1998 was<br />
lowest at 1.3% but its yield growth improved from 1999-2004 with 4.8% following<br />
Malaysia <strong>and</strong> Vietnam. The growth can probably be attributed to the exp<strong>and</strong>ed<br />
plantings of hybrid corn seeds.<br />
Table <strong>5.</strong>2.1. CORN: Comparative Yields of Selected Asian Countries, 1993,<br />
1998 <strong>and</strong> 2004<br />
Country Yield (ton/ha)<br />
1993 1998 2004<br />
China 4.96 <strong>5.</strong>27 <strong>5.</strong>12<br />
India 1.60 1.80 2.00<br />
Indonesia 2.20 2.65 3.34<br />
Malaysia 1.90 1.85 3.00<br />
Philippines 1.52 1.62 2.14<br />
Thail<strong>and</strong> 2.73 3.34 3.87<br />
Viet Nam 1.78 2.48 3.49<br />
Source of basic data: FAO<br />
<strong>5.</strong>2.9 In terms of producer prices, the Philippines came out to be the most<br />
expensive corn producer among selected Asian countries which was $40 more<br />
expensive than Indonesia. There was a significant decrease in Philippine prices<br />
which saw the country with lower prices than Indonesia in 2002.<br />
Table <strong>5.</strong>2.2. CORN: Comparative Producer Prices of Selected Asian<br />
Countries, 1993, 1998 <strong>and</strong> 2002<br />
Country Price ($/ton)<br />
1993 1998 2002<br />
China 97.01 131.90 108.86<br />
India 108.06 112.17 116.64<br />
Indonesia 130.97 86.77 141.41<br />
Philippines 170.72 144.54 124.41<br />
Thail<strong>and</strong> 109.00 9<strong>5.</strong>02 96.42<br />
Source of basic data: FAO <strong>and</strong> IFS<br />
Competitiveness analysis<br />
<strong>5.</strong>2.10 The results of parity price ratio estimation showed that corn production<br />
systems in Isabela <strong>and</strong> South Cotabato were not price competitive with corn<br />
exports. The export parity/domestic price ratios across different levels of<br />
technology <strong>and</strong> exchange rates were all less than one implying noncompetitiveness<br />
with the corn export price (UA&P Foundation, 2000)<br />
5- 14
<strong>5.</strong>2.11 The import parity/domestic price ratios across three corn producing<br />
provinces (Isabela, Nueva Ecija, South Cotabato) were greater than one implying<br />
that the domestic production of corn in these provinces was price competitive. It<br />
was noted that the higher the exchange rate, the more price competitive<br />
domestic corn becomes in these provinces. (UA&P Foundation, 2000)<br />
<strong>5.</strong>2.12 The analysis of corn cost competitiveness showed that the domestic corn<br />
production systems in Isabela <strong>and</strong> South Cotabato were not competitive in the<br />
export market (UA&P Foundation, 2000)<br />
<strong>5.</strong>2.13 The estimates showed that domestic corn production across production<br />
technology <strong>and</strong> province was more efficient than corn imports. Resource cost<br />
ratios (RCR) were less than one for high technology production system in South<br />
Cotabato as well as low technology hybrid in Isabela implying global<br />
competitiveness. (UA&P Foundation, 2000)<br />
SWOT Analysis<br />
<strong>5.</strong>2.14 A strength of the corn industry is the availability of high yielding varieties,<br />
Bt corn <strong>and</strong> modern technologies together with the presence of input suppliers<br />
<strong>and</strong> seed producers. However, inputs are relatively expensive <strong>and</strong> some areas<br />
have limited access to good quality seeds.<br />
<strong>5.</strong>2.15 For the new technologies to be adopted in the farmers’ field, financing is<br />
very important. Farmers often seek the very active informal sector for credit.<br />
Though this could be counted as a weakness due to high interest rates of 5% per<br />
month, at least there is some source of credit for the farmers who cannot afford<br />
to borrow from formal lending institutions due to their basic inability to comply<br />
with the usual requirements.<br />
<strong>5.</strong>2.16 One opportunity where farmer can afford to borrow from formal institutions<br />
is through the integration of production of high value crops <strong>and</strong>/or livestock to<br />
diversify the sources of income. But there may be hesitation from banks <strong>and</strong><br />
government financing institutions (GFIs) to grant loans in such areas unless the<br />
basic issue of loan payment, which is in turn related to market, is addressed. For<br />
this to happen, the private sector <strong>and</strong> the government should unite <strong>and</strong> resolve to<br />
act together to help the farmers in such area <strong>and</strong> condition.<br />
<strong>5.</strong>2.17 Looking at the national picture, there is a surplus of white corn but when it<br />
comes to the regional level especially in the consumption areas, there are<br />
deficiencies. As previously cited, this is because of general separation of areas of<br />
corn production from that of consumption (Table <strong>5.</strong>2.3).<br />
<strong>5.</strong>2.18 Corn’s productivity level has been increasing at slower pace <strong>and</strong> this can<br />
be attributed to low usage of higher yielding varieties, low level of inputs<br />
application <strong>and</strong> planting in more marginal areas. About 70% of area devoted to<br />
5- 15
white corn is still planted to traditional varieties. By targeting even 50% of the<br />
70% planted to traditional varieties, requirement could be met with the use of<br />
available higher yielding varieties such as OPV or hybrids.<br />
<strong>5.</strong>2.19 Productivity could also be enhanced by farming systems approach which<br />
could also conserve the production environment most of which are in sloping<br />
areas. White corn production could also exp<strong>and</strong> under coconut areas. In this<br />
case, their income from their main crop will be complemented by white corn<br />
production.<br />
<strong>5.</strong>2.20 At the processing plant level, post harvest facilities are usually available.<br />
But farmers’ harvest sometimes does not reach this far due to the poor road<br />
condition in such remote <strong>and</strong> marginal production areas. Technologies which are<br />
suited for small farm/l<strong>and</strong>holders like corn farmers are available from <strong>Agricultural</strong><br />
Mechanization Development Program (AMDP), Bureau of Post Harvest<br />
Research <strong>and</strong> Extension (BPRE) <strong>and</strong> local manufacturers. However, funding is a<br />
problem since the farmers’ economic condition won’t permit him to procure such<br />
machine <strong>and</strong> implements.<br />
<strong>5.</strong>2.21 Staple. As a staple, white corn has a strong regional dem<strong>and</strong> in the<br />
south specifically in Central Visayas, Zamboanga Peninsula, <strong>and</strong> Northern<br />
Mindanao where consumption of white corn as staple is highest. However,<br />
Central Visayas’ dem<strong>and</strong> cannot be covered by its production <strong>and</strong> even that of<br />
nearby regions of Eastern <strong>and</strong> Western Visayas. Thus, the distance from main<br />
production source becomes a problem. Importing from Mindanao has usually<br />
been the practice but it entails higher transport costs <strong>and</strong> grain quality<br />
deterioration due to long distance traveled.<br />
<strong>5.</strong>2.22 An opportunity could therefore be seen in the stabilization of rice <strong>and</strong> corn<br />
prices especially in white corn eating regions. If dem<strong>and</strong> of the white corn eating<br />
regions will be sufficiently supplied, then at least there will be less dem<strong>and</strong> for<br />
rice in those regions thereby lessening the pressure on rice sector to produce<br />
more. There are also opportunities in the snack food sector for corn as basic raw<br />
material.<br />
<strong>5.</strong>2.23 The big concern though is the lack of post harvest facilities. Preserving<br />
grain quality is very essential. Spoiled grain would not translate to economic<br />
benefits for the farmers. At the peak of harvest in the second semester which<br />
coincides with the major production season, rainfall is also at its peak which<br />
leads to more grain spoilage during this season. There is an obvious need for the<br />
establishment of post harvest facilities. It is estimated that annual post harvest<br />
loss is about 15 to 20% of harvest which would be around P4 billion. Investing<br />
P1.2 billion would save such production annually but the problem is who will<br />
shoulder the expenses (Corcolon, Salazar <strong>and</strong> de Torres, 2000).<br />
5- 16
<strong>5.</strong>2.24 Feeds. There is a very big dem<strong>and</strong> for corn in the poultry <strong>and</strong> livestock<br />
industries. However, local production cannot meet the volume <strong>and</strong> quality<br />
requirements which have led the end-users to resort to substitutes.<br />
<strong>5.</strong>2.25 Cornstarch. The four cornstarch manufacturing plants in the country,<br />
namely Cagayan Corn Products, Julu Cornstarch, PHILTRADE <strong>and</strong> Lamsan<br />
have a total capacity of 590 mt per day or 184,080 mt per year. This high<br />
capacity means additional market for our local corn farmers – both for white <strong>and</strong><br />
yellow. However, its industry association is not that active. As in staple grain, an<br />
identified threat is the lack of post harvest facilities at field level. If there is no<br />
accessible facility for drying <strong>and</strong> transport, supply of white corn to the<br />
manufacturing plants will be affected.<br />
<strong>5.</strong>2.26 In terms of institutions, the DA-Regional Field Units (RFUs) in coordination<br />
with the local government units (LGUs) carry out at the farm level extension<br />
activities such as trainings, field demos <strong>and</strong> distribution of technology packages,<br />
among others. However, reaching farmers particularly those in remote areas can<br />
be difficult physically due to the poor road condition.<br />
<strong>5.</strong>2.27 Farmers sometimes are also not open to new technologies because of<br />
perceived lack of sustainability in the assistance from the government. These<br />
weaknesses are sometimes addressed by some non-government organizations<br />
as well as through the use of radio which could reach highly remote areas.<br />
<strong>5.</strong>2.28 A part of the internal revenue allocation (IRA) of the LGUs supposedly for<br />
food security could be used to reach out to more corn farmers. There are some<br />
LGUs however which may opt not to give priority to food security concerns. But<br />
as the government persists in reaching out to the farmers <strong>and</strong> the farmers, in<br />
turn, opening up to the government <strong>and</strong> new technologies, then, there could be<br />
more opportunities for economic development in the countryside.<br />
Table <strong>5.</strong>2.3. CORN INDUSTRY: SWOT Analysis<br />
STRENGTHS WEAKNESSES<br />
Inputs<br />
1. Availability of HYVs, Bt corn <strong>and</strong><br />
modern technologies<br />
1. Limited distribution <strong>and</strong> access to HYV<br />
seeds<br />
2. Presence of input suppliers 2. High costs of inputs (hybrid seeds,<br />
fertilizers, pesticides)<br />
3. Very active informal creditors 3. Very high interest rates of informal<br />
creditors<br />
4. Presence of seed producers<br />
Farm Production<br />
<strong>5.</strong> Surplus status for white corn 4. Low adoption of HYVs<br />
<strong>5.</strong> Low level of inputs application<br />
6. Planted more in marginal areas<br />
5- 17
Post Production<br />
6. Availability of postharvest facility at<br />
the processing plant level<br />
7. Practically no crop insurance<br />
8. Poor road condition in remote <strong>and</strong><br />
marginal areas<br />
7. Availability of warehouse space 9. High cost of mechanical drying<br />
10. Lack of postharvest facilities at field<br />
level<br />
Marketing <strong>and</strong> Distribution<br />
8. Established marketing channels 11. Numerous market intermediaries<br />
9. Strong regional dem<strong>and</strong> for white 12. Long distance from production to<br />
corn in the south<br />
market<br />
10. Strong dem<strong>and</strong> from the poultry<br />
<strong>and</strong> livestock industries<br />
13. High marketing cost<br />
11. High cornstarch manufacturing<br />
capacity<br />
Institutions<br />
14. Drop in local prices<br />
12. Presence of corn program 1<strong>5.</strong> No continuity of corn programs<br />
(frequent change of DA leadership)<br />
13. Strong coordination between DA- 16. Farmers not open to new<br />
RFUs <strong>and</strong> LGUs<br />
technologies due to perceived absence<br />
of government assistance<br />
14. Establishment of PhilMaize 17. Difficulty in physically reaching out to<br />
farmers<br />
OPPORTUNITIES THREATS<br />
1. Availability of hybrids <strong>and</strong> OPVs 1. Relative low profitability<br />
2. Farming systems approach 2. L<strong>and</strong> conversion <strong>and</strong> crop shifting<br />
3. Expansion under flat coconut areas 3. Lack of funds for postproduction<br />
machineries<br />
4. Availability of technologies from 4. LGUs not prioritizing food security<br />
government <strong>and</strong> local manufacturers concerns<br />
<strong>5.</strong> Augment rice supply in the south <strong>5.</strong> Hesitancy of formal creditors to lend<br />
6. Dem<strong>and</strong> from snack food<br />
6. Lack of infrastructure for quality<br />
manufacturers<br />
management<br />
7. Development of bio-fuels e.g. corn<br />
ethanol<br />
8. Other value added processed<br />
products<br />
Source: STRIVE <strong>and</strong> CFA-UA&P<br />
7. Presence of substitutes<br />
5- 18
<strong>5.</strong>3 COCONUT<br />
Production, Area, <strong>and</strong> Yield<br />
<strong>5.</strong>3.1 Coconut production in nut terms grew moderately averaging 2.2%<br />
annually over the last twelve years. The impact of the severest El Niño was felt<br />
by the industry more in 1999 with a 9.5% production decline following another<br />
negative year in 1998. Production made a marked recovery in 2000 <strong>and</strong><br />
continued to have modest gains in the following years. Growth over the pre-<br />
AFMA years (1993-1997) without the effect of the severe El Niño averaged 4.4%<br />
which was slightly below the growth during the post AFMA years (1999-2004) at<br />
4.5%.<br />
<strong>5.</strong>3.2 Area harvested has relatively remained the same over the period ranging<br />
from 3.1-3.25 million hectares. Average growth has been less than one percent<br />
over the pre <strong>and</strong> post AFMA years.<br />
Figure <strong>5.</strong>3.1 COCONUT: Production <strong>and</strong> Area harvested, 1993-2004<br />
Production ('M tons)<br />
16.00<br />
14.00<br />
12.00<br />
10.00<br />
8.00<br />
6.00<br />
4.00<br />
2.00<br />
Source: BAS<br />
-<br />
Volume Area<br />
93 94 95 96 97 98 99 00 01 02 03 04<br />
<strong>5.</strong>3.3 In terms of indices, production improved a maximum of 17% over the 1993<br />
figure in 1997 which was not sustained <strong>and</strong> dropped by one percent in 1999 as a<br />
result of the El Niño. On a positive note, the succeeding post-AFMA productions<br />
were all above the base year even at a slightly increasing rate.<br />
3.30<br />
3.25<br />
3.20<br />
3.15<br />
3.10<br />
3.05<br />
3.00<br />
2.95<br />
Area harvested ('M<br />
ha)<br />
Figure <strong>5.</strong>3.2 COCONUT: Production Index, 1993-2004<br />
Production index<br />
(1993=100)<br />
140<br />
120<br />
100<br />
-<br />
80<br />
60<br />
40<br />
20<br />
93 94 95 96 97 98 99 00 01 02 03 04<br />
Source of basic data: BAS<br />
5- 19
<strong>5.</strong>3.4 In terms of regional distribution, five regions account for 60-65% of total<br />
production. Davao continues to lead all regions in terms of production with total<br />
share of 17% in 2004 although this is a large drop from its 25-26% share in 1993<br />
<strong>and</strong> 1998. Eastern Visayas <strong>and</strong> Calabarzon have maintained shares of 11-12%.<br />
On the other h<strong>and</strong>, Zamboanga has gone down from third to fifth position but has<br />
managed to maintain its 9% production share. Other regions which have moved<br />
in <strong>and</strong> out of the top five include Bicol, ARMM, <strong>and</strong> Northern Mindanao. The<br />
traditional producers have not changed in the pre <strong>and</strong> post AFMA years.<br />
Figure <strong>5.</strong>3.3 COCONUT: Regional Distribution of Production, 1993, 1998<br />
<strong>and</strong> 2004<br />
Others<br />
37%<br />
1993<br />
Total: 11,669,480 tons<br />
Bicol<br />
Region<br />
8%<br />
Eastern<br />
Visay as<br />
8%<br />
Source of basic data: BAS<br />
Zamboanga<br />
Peninsula<br />
9%<br />
Others<br />
41%<br />
Dav ao<br />
Region<br />
26%<br />
Calabarzon<br />
12%<br />
Others<br />
35%<br />
ARMM<br />
9%<br />
2004<br />
Total: 14,366,186 tons<br />
Zamboanga<br />
Peninsula<br />
9%<br />
Northern<br />
Mindanao<br />
10%<br />
Dav ao<br />
Region<br />
17%<br />
1998<br />
Total: 12,806,429 tons<br />
Zamboanga<br />
Peninsula<br />
9%<br />
Eastern<br />
Visay as<br />
12%<br />
Calabarzon<br />
11%<br />
Calabarzon<br />
11%<br />
Dav ao<br />
Region<br />
25%<br />
Eastern<br />
Visay as<br />
<strong>5.</strong>3.5 The moderate production growth over the years can be attributed to the<br />
yield gains averaging 1.7% during the period. However, the average productivity<br />
of 4 tons has not been enough to enhance farmer income <strong>and</strong> push coconut<br />
further into the export market. More vigorous programs were done during the<br />
post AFMA years on replanting, fertilization, <strong>and</strong> the use of high yielding<br />
varieties.<br />
11%<br />
5- 20
Figure <strong>5.</strong>3.4 COCONUT: Average Yield, 1993-2004<br />
Yield (ton/ha)<br />
<strong>5.</strong>00<br />
4.00<br />
3.00<br />
2.00<br />
1.00<br />
-<br />
Source: BAS<br />
Trade<br />
93 94 95 96 97 98 99 00 01 02 03 04<br />
<strong>5.</strong>3.6 The Philippines is a major exporter of coconut products led by coconut oil.<br />
Coconut oil exports have exceeded the 1 million ton mark in six of the last twelve<br />
years as indicated by the years exceeding 25% of the1993 figure. Like most<br />
crops, coconut is affected by weather aberrations thus the extreme drop in<br />
production in 1999 caused a 44% contraction in oil exports. Exports peaked in<br />
2001 to 1.4 million tons. There was no difference in coconut oil exports between<br />
the pre <strong>and</strong> post AFMA periods as both averaged just over one million tons. Total<br />
export value reached $3.6 billion <strong>and</strong> $2.6 billion during the pre-AFMA <strong>and</strong> post-<br />
AFMA period, respectively.<br />
<strong>5.</strong>3.7 The volume indices indicate that export volume is affected by production<br />
volume particularly in years with extreme weather disturbances. However, since<br />
coconut oil is an export commodity, its volume is highly influenced by the<br />
competitiveness of the other vegetable oils in the world market.<br />
Figure <strong>5.</strong>3.5 COCONUT: Production <strong>and</strong> Export Volume Index, 1993-2004<br />
Volume Index<br />
(1993=100)<br />
180<br />
160<br />
140<br />
120<br />
100<br />
-<br />
80<br />
60<br />
40<br />
20<br />
Production<br />
Oil Export<br />
93 94 95 96 97 98 99 00 01 02 03 04<br />
Source of basic data: BAS <strong>and</strong> NSO<br />
5- 21
Benchmarking<br />
<strong>5.</strong>3.8 The top three coconut producers are Indonesia, Philippines <strong>and</strong> India.<br />
Coconut yield levels among selected Asian countries showed that the Philippines<br />
is far behind Indonesia <strong>and</strong> India. Yield growth from 1993-1998 was negative for<br />
most of the countries except for China <strong>and</strong> Vietnam. However, a marked<br />
improvement in yield growth was observed from 1999-2004 led by the Philippines<br />
with <strong>5.</strong>4%.<br />
Table <strong>5.</strong>3.1. COCONUT: Comparative Yields of Selected Asian Countries,<br />
1993, 1998 <strong>and</strong> 2004<br />
Yield (ton/ha)<br />
Country<br />
1993 1998 2004<br />
China 9.33 10.03 10.39<br />
India <strong>5.</strong>44 <strong>5.</strong>31 <strong>5.</strong>00<br />
Indonesia <strong>5.</strong>53 <strong>5.</strong>44 6.12<br />
Malaysia 3.94 3.60 3.97<br />
Philippines 3.68 3.43 4.41<br />
Thail<strong>and</strong> 4.24 4.15 4.37<br />
Viet Nam<br />
Source of basic data: FAO<br />
<strong>5.</strong>70 <strong>5.</strong>90 7.01<br />
<strong>5.</strong>3.9 The Philippines came out to be the cheapest coconut producer in 1993<br />
among selected Asian countries. However this position was not sustained as<br />
Indonesia <strong>and</strong> Thail<strong>and</strong> had lower prices in 1998 <strong>and</strong> 2002, respectively.<br />
Nevertheless, the significant decrease in 2002 Philippine prices saw the country<br />
with lower prices than Indonesia <strong>and</strong> India.<br />
Table <strong>5.</strong>3.2. COCONUT: Comparative Producer Prices of Selected Asian<br />
Countries, 1993, 1998 <strong>and</strong> 2002<br />
Price ($/ton)<br />
Country<br />
1993 1998 2002<br />
China 584.35 144.95 161.65<br />
India 126.09 83.59 60.89<br />
Indonesia 93.35 69.83 11<strong>5.</strong>23<br />
Philippines 74.48 77.26 54.65<br />
Thail<strong>and</strong> 88.47 100.78 4<strong>5.</strong>88<br />
Source of basic data: FAO <strong>and</strong> IFS<br />
Competitiveness analysis<br />
<strong>5.</strong>3.10 Since most coconut products are exported, the best measure of<br />
competitiveness is its cost competitiveness. A comparative costs <strong>and</strong> returns of<br />
coconut oil (CNO) <strong>and</strong> palm oil (CPO) revealed that while CNO has a higher<br />
price than CPO, its return to revenues is much lower due to low farm productivity.<br />
(UA&P Coconut discussion paper, 2006)<br />
5- 22
<strong>5.</strong>3.11 The low farm productivity has put in question the competitiveness of the<br />
Philippines as a reliable supplier of coconut-based products. In the fats <strong>and</strong> oils<br />
market, coconut oil is only one among 17 traded in the world led by soybean oil,<br />
palm oil, rapeseed oil, sunflowerseed oil, <strong>and</strong> cottonseed oil. Combined with<br />
other producers, coconut oil accounts for only 5% of the world oils <strong>and</strong> fats<br />
business.<br />
<strong>5.</strong>3.12 The unstable supply of coconut oil in the international markets have led<br />
importers to look for alternative sources of lauric acid. The main competitor of<br />
CNO in this area is palm kernel oil. However, there are alternatives being<br />
developed like cuphea <strong>and</strong> rapeseed oil rich in lauric acid.<br />
<strong>5.</strong>3.13 The quality competitiveness of coconut is challenged by food safety <strong>and</strong><br />
health issues like the powerful lobby by soybean interests against coconut oil as<br />
a coronary heart disease risk. Other concerns are the presence of aflatoxin <strong>and</strong><br />
polycyclic aromatic hydrocarbon in coconut oil caused by the improper drying of<br />
copra.<br />
<strong>5.</strong>3.14 A classic example of quality which was not followed is in nata de coco.<br />
Given the huge dem<strong>and</strong> in the 90s, some traders shipped sub-st<strong>and</strong>ard products<br />
to Japan without observing production protocols. The Philippines lost the<br />
Japanese market to Thail<strong>and</strong> which the country is still in the process of regaining.<br />
<strong>5.</strong>3.15 One competitiveness asset of the coconut industry is its product<br />
innovation. In 2005, the industry exported 37 different products <strong>and</strong> byproducts<br />
from coconut to 114 countries. This includes the traditional products <strong>and</strong> the<br />
upcoming potential winners like virgin coconut oil, coconut cream <strong>and</strong><br />
geotextiles. There is also the potential use of coconut for the biodiesel.<br />
SWOT Analysis<br />
<strong>5.</strong>3.16 The coconut industry despite being tagged by some as a “sunset” industry<br />
is still thriving with full of potentials but beset by many weaknesses. There is<br />
availability of good clones <strong>and</strong> technologies with established marketing system,<br />
export facilities, <strong>and</strong> processing plants. However, the industry has a basic supply<br />
<strong>and</strong> quality problem given the minimal areas planted to good clones, senile trees,<br />
lack of fertilization, plantings in marginal l<strong>and</strong>s <strong>and</strong> lack of good drying facilities at<br />
the field level.<br />
<strong>5.</strong>3.17 There are many things going for the industry since the crop has many<br />
product possibilities with multiple stakeholders. The traditional products from<br />
coconut have been added with opportunities in several value added products like<br />
virgin coconut oil, geotextiles, oleochemicals, <strong>and</strong> alternative fuel.<br />
5- 23
<strong>5.</strong>3.18 While the country is the largest exporter of coconut products, it is still a<br />
price taker given the competition from the other vegetable oilseeds. This puts<br />
pressure on farm prices <strong>and</strong> incomes as most farms do not practice intercropping<br />
thus the reliance on coconut for their livelihood.<br />
Table <strong>5.</strong>3.3. COCONUT INDUSTRY: SWOT Analysis<br />
STRENGTHS WEAKNESSES<br />
Inputs<br />
1. Availability of good clones 1. Only 1% of the areas are planted<br />
with good clones<br />
2. No irrigation system in coconut areas<br />
Farm Production<br />
2. Favorable climate in most areas 3. Senile trees (30% of st<strong>and</strong>s)<br />
3. Availability of technologies 4. Only 1% of the farms apply fertilizers<br />
4. Unique lauric structure of coconut <strong>5.</strong> Plantings in marginal l<strong>and</strong>s<br />
oil<br />
6. Intercropping in only 30% of the l<strong>and</strong><br />
Logistics<br />
<strong>5.</strong> Established marketing system 7. High assembly/freight costs due to<br />
poor roads <strong>and</strong> fragmented, small<br />
holdings<br />
6. Export facilities 8. Multi-layered marketing channels<br />
9. Scattered/unclustered ports mean<br />
costly ocean freight.<br />
Milling<br />
7. Presence of many mills 10. Underutilized mills/old technologies<br />
8. Presence of refiners 11. Underutilized refineries<br />
12. Shortage of raw materials<br />
13. High assembly costs<br />
14. Low quality copra<br />
1<strong>5.</strong> Scattered factories mean costly local<br />
freight<br />
Other Value Adding<br />
9. Many product possibilities 16. Cost of raw materials<br />
Institutions<br />
10. Multi-stakeholders 17. Frequent changes in DA/PCA<br />
leadership<br />
11. Organized industry associations 18. Lack of program support; too<br />
dependent on coco levy resolution<br />
19. Politization of management over<br />
coco levy companies<br />
5- 24
OPPORTUNITIES THREATS<br />
1. Stable <strong>and</strong> growing export <strong>and</strong> 1. Poor global image in supply reliability<br />
domestic markets<br />
2. Good prospects for value added 2. Perception of government inaction<br />
products (VCO, geotextiles, etc)<br />
3. Alternative fuel (coconut methyl 3. Competition from other tropical oils<br />
ester- biodiesel) dem<strong>and</strong><br />
(i.e. palm oil <strong>and</strong> palm kernel oil)<br />
4. Low domestic oil consumption vis a 4. Development of rapeseed <strong>and</strong> cuphea<br />
vis growing population<br />
with high lauric content<br />
<strong>5.</strong> Renewable source of vegeoil <strong>5.</strong> Zero Asean tariff/ GATT without<br />
based applications vs depleting promised safety nets in place<br />
mineral oil reserves<br />
6. More stringent sanitary <strong>and</strong> phytosanitary<br />
(SPS) st<strong>and</strong>ards<br />
7. Unregulated cutting of trees<br />
Source: CFA-UA&P<br />
5- 25
<strong>5.</strong>4. SUGARCANE<br />
Production, Area <strong>and</strong> Yield<br />
<strong>5.</strong>4.1 Production fluctuated throughout 1993-1998. There were sharp declines<br />
in 1995 <strong>and</strong> 1998 of more than 20% reducing production to 17.5 million tons with<br />
around 20% fall in area harvested mainly due to crop shifting <strong>and</strong> effects of the El<br />
Niño weather phenomenon. Meanwhile, from 1999 to 2004, production fell by<br />
11% in 2000 but exp<strong>and</strong>ed by 5% per year since then. The major growth drivers<br />
were the use of good quality cane varieties with improved farm management.<br />
Figure <strong>5.</strong>4.1. SUGARCANE: Volume of Production, 1993-2004<br />
Production ('000 tons)<br />
30,000<br />
25,000<br />
20,000<br />
15,000<br />
10,000<br />
5,000<br />
Source: BAS<br />
-<br />
Volume Area<br />
93 94 95 96 97 98 99 00 01 02 03 04<br />
<strong>5.</strong>4.2 Output in 2004 was only 12% higher than in 1993. Production was<br />
relatively stable during 1999 to 2004 than in 1993 to 1998.<br />
500<br />
400<br />
300<br />
200<br />
100<br />
-<br />
Area harvested<br />
('000 ha)<br />
Figure <strong>5.</strong>4.2. SUGARCANE: Production Index, 1993-2004<br />
Production index (1993=100)<br />
120<br />
100<br />
-<br />
80<br />
60<br />
40<br />
20<br />
Source: BAS<br />
93 94 95 96 97 98 99 00 01 02 03 04<br />
<strong>5.</strong>4.3 There are about 54,000 sugarcane farms in 2004 <strong>and</strong> 80% of which are<br />
10 hectares <strong>and</strong> below. Production is concentrated in Western Visayas<br />
accounting for about 60% of total during 1993 to 2004. It was followed by<br />
Northern Mindanao, Central Visayas, <strong>and</strong> Southern Tagalog <strong>and</strong> Central Luzon.<br />
5- 26
Figure <strong>5.</strong>4.3. SUGARCANE: Regional Distribution of Production, 1993, 1998<br />
<strong>and</strong> 2004<br />
Others<br />
7%<br />
1993<br />
Total: 22,915,065 tons<br />
Northern<br />
Mindanao<br />
8%<br />
Western<br />
Visay as<br />
57%<br />
Central<br />
Visay as<br />
9%<br />
Source of basic data: BAS<br />
Calabarzon<br />
9%<br />
Others<br />
10%<br />
Central<br />
Luzon<br />
10%<br />
Others<br />
8%<br />
2004<br />
Total: 25,579,213 tons<br />
Central<br />
Luzon<br />
5%<br />
Western<br />
Visay as<br />
54%<br />
Calabarzon<br />
7%<br />
Central<br />
Visay as<br />
10%<br />
1998<br />
Total: 17,333,372 tons<br />
Northern<br />
Mindanao<br />
7%<br />
Northern<br />
Mindanao<br />
14%<br />
Western<br />
Visay as<br />
60%<br />
Central<br />
Luzon<br />
7%<br />
Calabarzon<br />
8%<br />
Central<br />
Visay as<br />
<strong>5.</strong>4.4 Area harvested varied from year to year. It decreased by 2.5% annually<br />
during 1993 to 1998. Large areas were shifted to other crops in 1995 <strong>and</strong> ceded<br />
to agro-forestry in Western Visayas in 1997. Meanwhile, from 1999 to 2004, area<br />
planted was relatively stable. It declined slightly every year from 2000 to 2002<br />
with areas converted to other crops. On the contrary, area harvested exp<strong>and</strong>ed<br />
in Cagayan Valley, SOCCSKSARGEN <strong>and</strong> in the provinces of Cavite, Camarines<br />
Sur <strong>and</strong> Bukidnon in 2003 while bigger hectarage of sugarcane were reported in<br />
Davao del Sur, Bukidnon <strong>and</strong> Batangas in 2004.<br />
<strong>5.</strong>4.5 Meanwhile, yields for sugarcane were relatively stable from 1993 to 1997.<br />
In 1993, Northern Mindanao registered the highest yield at 88 tons per ha,<br />
followed by Cagayan Valley at 86 tons per ha. By 1998, average yield dropped<br />
by 5% while Calabarzon <strong>and</strong> Western Visayas recorded the top yields at 65 <strong>and</strong><br />
61 tons per ha, respectively. From 1999 to 2004, average yield posted growth of<br />
10%<br />
5- 27
2% per year. In 2004, Western Visayas remained among the highest yields with<br />
73 tons per ha but was bested by ARMM with 77 tons per ha.<br />
Figure <strong>5.</strong>4.4. SUGARCANE: Average Yield, 1993-2004<br />
Yield (ton/ha)<br />
70.0<br />
6<strong>5.</strong>0<br />
60.0<br />
5<strong>5.</strong>0<br />
50.0<br />
Source: BAS<br />
Trade<br />
93 94 95 96 97 98 99 00 01 02 03 04<br />
<strong>5.</strong>4.6 Sugar exports fluctuated from 1993 to 1998. From 1999 to 2004, it<br />
continuously declined during 1999 to 2001 but managed to bounce in the next<br />
three years. Exports comprised mostly of centrifugal (raw) sugar (85% of total<br />
value) with bulk going to the premium-priced US quota market.<br />
<strong>5.</strong>4.7 Meanwhile, sugar importation has changed over the years. Imports<br />
increased significantly in 1995 to 1996 in part due to production shortfalls but<br />
mainly to massive importation by sugar traders. However, it decreased since<br />
2000. The country became a net exporter of sugar since 2002 as a result of<br />
increases domestic production. Over the 12 year period, the bulk of imports were<br />
in the form of refined <strong>and</strong> raw sugar, although no raw sugar imports were<br />
registered from 2003 to 2004. The dominant suppliers for refined were Thail<strong>and</strong><br />
<strong>and</strong> South Korea while for raw were Thail<strong>and</strong> <strong>and</strong> Australia.<br />
Figure <strong>5.</strong>4.<strong>5.</strong> SUGARCANE: Production <strong>and</strong> Trade Volume Index by Product<br />
Type, 1993-2004<br />
Volume index<br />
(1993=100)<br />
1,400<br />
1,200<br />
1,000<br />
800<br />
600<br />
400<br />
200<br />
-<br />
Production Refined imports<br />
Centrifugal imports Centrifugal ex ports<br />
93 94 95 96 97 98 99 00 01 02 03 04<br />
Source of basic data: BAS <strong>and</strong> NSO<br />
5- 28
Benchmarking with Relevant Asian Countries<br />
<strong>5.</strong>4.8 The Philippines is doing better in terms of yield compared with other Asian<br />
countries. It has overtaken Indonesia, the highest in 1993. Philippine yield<br />
performance improved from 1999-2004 with 7.6% growth. The growth can be<br />
attributed to the increasing use of high yielding varieties.<br />
Table <strong>5.</strong>4.1. SUGARCANE: Comparative Yields of Selected Asian<br />
Countries, 1993, 1998 <strong>and</strong> 2004<br />
Country Yield (ton/ha)<br />
1993 1998 2004<br />
China 59.86 73.47 6<strong>5.</strong>35<br />
India 63.87 66.52 59.05<br />
Indonesia 79.02 68.95 71.11<br />
Pakistan 43.02 50.28 49.72<br />
Philippines 77.47 76.50 82.28<br />
Thail<strong>and</strong> 40.16 51.08 57.94<br />
Viet Nam 42.42 48.92 5<strong>5.</strong>33<br />
Source of basic data: FAO<br />
<strong>5.</strong>4.9 In terms of producer prices, the Philippines came out to be the most<br />
expensive sugarcane producer among selected Asian countries in 1998 which<br />
was almost four times more expensive than Thail<strong>and</strong>. There was a significant<br />
decrease in Philippine prices in 2002 compared with 1998 prices. During this<br />
period, the Philippines had lower prices than China.<br />
Table <strong>5.</strong>4.2. SUGARCANE: Comparative Producer Prices of Selected Asian<br />
Countries, 1993, 1998 <strong>and</strong> 2002<br />
Country Price ($/ton)<br />
1993 1998 2002<br />
China 21.35 27.54 32.26<br />
India 21.25 18.57 19.09<br />
Indonesia 26.86 13.05 19.19<br />
Philippines 29.57 40.55 31.49<br />
Thail<strong>and</strong> 14.18 11.73 13.03<br />
Source of basic data: FAO <strong>and</strong> IFS<br />
Competitiveness Analysis<br />
<strong>5.</strong>4.10 Sugar continue to earn dollar for the country due to the US quota.<br />
However, locally produced sugar is generally not competitive in the export<br />
markets like Thail<strong>and</strong> in terms of both price <strong>and</strong> cost.<br />
5- 29
<strong>5.</strong>4.11 The derived export parity prices are relatively lower than domestic<br />
wholesale prices especially for sugar coming from Thail<strong>and</strong>.<br />
SWOT Analysis<br />
<strong>5.</strong>4.12 The Philippine sugar industry has a highly organized private sector who<br />
are actively participating for the development of the industry. They serve the<br />
interest of the farming sector in terms of technical services. Given available<br />
workforce provided with technical skills <strong>and</strong> modern technology are strengths of<br />
the sugar sector.<br />
<strong>5.</strong>4.13 The industry’s weaknesses, if not addressed well, could cause a<br />
long-term decline in competitiveness. Among the major factor to look into is<br />
low farm productivity. This is attributed to the limited use of high yielding<br />
varieties in some production areas, limited irrigation, limited mechanization<br />
<strong>and</strong> poor agronomic practices (i.e. early harvesting).<br />
<strong>5.</strong>4.14 The future of the industry offers promise provided the strengths are<br />
capitalized on <strong>and</strong> the weaknesses frontally addressed. There are still high<br />
potentials for yield <strong>and</strong> quality improvements. Moreover, potentials for area<br />
expansion is still present to increase production. The strong domestic<br />
dem<strong>and</strong> due to increasing population <strong>and</strong> exp<strong>and</strong>ing usage of food<br />
processors provide more opportunities to the industry.<br />
<strong>5.</strong>4.15 The development <strong>and</strong> expansion of the industry are constrained by a<br />
number of factors. The threats <strong>and</strong> the weaknesses must be addressed with<br />
concerted actions by the stakeholders. Extension of CARP implementation, for<br />
example, can lead to inefficiencies in farm production. The declining US Quota is<br />
considered a threat because it is the reliable market for Philippine sugar which<br />
pays premium price. Presence of artificial sweeteners as substitute also cuts<br />
down sugar consumption.<br />
5- 30
Table <strong>5.</strong>4.3. SUGAR INDUSTRY: SWOT Analysis<br />
Strengths Weaknesses<br />
Inputs<br />
1. Increasing use of high yielding 1. Small farm sizes<br />
varieties<br />
2. Development of propagation 2. Limited irrigation<br />
nurseries<br />
3. Large pool of competent scientists<br />
<strong>and</strong> farm workforce<br />
Farm Production<br />
4. L<strong>and</strong> consolidation efforts of some<br />
millers<br />
Logistics<br />
Processing<br />
<strong>5.</strong> Increasing cane supply <strong>and</strong><br />
improving cane quality<br />
3. Limited mechanization<br />
4. Manpower: Poor agronomic<br />
practices<br />
<strong>5.</strong> Low <strong>and</strong> declining farm productivity<br />
6. High production cost (high cost of<br />
inputs)<br />
7. Uncertainty on production caused<br />
by CARP<br />
8. Poor logistics<br />
9. Inadequate Infrastructure<br />
10. High cost of transport<br />
11. Inefficiency in the milling process<br />
- Low utilization: 60%<br />
- Low recovery:79%<br />
Marketing<br />
6. Established miller <strong>and</strong> planter 12. Cut-throat competition<br />
marketing relationship<br />
13. Price Volatility<br />
Opportunities Threats<br />
1. Growth in domestic consumption 1. Declining US Quota<br />
due to increasing population <strong>and</strong><br />
exp<strong>and</strong>ing usage of industrial sectors<br />
i.e. beverage, food processors<br />
2. Research <strong>and</strong> development efforts 2. Artificial sweeteners<br />
by government <strong>and</strong> private sector to<br />
improve yield<br />
3. Extension of CARP implementation<br />
5- 31
<strong>5.</strong>5 BANANA<br />
Production, Area <strong>and</strong> Yield<br />
<strong>5.</strong><strong>5.</strong>1 The country grows many varieties of banana. The major cultivars consist<br />
of Cavendish (mainly for the export market), <strong>and</strong> native varieties like lakatan,<br />
latundan, bungulan <strong>and</strong> señorita (table bananas) <strong>and</strong> saba/cardava (processing<br />
type which is made into banana chips, among others). The available production<br />
data for bananas, however, is not disaggregated according to variety.<br />
Nonetheless, the export volume for fresh bananas (primarily Cavendish) is a<br />
good indicator of Cavendish production.<br />
<strong>5.</strong><strong>5.</strong>2 Production (all varieties) exp<strong>and</strong>ed by 3.8% per year from 3.8 million tons<br />
in 1993 to 4.4 million tons in 1997. Output dropped by 6.8% in 1998 due to<br />
adverse weather conditions but bounced back by 11.3% in 1999. From 1999-<br />
2004, growth averaged 4.3% annually. Output stood at <strong>5.</strong>6 million tons in 2004.<br />
Figure <strong>5.</strong><strong>5.</strong>1. BANANA: Volume of Production <strong>and</strong> Area Planted, 1993-2004<br />
Production ('000 tons)<br />
6,000<br />
5,000<br />
4,000<br />
3,000<br />
2,000<br />
1,000<br />
-<br />
Source: BAS<br />
Volume Area<br />
93 94 95 96 97 98 99 00 01 02 03 04<br />
<strong>5.</strong><strong>5.</strong>3 Production performed relatively better in 1999-2004 than in 1993-1998.<br />
This could be attributed to more favorable weather conditions, good crop<br />
maintenance, additional bearing plants, <strong>and</strong> area expansions especially for<br />
Cavendish in Mindanao. Increases in the number of bearing hills were also<br />
noted in Ilocos Region <strong>and</strong> the provinces of Romblon <strong>and</strong> Mindoro Oriental in<br />
Luzon but these are mainly for native varieties.<br />
500<br />
400<br />
300<br />
200<br />
100<br />
-<br />
Area ('000 ha)<br />
5- 32
Figure <strong>5.</strong><strong>5.</strong>2. BANANA: Production Index (1993=100)<br />
Production volume index (1993=100)<br />
160<br />
140<br />
120<br />
100<br />
-<br />
80<br />
60<br />
40<br />
20<br />
Source: BAS<br />
93 94 95 96 97 98 99 00 01 02 03 04<br />
<strong>5.</strong><strong>5.</strong>4 The Davao Region, a heavily Cavendish area, consistently accounted for<br />
the biggest share of output from 1993 to 2004. It managed to increase its share<br />
from 30% (1.2 million tons) to 41% (2.3 million tons) during the period. It was<br />
followed by SOCCSKSARGEN <strong>and</strong> Northern Mindanao with 11% <strong>and</strong> 10%<br />
output shares in 2004. The increasing shares are mainly due to Cavendish<br />
expansions in Mindanao.<br />
Figure <strong>5.</strong><strong>5.</strong>3. BANANA: Regional Distribution of Production, 1993, 1998<br />
<strong>and</strong> 2004<br />
Others<br />
37%<br />
Cagay an<br />
Valley<br />
7%<br />
1993<br />
Total: 3,809,372 tons<br />
CARAGA<br />
7%<br />
Northern<br />
Mindanao<br />
9%<br />
Dav ao<br />
Region<br />
30%<br />
SOCCSK<br />
SARGEN<br />
10%<br />
Others<br />
33%<br />
ARMM<br />
6%<br />
1998<br />
Total: 4,106,698 tons<br />
Cagay an<br />
Valley<br />
6%<br />
SOCCSK<br />
SARGEN<br />
8%<br />
Northern<br />
Mindanao<br />
9%<br />
Dav ao<br />
Region<br />
38%<br />
5- 33
Source of basic data: BAS<br />
Western<br />
Others<br />
26%<br />
Visay as<br />
5% ARMM<br />
7%<br />
2004<br />
Total: 5,631,250 tons<br />
Northern<br />
Mindanao<br />
10%<br />
SOCCSK<br />
SARGEN<br />
<strong>5.</strong><strong>5.</strong>5 Meanwhile, area planted improved by 1.6% per year from nearly 326,761<br />
hectares in 1993 to 348,648 hectares in 1997. Despite the abnormal weather<br />
conditions in 1998, area managed to grow by 1.5% to 353,707 hectares in 1998.<br />
From 1999-2004, area expansion improved to 2.2% annually reaching 414,510<br />
hectares in 2004. Cavendish plantations are estimated to account for some<br />
45,000 – 50,000 hectares.<br />
<strong>5.</strong><strong>5.</strong>6 The country’s average yield fluctuated from 1993-1998, posting its lowest<br />
level at 11.6 tons in 1998. On the average, yield grew by 2.1% per year from<br />
1993-1997 but declined by a sharp 8.2% in 1998. From 1999-2004, yield has<br />
generally been on an uptrend, with average growth of 2.1% yearly. In 2004, yield<br />
stood at 13.6 tons per hectare. Yield levels are much higher in the Cavendish<br />
farms in Mindanao averaging about 40 tons per hectare.<br />
Figure <strong>5.</strong><strong>5.</strong>4. BANANA: Average Yield, 1993-2004<br />
Yield (ton/ha)<br />
14.0<br />
13.5<br />
13.0<br />
12.5<br />
12.0<br />
11.5<br />
11.0<br />
10.5<br />
Source: BAS<br />
11%<br />
93 94 95 96 97 98 99 00 01 02 03 04<br />
Dav ao<br />
Region<br />
41%<br />
5- 34
<strong>5.</strong><strong>5.</strong>7 Across regions, yield was highest in Davao at nearly 35 tons per hectare<br />
in 2004, nearly double the national average of 13.6 tons. It was followed by<br />
SOCCSKSARGEN at 26.1 tons per hectare. It is worth mentioning, however, that<br />
the yield levels represent averages for all varieties grown. Cavendish yield levels<br />
in Mindanao can go as high as 52 tons to 78 tons per hectare, at par with global<br />
st<strong>and</strong>ards.<br />
Trade<br />
<strong>5.</strong><strong>5.</strong>8 The Philippines is a major banana exporter. Exports, consisting of both<br />
fresh <strong>and</strong> processed bananas (i.e., chips), accounted for at least 30% of<br />
production in 2004. Fresh exports are comprised mostly of Cavendish<br />
although small volumes of lakatan <strong>and</strong> latundan are finding their way into<br />
export markets like China.<br />
<strong>5.</strong><strong>5.</strong>9 Fresh exports posted declines of 0.10% per annum on volume <strong>and</strong><br />
0.90% per annum on value from 1993-1998. Aside from abnormal weather<br />
conditions which affected supplies, growth was pulled down by the sharp<br />
drop in dem<strong>and</strong> in overseas markets like Saudi Arabia, China, Hong Kong<br />
<strong>and</strong> South Korea in 1997. Exports fared relatively better in 1999-2004 with<br />
yearly growth of 6.8% <strong>and</strong> 6.6% on volume <strong>and</strong> value, respectively. In 2004,<br />
exports reached nearly 1.8 million tons valued at US$326 million.<br />
<strong>5.</strong><strong>5.</strong>10 The leading destination has consistently been Japan although this<br />
market has reached saturation, as evidenced by the decline in its share to<br />
total fresh Philippine exports from 65% of volume in 1993 to 51% in 2004.<br />
Other leading destinations in 2004 were Iran, China, Taiwan <strong>and</strong> United Arab<br />
Emirates.<br />
<strong>5.</strong><strong>5.</strong>11 Meanwhile, exports of banana chips performed better than fresh<br />
exports growing by 3% <strong>and</strong> 6.3% on volume <strong>and</strong> value, respectively, from<br />
1993-1998. Annual growth further accelerated to 16% on volume <strong>and</strong> 14.9%<br />
on value during 1999-2004, amid strong dem<strong>and</strong> in overseas markets like<br />
China. Exports amounted to 36,421 tons worth US$36.6 million in 2004. The<br />
leading markets included China, the USA, Germany, Taiwan, <strong>and</strong> the United<br />
Kingdom.<br />
<strong>5.</strong><strong>5.</strong>12 For both fresh bananas <strong>and</strong> banana chips, the volume indices relative<br />
to 1993 levels were generally increasing from 1993-2004. The rate of<br />
increase for chips, however, is a lot faster compared to fresh, implying that<br />
more <strong>and</strong> more production are going into processing.<br />
5- 35
Figure <strong>5.</strong><strong>5.</strong><strong>5.</strong> BANANA: Production <strong>and</strong> Export Volume Index by Product<br />
Form, 1993-2004<br />
Production <strong>and</strong> export volume indices (1993=100)<br />
300<br />
250<br />
200<br />
150<br />
100<br />
-<br />
50<br />
Production Fresh Chips<br />
93 94 95 96 97 98 99 00 01 02 03 04<br />
Source of basic data: NSO<br />
Benchmarking with Relevant Asian Countries<br />
<strong>5.</strong><strong>5.</strong>13 Relative to its Asian neighbors, Philippine yield levels for all banana<br />
varieties were the lowest in 1993 <strong>and</strong> 1998. In 2004, however, the country<br />
managed to post a slight edge over Thail<strong>and</strong>. Nonetheless, the data masks the<br />
fact that the Cavendish farms in Mindanao are among the best in the world.<br />
Table <strong>5.</strong><strong>5.</strong>1. BANANA: Comparative Yields of Selected Asian Countries,<br />
1993, 1998 <strong>and</strong> 2004<br />
Yield (Ton/Ha)<br />
Country 1993 1998 2004<br />
China 14.2 19.9 23.2<br />
India 23.0 32.8 24.7<br />
Indonesia 13.6 12.3 1<strong>5.</strong>5<br />
Malaysia 17.4 17.8 20.4<br />
Philippines 9.4 10.7 13.6<br />
Thail<strong>and</strong> 12.5 12.8 13.1<br />
Viet Nam 14.8 14.7 14.7<br />
Source: FAO<br />
5- 36
<strong>5.</strong><strong>5.</strong>14 Philippine bananas comm<strong>and</strong>ed the lowest producer price in Asia. This<br />
may be due to the following reasons: (1) for Cavendish bananas, the plantations<br />
are relatively cost-efficient; <strong>and</strong> (2) for the native bananas, minimal maintenance<br />
expenses are incurred since the usual practice is to just leave the trees alone.<br />
Table <strong>5.</strong><strong>5.</strong>2. BANANA: Comparative Producer Prices of Selected Asian<br />
Countries, 1993, 1998 <strong>and</strong> 2004<br />
US$ per ton<br />
Country 1993 1998 2002<br />
China 266.1 797.2 724.9<br />
India 129.3 147.8 140.7<br />
Indonesia 318.2 16<strong>5.</strong>6 277.0<br />
Philippines 112.8 111.5 87.6<br />
Thail<strong>and</strong> 174.7 20<strong>5.</strong>1 173.8<br />
Source of basic data: FAO <strong>and</strong> IFS<br />
Competitive Analysis<br />
<strong>5.</strong><strong>5.</strong>15 Cavendish banana is highly competitive in the domestic <strong>and</strong> export<br />
markets, as evidenced by its sustained <strong>and</strong> dominant presence in Asia <strong>and</strong> the<br />
Middle East (Dy, 2000).<br />
<strong>5.</strong><strong>5.</strong>16 Native varieties like lakatan <strong>and</strong> saba possess varying levels of<br />
competitiveness. Lakatan is not competitive with exports as domestic prices are<br />
higher than derived export prices. While there are potentials for exp<strong>and</strong>ing<br />
exports considering that lakatan can compete in terms of cost, there are<br />
constraints related to poor farm practices – from product h<strong>and</strong>ling to packaging<br />
<strong>and</strong> distribution, limited farm budget for higher chemical use, <strong>and</strong> low productivity<br />
levels, as well as cultural preferences for Cavendish in markets like Japan, Hong<br />
Kong <strong>and</strong> China (UA&P Foundation, 2000). Further, the relatively favorable<br />
prices in the domestic market which does not impose any quality requirements<br />
also leads farmers to prefer to serve it rather than the more discriminating export<br />
market.<br />
<strong>5.</strong><strong>5.</strong>17 Saba, meanwhile, is competitive in both the domestic <strong>and</strong> export markets<br />
(UA&P Foundation, 2000). The cost of producing saba is said to be very low<br />
(since farm maintenance activities are usually very minimal) making it a strong<br />
c<strong>and</strong>idate for export. Similar to lakatan, however, there are constraints on<br />
productivity, production volumes, <strong>and</strong> cultural preferences of importing countries.<br />
5- 37
SWOT Analysis<br />
<strong>5.</strong><strong>5.</strong>18 Banana is a relatively well established industry in the country. The<br />
industry’s strengths include favorable climate for banana growing, year-round<br />
production <strong>and</strong> availability of processing technologies. For Cavendish which is<br />
geared mainly for export, the advantages stem from the availability of tissuecultured<br />
planting materials, the highly integrated operations from input supply to<br />
production to marketing, the relatively well-developed export marketing<br />
infrastructure from cold storage facilities, reefer vans, ports, ships, <strong>and</strong><br />
established global presence due to the dominance of multinational firms like Del<br />
Monte <strong>and</strong> Dole, as well as local companies like Lap<strong>and</strong>ay.<br />
<strong>5.</strong><strong>5.</strong>19 Despite these strengths, the industry suffers from rising costs of inputs<br />
like labor, fertilizers, <strong>and</strong> chemicals, declining soil fertility resulting from<br />
continuous farming <strong>and</strong> application of chemicals, <strong>and</strong> incidence of pests <strong>and</strong><br />
diseases, among others. For the native varieties, there are still constraints<br />
related to sourcing of tissue-cultured planting materials, low productivity <strong>and</strong><br />
product quality, <strong>and</strong> multi-layered marketing system. Processing is also limited<br />
by the availability of raw material supply (specifically saba/cardava) <strong>and</strong> the<br />
increasing costs of inputs like sugar, cooking oil as well as utilities (electricity,<br />
water). For Cavendish, the lack of market diversification (or the continuing<br />
reliance on traditional markets like Japan) poses as a constraint.<br />
<strong>5.</strong><strong>5.</strong>20 Overall, however, there are opportunities for exp<strong>and</strong>ing both production<br />
<strong>and</strong> exports considering the growing dem<strong>and</strong> in both the domestic <strong>and</strong><br />
export markets not just for fresh but for processed products as well. To<br />
be able to capitalize on these opportunities, however, there is need to<br />
manage the threats brought about by increasing competition in the global<br />
market, the imposition of non-tariff barriers by importing countries (such<br />
as in the case of Australia which continues to ban Philippine bananas on<br />
sanitary <strong>and</strong> phytosanitary grounds), the uncertainties of l<strong>and</strong> reform,<br />
<strong>and</strong> rising input costs. Managing the peace <strong>and</strong> order situation in<br />
Mindanao, where most commercial banana plantations are located, is<br />
also critical.<br />
5- 38
Table <strong>5.</strong><strong>5.</strong>3. BANANA INDUSTRY: SWOT Analysis<br />
STRENGTHS WEAKNESSES<br />
Inputs<br />
1. Availability of tissue cultured<br />
planting materials (Cavendish)<br />
Production<br />
2. Favorable climate for banana<br />
growing<br />
1. High input costs (labor, fertilizers<br />
<strong>and</strong> chemicals)<br />
2. Declining fertility of l<strong>and</strong>s<br />
3. Difficulty in accessing good l<strong>and</strong>s of<br />
economic size<br />
4. Hectarage limitation (LOI 790)<br />
(Cavendish)<br />
<strong>5.</strong> Limited availability of quality<br />
planting materials of native varieties<br />
6. General low yield of native varieties<br />
due to inadequate clonal materials<br />
<strong>and</strong> poor crop management<br />
3. Year-round production 7. Poor quality of native varieties<br />
4. Highly integrated operations 8. Incidence of pests <strong>and</strong> diseases<br />
(Cavendish)<br />
9. Sporadic plantings of native<br />
varieties<br />
Processing<br />
<strong>5.</strong> Availability of processing<br />
10.Limited raw material availability<br />
technologies<br />
11. High cost of utilities<br />
12. High cost of inputs (e.g. cooking oil,<br />
sugar, saba)<br />
Marketing<br />
6. Established export marketing 13. Multi-layered marketing system<br />
infrastructure (Cavendish)<br />
particularly for non-Cavendish<br />
varieties<br />
7. Global br<strong>and</strong> presence (Cavendish) 14. Heavy dependence on traditional<br />
export markets (Cavendish)<br />
OPPORTUNITIES THREATS<br />
1. Strong domestic dem<strong>and</strong> 1. Increasing competition in export<br />
markets<br />
2. Increasing dem<strong>and</strong> for “organic” 2. Uncertainties of agrarian reform<br />
bananas in the world market<br />
(CARP)<br />
3. Exp<strong>and</strong>ing China market 3. Rising input costs<br />
4. Growth of processing industries 4. Peace <strong>and</strong> order situation<br />
(e.g. chips <strong>and</strong> sauce/ketchup) (especially in Mindanao)<br />
<strong>5.</strong> Non-tariff barriers in certain markets<br />
5- 39
abroad<br />
5- 40
<strong>5.</strong>6 MANGO<br />
Production, Area <strong>and</strong> Yield<br />
<strong>5.</strong>6.1 Production posted double digit growth throughout 1993-1997, with average<br />
of 16.3% from 544,606 tons to 990,246 tons in 1997. The expansion was driven<br />
by increased number of bearing trees, proper management <strong>and</strong> use of flower<br />
inducers, amid favorable weather conditions. Growth decelerated to 0.4% in<br />
1998 as a result of the El Niño weather disturbance, causing a decline in the<br />
overall growth from 1993-1998 to 13.1% yearly. Meanwhile from 1999-2004,<br />
output exp<strong>and</strong>ed by 2.3%, pulled down by the sharp contraction of 12.9% in<br />
1999. The decline continued through 2000, brought about by continuous rains<br />
which affected the flowering <strong>and</strong> fruiting stages of the tree. Output peaked in<br />
2003 at a little over 1 million tons but declined to 967,473 tons in 2004 due to<br />
unfavorable weather conditions.<br />
Figure <strong>5.</strong>6.1. MANGO: Volume of Production <strong>and</strong> Area Planted, 1993-2004<br />
Production ('000 tons)<br />
1,200<br />
1,000<br />
800<br />
600<br />
400<br />
200<br />
Source: BAS<br />
-<br />
Volume Area<br />
93 94 95 96 97 98 99 00 01 02 03 04<br />
<strong>5.</strong>6.2 Compared to 1993 levels, output improved by 83% in 1998 <strong>and</strong> 78% in<br />
2004. Production levels were generally higher in 1999-2004 compared to 1993-<br />
1998 although the rate of growth in output was faster in the latter.<br />
Figure <strong>5.</strong>6.2. MANGO: Production Index (1993=100)<br />
Production index (1993=100)<br />
200<br />
150<br />
100<br />
-<br />
50<br />
Source: BAS<br />
200<br />
150<br />
100<br />
50<br />
-<br />
Area harvested ('000 ha)<br />
93 94 95 96 97 98 99 00 01 02 03 04<br />
5- 41
<strong>5.</strong>6.3 The biggest regional producer of mango is the Ilocos Region, particularly<br />
the province of Pangasinan. Ilocos managed to increase its share to total<br />
production from only 30% (167,281 tons) in 1993 to 41% (399,592 tons) in 1998<br />
<strong>and</strong> further to 44% (430,851 tons) in 2004. It used to be followed by Region IV-<br />
A, led by the province of Batangas, but was overtaken by Central Luzon in 2004<br />
with 9%. Other big producers are Central <strong>and</strong> Western Visayas.<br />
Figure <strong>5.</strong>6.3. MANGO: Regional Distribution of Production, 1993, 1998 <strong>and</strong> 2004<br />
Central<br />
Visay as<br />
8%<br />
Others<br />
27%<br />
1993<br />
Total: 544,606 tons<br />
Cagay an<br />
Valley<br />
10%<br />
Western<br />
Visay as<br />
10%<br />
Source of basic data: BAS<br />
Western<br />
Visay as<br />
5%<br />
Ilocos<br />
Region<br />
30%<br />
Region IV-A<br />
Others<br />
26%<br />
15%<br />
Region IV-A<br />
9%<br />
Western<br />
Visay as<br />
5%<br />
Central<br />
Luzon<br />
9%<br />
2004<br />
Total: 967,473 tons<br />
Central<br />
Visay as<br />
6%<br />
Central<br />
Luzon<br />
9%<br />
Others<br />
20%<br />
1998<br />
Total: 994,002 tons<br />
Cagay an<br />
Valley<br />
9%<br />
Ilocos<br />
Region<br />
44%<br />
Region IV-A<br />
16%<br />
Ilocos<br />
Region<br />
41%<br />
5- 42
<strong>5.</strong>6.4 Meanwhile, area planted exp<strong>and</strong>ed by 8.2% from 91,213 hectares in 1993<br />
to 124,947 hectares in 1997. Growth decelerated to 3.9% in 1998, pulling down<br />
the average growth from 1993-1998 to 7.3%. Growth further slowed down to<br />
3.8% per year from 132,232 hectares in 1999 to 158,943 hectares in 2004. Area<br />
expansions especially in Central Luzon, Northern Mindanao <strong>and</strong> Davao were<br />
more aggressive in 1993-1998. Back in 1993, Ilocos accounted for the biggest<br />
hectarage at 17,430 hectares, or about 19% of the total area planted to mango<br />
during the year. In 1998, it was overtaken by Central Luzon, which managed to<br />
grow its share from 14% to nearly 20%, while Ilocos’ share dropped to 16%.<br />
Central Luzon has retained the top spot since then. In 2004, it cornered 19% of<br />
the hectarage devoted to mango.<br />
<strong>5.</strong>6.5 Meanwhile, yield improved by 7.5% per year from nearly 6 tons per<br />
hectare in 1993 to 7.9 tons in 1997. Yield dropped by 3.4% in 1998 to 7.7 tons<br />
per hectare. It continued to post a downtrend, with growth averaging 1.4% per<br />
annum from 6.6 tons per hectare in 1999 to 6.1 tons per hectare in 2004.<br />
Possibly, many of the fruits that were planted in the earlier years were just<br />
starting to bear fruit.<br />
Figure <strong>5.</strong>6.4. MANGO: Average Yield, 1993-2004<br />
Yield (ton/ha)<br />
10.0<br />
8.0<br />
6.0<br />
4.0<br />
2.0<br />
-<br />
Source: BAS<br />
93 94 95 96 97 98 99 00 01 02 03 04<br />
<strong>5.</strong>6.7 Yield was highest in the Ilocos Region at 20.2 tons per hectare in 2004,<br />
more than three times the national average of only 6.1 tons per hectare. The rest<br />
of the regions had yield levels below 7 tons per hectare.<br />
Trade<br />
5- 43
<strong>5.</strong>6.8 The country is a net exporter of mangoes. Total export receipts<br />
increased by 2% per year from US$42.3 million in 1993 to US$51 million in<br />
2004. About 60% of the total value of exports in 2004 were in fresh form <strong>and</strong><br />
the rest are processed mango products such as puree, juice, dried, frozen,<br />
concentrates, drained or crystallized, in brine <strong>and</strong> pickled. Exports increased<br />
by 5% per year from 1993-1998 <strong>and</strong> picked up further in 1999-2004, growing<br />
by 7.6% per annum. The growth driver in the earlier years were fresh<br />
mangoes but processed exports propelled growth in the latter period. In<br />
particular, puree, dried <strong>and</strong> frozen mangoes posted substantial increases in<br />
2003 because of strong dem<strong>and</strong> overseas.<br />
<strong>5.</strong>6.9 The country exported 33,662 tons of fresh mangoes worth US$28.7<br />
million in 2004. The leading market volume-wise was Hong Kong, absorbing<br />
61% of total exports during the year. Japan was a far second with a 30% share.<br />
In terms of value, however, Japan was a far bigger market than Hong Kong since<br />
it offers a price premium. It accounted for 62% of the total value of fresh mango<br />
exports during the same year. Growth in these markets, however, has been<br />
rather anemic.<br />
<strong>5.</strong>6.10 Puree exports, meanwhile, totaled 9,291 tons in 2004, generating<br />
US$9.2 million in foreign exchange earnings. The leading buyers were South<br />
Korea (47% of volume), Japan (19%) <strong>and</strong> the USA. On the other h<strong>and</strong>, juice<br />
exports amounted to 3,360 tons during the same year, valued at US$3 million.<br />
The primary destination was the USA (44% of volume), followed distantly by<br />
Canada (10%) <strong>and</strong> Japan (9%). In the case of dried mangoes, exports reached<br />
1,912 tons valued at US$8.1 million also in 2004. Some 41% of the volume went<br />
to the USA, followed by Singapore (12%) <strong>and</strong> Japan (10%).<br />
<strong>5.</strong>6.11 Considering the two leading mango exports – fresh <strong>and</strong> puree – the<br />
volume indices relative to 1993 levels were generally increasing for puree but<br />
was decreasing for fresh mangoes especially from 2000-2004. This could<br />
imply that more <strong>and</strong> more of production are going into processed rather than<br />
fresh exports.<br />
Figure <strong>5.</strong>6.<strong>5.</strong> MANGO: Production <strong>and</strong> Export Volume Index by Product<br />
Form, 1993-2004<br />
Index (1993=100)<br />
450<br />
400<br />
350<br />
300<br />
250<br />
200<br />
150<br />
100<br />
50<br />
-<br />
Production Fresh ex ports Puree ex ports<br />
93 94 95 96 97 98 99 00 01 02 03 04<br />
5- 44
Source of basic data: BAS <strong>and</strong> NSO<br />
Benchmarking with Relevant Asian Countries<br />
<strong>5.</strong>6.12 Philippine yield levels are comparable to many of its neighbors in Asia.<br />
It managed to post the highest yield in 1998, possibly boosted by the<br />
strong production in 1997-1998 due to the dry spell which favored the<br />
fruiting of trees. In 2004, it fared better than Indonesia <strong>and</strong> Malaysia<br />
<strong>and</strong> was at par with Vietnam but was a little behind China, India <strong>and</strong><br />
Thail<strong>and</strong>.<br />
Table <strong>5.</strong>6.1. MANGO: Comparative Yields of Selected Asian Countries,<br />
1993, 1998 <strong>and</strong> 2004<br />
Yield (Ton/Ha)<br />
Country 1993 1998 2004<br />
China 8.5 6.4 8.6<br />
India 8.3 7.3 6.8<br />
Indonesia 3.6 4.5 4.6<br />
Malaysia <strong>5.</strong>0 <strong>5.</strong>0 3.9<br />
Philippines 6.8 8.2 6.1<br />
Thail<strong>and</strong> <strong>5.</strong>9 4.8 6.3<br />
Viet Nam 6.7 4.9 6.1<br />
Source: FAO<br />
<strong>5.</strong>6.13 In terms of producer prices in 2002, the Philippines possessed a certain<br />
advantage over China but was still higher than India <strong>and</strong> Indonesia. In 1998, the<br />
country posted the highest price compared to its Asian competitors. Prices may<br />
have been boosted by strong dem<strong>and</strong> in the domestic <strong>and</strong> export markets.<br />
Table <strong>5.</strong>6.2. MANGO: Comparative Producer Prices of Selected Asian<br />
Countries, 1993, 1998 <strong>and</strong> 2004<br />
US$ per ton<br />
Country 1993 1998 2002<br />
China 2,48<strong>5.</strong>1 504.4 386.9<br />
India 332.5 380.3 361.8<br />
Indonesia 660.7 161.4 270.0<br />
Philippines 572.6 516.5 377.7<br />
Source of basic data: FAO <strong>and</strong> IFS<br />
5- 45
Competitiveness Analysis<br />
<strong>5.</strong>6.13 Mango is one of the leading fruit crop exports of the country. Mangoes<br />
coming from the major producing areas like Zambales, Guimaras <strong>and</strong><br />
Davao del Sur are generally competitive in export markets like Japan<br />
<strong>and</strong> Hong Kong in terms of both price <strong>and</strong> cost (UA&P Foundation,<br />
2000).<br />
<strong>5.</strong>6.14 Japan appeared to be the more attractive market especially for<br />
producers from Davao del Sur <strong>and</strong> Zamboanga since the derived export<br />
parity prices are relatively higher than domestic wholesale prices.<br />
Despite the high cost of transporting mangoes domestically, the<br />
premium prices offered by the Japanese market may have spelled the<br />
difference.<br />
SWOT Analysis<br />
<strong>5.</strong>6.15 The Philippine mango industry caters to both the domestic <strong>and</strong> export<br />
market. One of its strengths is that it could be produced year-round<br />
since there are already existing production technologies <strong>and</strong> at the same<br />
time, l<strong>and</strong> areas for expansion are available. In addition, it is regarded<br />
as one of the best varieties in the world. The country’s strategic location<br />
in Asia also gives the industry an advantage.<br />
<strong>5.</strong>6.16 The industry, however, is not without its weaknesses. These include<br />
the lack of quality (certified) planting materials – this is very critical<br />
considering that mango is a long-gestating crop; high cost of inputs<br />
such as fertilizers, flower inducers, <strong>and</strong> other chemicals; prevalence of<br />
backyard farms which contribute to low productivity, low quality <strong>and</strong> high<br />
post-harvest losses; lack of post-harvest facilities such as cold chain<br />
<strong>and</strong> vapor heat treatment facilities; high costs of transport; <strong>and</strong> the need<br />
to improve quality st<strong>and</strong>ards to meet especially the requirements in the<br />
export markets.<br />
<strong>5.</strong>6.17 There are also opportunities which the industry can tap. These include<br />
the untapped dem<strong>and</strong> particularly in the global market for both fresh <strong>and</strong><br />
processed products. The development of technologies for prolonging<br />
the fruit’s shelf life also offers possibilities of shipping to distant markets<br />
like the US <strong>and</strong> Europe.<br />
<strong>5.</strong>6.18 The threats, meanwhile, are posed mainly by increasing competition in<br />
the global market. Many countries are exp<strong>and</strong>ing their outputs such as Thail<strong>and</strong>,<br />
Cambodia, Viet Nam, China, Australia, Pakistan, Ivory Coast, Honduras <strong>and</strong> Haiti<br />
5- 46
to cater to exports. The industry also faces restrictions related to the imposition of<br />
sanitary <strong>and</strong> phytosanitary measures by overseas buyers for fresh <strong>and</strong><br />
processed products. Examples include the lowering of maximum residue levels<br />
for chlorpyrifos <strong>and</strong> other chemicals in the Japanese market <strong>and</strong> China’s<br />
requirement of VHT treatment for fresh mangoes. Meanwhile, certain additives<br />
are regulated or prohibited for processed products. Other threats include the<br />
country’s inability to service overseas dem<strong>and</strong> during off-season which could<br />
lead to market shifts to other country-suppliers, <strong>and</strong> the agrarian reform program<br />
which puts a cap on the size of l<strong>and</strong> ownership <strong>and</strong> thus, limits the possible<br />
benefits from economies of scale.<br />
5- 47
Table <strong>5.</strong>6.3. MANGO INDUSTRY: SWOT Analysis<br />
Inputs<br />
STRENGTHS WEAKNESSES<br />
Production<br />
1. Philippine super mango is<br />
considered as one of the best<br />
varieties in the world<br />
1. Lack of quality (certified) planting<br />
materials<br />
2. High cost of inputs (e.g. fertilizers,<br />
chemicals for spraying)<br />
3. Long gestation period<br />
2. Year-round production possible 4. Low productivity<br />
3. Availability of production<br />
<strong>5.</strong> Low marketable quality due to<br />
technologies<br />
prevalence of backyard farms<br />
4. Expansion of new plantings in other 6. High losses due to high<br />
regions for off-season production perishability<br />
<strong>5.</strong> Priority fruit crop supported by the<br />
DA, DTI <strong>and</strong> DOST<br />
Processing/Post-harvest<br />
6. Availability of processing<br />
technologies<br />
7. Susceptible to insect pests,<br />
diseases <strong>and</strong> disorders<br />
8. Lack of post-harvest facilities (e.g.<br />
cold chain, VHT)<br />
9. Availability of raw materials for<br />
processing (fresh mango)<br />
Marketing<br />
7. Strategic location of Philippines in 10.High freight cost <strong>and</strong> inadequate<br />
ASEAN <strong>and</strong> Asian markets<br />
transport facilities/price fluctuation<br />
8. Peak season coincides with most 11.Lack of quality assurance plan <strong>and</strong><br />
favorable market in Hong<br />
HACCP<br />
Kong/China<br />
12.Inadequate marketing <strong>and</strong> other<br />
information to support decision<br />
making of industry players<br />
OPPORTUNITIES THREATS<br />
1. Growing domestic consumer base 1. Increasing competition in the global<br />
market<br />
2. Strategic location of the Philippines<br />
in ASEAN <strong>and</strong> Asian markets<br />
2. Unmet dem<strong>and</strong> during off-season<br />
hence the danger of exportsubstitution<br />
from other mango<br />
producing countries<br />
3. Expansion of markets (USA, 3. Imposition of sanitary <strong>and</strong><br />
5- 48
Australia, South Korea, China) phytosanitary measures by importing<br />
countries<br />
4. Untapped dem<strong>and</strong> especially in 4. Agrarian reform law<br />
other overseas markets<br />
<strong>5.</strong> International trade accounts for less<br />
than 2% of world production<br />
6. Development of technologies for<br />
prolonging shelf-life (e.g. controlled<br />
atmosphere, modified atmosphere<br />
packaging) making possible<br />
shipment to distant markets<br />
7. Tariff reductions in overseas<br />
markets<br />
Source: Adapted from “Strategic Action Plan: Mango,” Department of<br />
Agriculture, April 2002, <strong>and</strong> Minguez, Guia. Lecture Material for Food Systems<br />
Management Course on High Value Fruits <strong>and</strong> Vegetables, CFA-UA&P, March<br />
2002<br />
5- 49
<strong>5.</strong>7 ONION<br />
Production, Area <strong>and</strong> Yield<br />
<strong>5.</strong>7.1 There are basically three varieties of onions grown: the red onion (Red<br />
Creole), the white onion (Yellow Granex) <strong>and</strong> the multiplier onion, otherwise<br />
known as shallot (a native variety commonly referred to as “Sibuyas Tagalog”).<br />
Production is highly seasonal, with peak in March - April <strong>and</strong> lean period during<br />
June - December. In fact, most of the supplies in the second half of the year<br />
come from cold storage.<br />
<strong>5.</strong>7.2 Production increased by 9.1% per annum from 61,464 tons in 1993 to<br />
85,383 tons in 1997. It benefited from the robust growth in area harvested by<br />
16.2% per year from 6,519 hectares to 11,888 hectares during the period. Output<br />
further rose by 1.9% to 6,978 tons in 1998 as area likewise grew by 7.5% to<br />
12,779 hectares. Despite this increase, however, there was a shortage of onions<br />
in the local market during the year, prompting a substantial rise in imports.<br />
<strong>5.</strong>7.3 In 1999, both production <strong>and</strong> area harvested posted declines. Output<br />
suffered from the flashfloods especially in Nueva Ecija, the major production<br />
area. The surge in imports during the year also discouraged many farmers from<br />
planting onions, thus, contributing to the production decline through 2001.<br />
Production peaked in 2002 at 96,358 tons, boosted by a combination of factors:<br />
the use of good quality seeds, lower incidence of pests <strong>and</strong> diseases, additional<br />
production areas <strong>and</strong> favorable weather conditions. The succeeding years, 2003-<br />
2004, were characterized by production slippages brought about by decreases in<br />
area planted due to unfavorable market prices, crop shifting, <strong>and</strong> weather<br />
disturbances (i.e., dry spell especially in Ilocos in 2003, <strong>and</strong> heavy rains in 2004).<br />
On the whole, growth decelerated to 0.7% per annum from 1999-2004 as area<br />
planted posted a flat growth.<br />
Figure <strong>5.</strong>7.1. ONION: Volume of Production <strong>and</strong> Area Planted, 1993-2004<br />
Production ('000 tons)<br />
100<br />
-<br />
80<br />
60<br />
40<br />
20<br />
Source: BAS<br />
Volume Area<br />
93 94 95 96 97 98 99 00 01 02 03 04<br />
14<br />
12<br />
10<br />
8<br />
6<br />
4<br />
2<br />
-<br />
Area harvested ('000 ha)<br />
5- 50
<strong>5.</strong>7.4 Relative to 1993 levels, production was up by 41% in 2004. The gains in<br />
production were higher in 1993-1998 at 7.7% as compared to only 0.7% in 1999-<br />
2004.<br />
Figure <strong>5.</strong>7.2. ONION: Production Index (1993=100)<br />
Production index (1993=100)<br />
180<br />
160<br />
140<br />
120<br />
100<br />
80<br />
60<br />
40<br />
20<br />
-<br />
Source: BAS<br />
93 94 95 96 97 98 99 00 01 02 03 04<br />
<strong>5.</strong>7.5 Production is highly concentrated in two regions- Central Luzon,<br />
particularly in the province of Nueva Ecija, <strong>and</strong> the Ilocos Region (practically the<br />
whole region, i.e., Ilocos Norte, Ilocos Sur <strong>and</strong> Pangasinan, except La Union).<br />
Central Luzon contributed 59% (35,976 tons) of the total onion harvest in 1993<br />
while Ilocos’ share stood at 39% (23,892 tons). By 2004, the former’s share<br />
dropped to 50% (42,850 tons) while the latter increased to 48% (41,480 tons).<br />
Figure <strong>5.</strong>7.3. ONION: Regional Distribution of Production, 1993, 1998 <strong>and</strong> 2004<br />
Central<br />
Luzon<br />
59%<br />
1993<br />
Total: 61,464 tons<br />
Mimaropa<br />
Others Cagay an<br />
0.2% Calabarzon<br />
0.7% Valley<br />
0.2%<br />
1.5%<br />
Ilocos<br />
Region<br />
39%<br />
Central<br />
Luzon<br />
58%<br />
Others<br />
0.6%<br />
1998<br />
Total: 86,978 tons<br />
Soccsk-<br />
sargen<br />
0.2%<br />
Northern Cagay an<br />
Mindanao Valley<br />
0.3% 1%<br />
Ilocos<br />
Region<br />
40%<br />
5- 51
Central<br />
Luzon<br />
50%<br />
Source of basic data: BAS<br />
2004<br />
Total: 86,741 tons<br />
Others<br />
0.3% Mimaropa<br />
0.3%<br />
Calabarzon<br />
0.3%<br />
Cagay an<br />
<strong>5.</strong>7.6 Yield, meanwhile, dropped by <strong>5.</strong>1% per annum from 9.4 tons per hectare<br />
in 1993 to 7.2 tons per hectare in 1997. Yield also suffered a decline in 1998 by<br />
<strong>5.</strong>2%, resulting to an overall decline of <strong>5.</strong>9% per annum during 1993-1998. The<br />
relatively poor yield levels were an offshoot of adverse climatic conditions,<br />
among others. A slight turnaround was posted in 1999-2004 to 1% per year<br />
from 8.9 tons per hectare to 9.1 tons per hectare.<br />
Figure <strong>5.</strong>7.4. ONION: Average Yield, 1993-2004<br />
Yield (ton/ha)<br />
12.0<br />
10.0<br />
8.0<br />
6.0<br />
4.0<br />
2.0<br />
-<br />
Source: BAS<br />
Trade<br />
93 94 95 96 97 98 99 00 01 02 03 04<br />
<strong>5.</strong>7.7 The country’s trade of onions (<strong>and</strong> shallots) covers fresh/chilled, dried <strong>and</strong><br />
prepared/preserved forms. Total exports fluctuated during the past 12 years<br />
through 2004 ranging from a low of US$3 million in 1999 to a high of US$15<br />
million in 199<strong>5.</strong> Fresh/chilled shallots (multiplier onions), destined mostly to<br />
Indonesia, dominate exports, followed by fresh/chilled onions (Yellow Granex<br />
variety), mainly to Japan.<br />
Valley<br />
2%<br />
Ilocos<br />
Region<br />
48%<br />
5- 52
<strong>5.</strong>7.8 Total imports, meanwhile, have been rather minimal until 1996 when the<br />
local market was liberalized. Imports, mostly fresh/chilled onions (also of the<br />
Yellow Granex type), surged to US$383,000 from only US$18,000 in 199<strong>5.</strong> By<br />
1998, imports swelled to US$2.5 million due mainly to local supply shortage.<br />
Imports have remained at relatively high levels since then.<br />
<strong>5.</strong>7.9 In terms of volume indices pegged at 1993 levels, fresh/chilled onion<br />
exports were generally declining. Meanwhile, fresh/chilled shallots were volatile,<br />
with peaks in 1997 <strong>and</strong> 2003. These were also years of relatively high<br />
production. There were export declines especially in 1998-1999, which could be<br />
attributed to the Asian financial crisis of 1997-1998, which affected not just local<br />
exporters but the country’s overseas markets as well like Indonesia for shallots.<br />
Figure <strong>5.</strong>7.<strong>5.</strong> ONION: Production <strong>and</strong> Export Volume Index by Product<br />
Form, 1993-2004<br />
Index (1993=100)<br />
300<br />
250<br />
200<br />
150<br />
100<br />
-<br />
50<br />
93 94 95 96 97 98 99 00 01 02 03 04<br />
Production Fresh/chilled onions Fresh/chilled shallots<br />
Source of basic data: BAS <strong>and</strong> NSO<br />
Benchmarking<br />
<strong>5.</strong>7.10 The country’s yield lagged behind most of its neighbors in Asia. It is<br />
much less than half of China which posted the highest yield but is three times<br />
more than Vietnam, which posted the lowest. The low Philippine yield could be<br />
due to adverse weather conditions, lack of irrigation, <strong>and</strong> the domestic<br />
preference for small-sized onions.<br />
Table <strong>5.</strong>7.1. ONION (DRY): Comparative Yields of Selected Asian<br />
Countries, 1993, 1998 <strong>and</strong> 2004<br />
Yield (Ton/Ha)<br />
Country 1993 1998 2004<br />
China 20.0 20.6 21.2<br />
India 10.9 11.4 10.4<br />
Indonesia 7.5 7.8 8.5<br />
Philippines 9.5 6.8 9.1<br />
Thail<strong>and</strong> 12.5 14.9 16.0<br />
Viet Nam 3.0 3.0 3.0<br />
Source: FAO<br />
5- 53
<strong>5.</strong>7.11 Compared to its Asian counterparts, the Philippines registered the second<br />
highest producer price, next to Indonesia. This could be attributed to the<br />
domestic preference for small sized onions which results to low yields <strong>and</strong> high<br />
production cost per unit. The most competitive is India with its price nearly three<br />
to four times lower than the Philippines, possibly due to bumper harvests <strong>and</strong><br />
state subsidies.<br />
Table <strong>5.</strong>7.2. ONION: Comparative Producer Prices of Selected Asian<br />
Countries, 1993, 1998 <strong>and</strong> 2004<br />
US$ per ton<br />
Country 1993 1998 2002<br />
China 402.5 180.9 173.3<br />
India 80.0 138.0 98.8<br />
Indonesia 627.3 382.5 64<strong>5.</strong>7<br />
Philippines 416.7 498.6 267.8<br />
Thail<strong>and</strong> 409.5 198.6 191.1<br />
Source of basic data: FAO <strong>and</strong> IFS<br />
Competitiveness Analysis<br />
<strong>5.</strong>7.12 Local onions were generally competitive in the export market, particularly<br />
Japan, in 1998 (UA&P Foundation, 2000). The derived wholesale prices from<br />
FOB prices were higher compared to actual wholesale prices, indicating a<br />
competitive advantage. The export window to Japan, the leading market for<br />
fresh/chilled onions, is usually confined to the first quarter of the year only<br />
(January to March), the production season. Competitiveness, however,<br />
deteriorated in 1999 as domestic wholesale prices shot up due to supply<br />
shortages.<br />
<strong>5.</strong>7.13 The Philippines was also competitive in terms of cost in the export of<br />
onions to Japan in 1998 (UA&P Foundation, 2000). This was particularly true<br />
during the first three months of the year. In effect, the country enjoyed a<br />
seasonal competitive advantage in the export market in terms of both price <strong>and</strong><br />
cost during the production months of January to March.<br />
<strong>5.</strong>7.14 Philippine onions, however, were not price competitive with imports<br />
coming from China in 1998-1999 (UA&P Foundation, 2000). The derived<br />
wholesale prices were lower as compared to actual wholesale prices during the<br />
months of October to December, when local supplies came mainly from cold<br />
storage.<br />
5- 54
SWOT Analysis<br />
<strong>5.</strong>7.15 The main strength of onion is its versatility. Aside from being used as<br />
basic sauté ingredient in everyday cooking together with garlic, it could<br />
be eaten in various states - raw, fried, pickled, broiled, boiled, baked,<br />
creamed, <strong>and</strong> steamed. Other strengths include the availability of good<br />
quality seeds for Yellow Granex exports, <strong>and</strong> the presence of<br />
technology <strong>and</strong> experienced farmers.<br />
<strong>5.</strong>7.16 The crop has a lot of potential considering the growing dem<strong>and</strong> not<br />
just in the domestic but in the export market as well. There are,<br />
however, many constraints that need to be overcome ranging from the<br />
high costs of inputs such as seeds, fertilizers <strong>and</strong> pesticides, which are<br />
mostly imported; the highly seasonal nature of production; the growing<br />
incidence of pests <strong>and</strong> diseases such as leaf miners, twister<br />
anthracnose, <strong>and</strong> fusarium wilt; the increasing acidity of soil due to<br />
continuous burning of rice hull in onion fields to kill soil-borne diseases;<br />
lack of irrigation which affects productivity; lack of access to credit<br />
considering the relatively high cost of growing onions (around P100,000<br />
cash costs based on BAS estimates for 2005); limited cold storage<br />
facilities, the bulk of which are privately-owned <strong>and</strong> located in Metro<br />
Manila; high cost of storage since many of the facilities are privatelyowned;<br />
<strong>and</strong> the multi-layered marketing system.<br />
<strong>5.</strong>7.17 There are also threats such as the growing competition from other<br />
country-exporters (e.g. Thail<strong>and</strong>), <strong>and</strong> the influx of cheap imports from<br />
China.<br />
Table <strong>5.</strong>7.3. ONION INDUSTRY: SWOT Analysis<br />
STRENGTHS WEAKNESSES<br />
Inputs<br />
1. Available good quality seeds for<br />
yellow granex exports<br />
Production<br />
2. Presence of technology <strong>and</strong><br />
experienced onion farmers<br />
Processing<br />
1. High cost of seeds<br />
2. High cost of fertilizers <strong>and</strong><br />
pesticides<br />
3. Highly seasonal production<br />
4. Growing incidence of pests <strong>and</strong><br />
diseases<br />
<strong>5.</strong> High cost of production<br />
6. Lack of irrigation<br />
7. Lack of access to credit<br />
8. Increasing soil acidity<br />
9. Limited cold storage facilities<br />
5- 55
Marketing<br />
3. Serves as basic ingredient for<br />
everyday cooking<br />
10.High storage cost<br />
11.Multi-layered marketing system<br />
4. Versatile crop<br />
OPPORTUNITIES THREATS<br />
1. Large domestic market 1. Competition from other exporting<br />
countries (e.g. Thail<strong>and</strong>)<br />
2. Growing dem<strong>and</strong> in export market 2. Influx of cheap imports<br />
5- 56
<strong>5.</strong>8 SWINE<br />
Production<br />
<strong>5.</strong>8.1 Production grew by <strong>5.</strong>3% annually, on the average from 1993 to 1997,<br />
with 1.1 million tons liveweight production in 1993 to 1.4 million tons in 1997.<br />
Growth decelerated to 3.6% in 1998 as a result of the El Niño weather<br />
disturbance. Meanwhile from 1999 to 2004, output exp<strong>and</strong>ed by 3.1%, pulled<br />
down by the sharp contraction of -1.4% in 2004. Output peaked in 2002 at <strong>5.</strong>2%<br />
growth due to production expansion by most of the growers.<br />
Figure <strong>5.</strong>8.1. SWINE: Volume of Production, 1993-2004<br />
Quantity ('000 tons)<br />
2000<br />
1500<br />
1000<br />
500<br />
0<br />
Source: BAS<br />
93 94 95 96 97 98 99 00 01 02 03 04<br />
<strong>5.</strong>8.2 Compared to 1993 levels, production performed better in 1999-2004 than<br />
in 1993-1998. Output in 2004 was 55% higher than in 1993.<br />
Figure <strong>5.</strong>8.2. SWINE: Production Index, 1993-2004<br />
Production index (1993=100)<br />
200<br />
150<br />
100<br />
50<br />
0<br />
93 94 95 96 97 98 99 00 01 02 03 04<br />
Source of basic data: BAS<br />
5- 57
<strong>5.</strong>8.3 Swine growers are mostly located in Central Luzon <strong>and</strong> Southern Tagalog.<br />
Central Luzon managed to increase its share to total production from 15% in<br />
1993 to 16% in 1998 <strong>and</strong> in 2004. It used to be followed by Southern Tagalog at<br />
15% share but was reduced to only 13% in 2004. Other big producers are<br />
Davao Region, Central <strong>and</strong> Western Visayas.<br />
Figure <strong>5.</strong>8.3. SWINE: Regional Distribution of Production, 1993, 1998 <strong>and</strong> 2004<br />
Central<br />
Visay as<br />
8%<br />
1993<br />
Total: 1,101,520 tons<br />
Western<br />
Visay as<br />
8%<br />
Others<br />
43%<br />
Dav ao<br />
Region<br />
11%<br />
Source of basic data: BAS<br />
Trade<br />
Southern<br />
Tagalog<br />
15%<br />
Dav ao<br />
Region<br />
7%<br />
Central<br />
Luzon<br />
15%<br />
Central<br />
Visay as<br />
8%<br />
2004<br />
Total: 1,406,592 tons<br />
Central<br />
Visay as<br />
8%<br />
Others<br />
48%<br />
Western<br />
Visay as<br />
8%<br />
Southern<br />
Tagalog<br />
13%<br />
1998<br />
Total: 165,458 tons<br />
Western<br />
Visay as<br />
8%<br />
Central<br />
Luzon<br />
16%<br />
Others<br />
42%<br />
Dav ao<br />
Region<br />
11%<br />
Southern<br />
Tagalog<br />
<strong>5.</strong>8.4 Frozen pork imports surged to US$21.3 million in 1999 from only<br />
US$29,000 in 1993. In 1995, the FMD scare bloated pork imports by more than<br />
200% in terms of value. In 1996, imports further surged by more than 800%<br />
following the lifting of import restrictions. By 1999, imports swelled to US$21.3<br />
million (more than 200% increase over last year) due mainly to local supply<br />
shortage brought about by foot <strong>and</strong> mouth disease (FMD). Imports have<br />
remained at relatively high levels since then.<br />
15%<br />
Central<br />
Luzon<br />
16%<br />
5- 58
<strong>5.</strong>8.5 In terms of volume indices pegged at 1993 levels, imports were generally<br />
increasing while production increases are very minimal. There was a relatively<br />
high imports since 1996 following the lifting of import restrictions which resulted<br />
to imports surge in 1997 <strong>and</strong> 1999. There were import declines especially in<br />
2002 which are almost at the 1998 level when imports were low brought about by<br />
the Asian financial crisis of 1997-1998, which affected the local processors.<br />
Frozen pork imports are used mostly by meat processors.<br />
Figure <strong>5.</strong>8.4. PORK: Production <strong>and</strong> Import Volume Index, 1993-2004<br />
Volume index (1993=100)<br />
9,000<br />
7,000<br />
5,000<br />
3,000<br />
1,000<br />
100<br />
(1,000)<br />
Import Production<br />
93 94 95 96 97 98 99 00 01 02 03 04<br />
Source of basic data: BAS <strong>and</strong> NSO<br />
Benchmarking with Relevant Asian Countries<br />
<strong>5.</strong>8.6 Benchmarking production levels among selected Asian countries indicated<br />
that the Philippines remains to be far behind China at close levels with Vietnam,<br />
Korea <strong>and</strong> Japan. It has overtaken Korea <strong>and</strong> Japan in 2004. Philippine yield<br />
performance from 1993-1998 was low at 27.6% but recovered its performance<br />
levels with 47.5% growth from 1999-2004.<br />
Table <strong>5.</strong>8.1. PORK: Comparative Production of Selected Asian Countries,<br />
1993, 1998 <strong>and</strong> 2004<br />
Country Production in Ton<br />
1993 1998 2004<br />
China 29,836,491 39,900,430 48,117,789<br />
India 469,000 465,500 497,000<br />
Indonesia 621,500 621,500 566,500<br />
Japan 1,439,610 1,290,800 1,262,600<br />
Korea 770,000 939,356 1,100,000<br />
Malaysia 262,771 260,172 203,497<br />
Philippines 731,000 932,810 1,376,129<br />
Singapore 85,472 84,133 20,015<br />
Thail<strong>and</strong> 458,757 468,950 677,040<br />
Viet Nam 878,000 1,228,000 2,012,021<br />
Source of basic data: FAO<br />
5- 59
<strong>5.</strong>8.7 In terms of technical parameters, the Philippines is not far behind from<br />
Thail<strong>and</strong>, Malaysia <strong>and</strong> Indonesia. These are in terms of feed conversion ratios,<br />
pig sold per sow per year, average daily weight gains for fatteners, <strong>and</strong> average<br />
farrowing rate. Among the four countries, Thail<strong>and</strong> is the most efficient reaching<br />
18 pigs sold per sow per year for large farms, followed closely by Malaysia with<br />
17 pigs <strong>and</strong> Philippines with 16 pigs. In terms of FCR, Thail<strong>and</strong> achieved the<br />
highest 3.8 kilos followed closely by Philippines with 3.7 kilos. ADG was 0.55 kilo<br />
for Thail<strong>and</strong> <strong>and</strong> 0.54 for Philippines <strong>and</strong> Indonesia (STRIVE Foundation <strong>and</strong><br />
UA&P, 2004)<br />
<strong>5.</strong>8.8 In terms of producer prices, the Philippines came out to be one of the most<br />
expensive producers among selected Asian countries. The trend has not<br />
changed significantly with the coming of AFMA although there was a significant<br />
decrease in prices in 2002 for all countries except Indonesia <strong>and</strong> a minimal for<br />
Korea <strong>and</strong> Japan.<br />
Table <strong>5.</strong>8.2. PORK: Comparative Producer Prices of Selected Asian<br />
Countries, 1993, 1998 <strong>and</strong> 2002<br />
Country Price ($/ton)<br />
1993 1998 2002<br />
China 471.71 942.14 821.55<br />
India 304.36 297.29 267.66<br />
Indonesia 1,370.32 512.10 1,233.89<br />
Japan 2,612.41 2,181.65 2,50<strong>5.</strong>78<br />
Korea 1,649.53 1,22<strong>5.</strong>37 1,414.77<br />
Philippines 1,304.20 1,190.91 991.78<br />
Thail<strong>and</strong> 937.99 906.70 893.55<br />
Source of basic data: FAO <strong>and</strong> IFS<br />
<strong>5.</strong>8.9 Hog producers in the Philippines incur higher cost of production due to<br />
high cost of marketing <strong>and</strong> processing specifically transport, h<strong>and</strong>ling, cold<br />
storage, shrinkage <strong>and</strong> other trading cost. All these costs are far higher<br />
compared to Thail<strong>and</strong>. Thail<strong>and</strong> had the least cost at US$0.66 per kilo for large<br />
farms. Malaysia comes out to have the highest at US$1.08 per kilo. The<br />
Philippines had the highest wholesale cost per kilo of pork at US$1.42 per kilo for<br />
small farms compared to Indonesia <strong>and</strong> Malaysia at UA$1.27 <strong>and</strong> US$1.26 per<br />
kilo, respectively. Thail<strong>and</strong> had the lowest wholesale cost of US$0.81 per kilo<br />
(STRIVE Foundation <strong>and</strong> UA&P, 2004)<br />
Competitiveness analysis<br />
<strong>5.</strong>8.10 The discussion on competitiveness draws heavily on the Global<br />
Competitiveness <strong>and</strong> Benchmarking Study undertaken by the UA&P Foundation<br />
in 2000.<br />
5- 60
<strong>5.</strong>8.11 Pork production has been for domestic consumption as the Philippines is<br />
not allowed to export due to the FMD issue. Moreover, pork domestic prices were<br />
not competitive with the export parity price as the export parity/domestic price<br />
ratios were generally less than one at exchange rates between P3<strong>5.</strong>00 <strong>and</strong><br />
P40.00 to a dollar. The price is not competitive due to the relatively high per unit<br />
cost of production brought about by high feed costs especially corn. (UA&P<br />
Foundation, 2000)<br />
<strong>5.</strong>8.12 The analysis of the import parity/domestic price comparisons showed that<br />
domestic wholesale prices of pork were not competitive with price of pork<br />
imports. The price ratios were all less than one at different exchange rates (P35,<br />
P40, <strong>and</strong> P45) implying that price is not competitive. Devaluation of peso does<br />
not make local pork competitive. Locally produced pork, however, has a natural<br />
protection under the import regime since local consumers prefer fresh/chilled<br />
pork, rather than frozen pork.<br />
<strong>5.</strong>8.13 In terms of cost, the analysis showed that in general, the Philippines had<br />
no competitive advantage in pork export. Results of the estimation showed that<br />
at different exchange rates <strong>and</strong> at different production systems showed that the<br />
Philippines is generally not an efficient producer of pork to substitute imports.<br />
The RCRs, the indicators of global competitiveness were generally more than<br />
one, implying that local piggeries were not competitive.<br />
SWOT Analysis<br />
<strong>5.</strong>8.14 The hog industry has a large domestic market. Other strengths include<br />
the presence of commercial raisers (about 23%) with production <strong>and</strong><br />
technologies that can address global st<strong>and</strong>ards. There is high degree of<br />
organization among producers. Among the industry advantages is the high<br />
utilization of pork by-products.<br />
<strong>5.</strong>8.15 The industry’s major weakness is the high cost of production which<br />
makes it not competitive in the global market. Hog raisers attribute the high cost<br />
of production to at least two factors: high feed costs <strong>and</strong> high logistics costs for<br />
swine <strong>and</strong> feedgrains. The former is caused by the high tariff on corn as well as<br />
the high import dependence on other feed ingredients <strong>and</strong> biologics. Moreover,<br />
the industry is dominated by backyard raisers (77%) with high incidence of<br />
technical inefficiencies<br />
<strong>5.</strong>8.16 The potential market for pork is large at more than 80 million people <strong>and</strong><br />
growing at over 2% annually. The current per capita dem<strong>and</strong> of about 14<br />
kilograms is very low by global st<strong>and</strong>ards which provide more room to increase<br />
consumption. Access to competitively-priced feeds <strong>and</strong> best practice<br />
technologies especially among backyard raisers are needed to improve industry<br />
performance.<br />
5- 61
<strong>5.</strong>8.17 Threats of unknown diseases <strong>and</strong> entry of imported pork still continue.<br />
There is also need to address the cost of imported feeds, which include corn,<br />
soybean meal <strong>and</strong> fishmeal.<br />
Table <strong>5.</strong>8.3. SWINE INDUSTRY: SWOT Analysis<br />
Strengths Weaknesses<br />
Inputs<br />
1. Available production technology 1. High feeds cost<br />
2. Heavy dependence of imported feed<br />
ingredients<br />
Farm Production<br />
2. Dominated by small producers with 3. Inadequate program for disease<br />
poor production performance<br />
control<br />
3. High degree of organization of 4. High incidence of technical<br />
producers.<br />
inefficiencies<br />
4. Access to good genetics <strong>and</strong><br />
global technologies<br />
<strong>5.</strong> Educated entrepreneurs <strong>and</strong> farm<br />
managers<br />
Logistics<br />
6. Available infrastructure <strong>5.</strong> High cost of logistics for swine <strong>and</strong><br />
feedgrains.<br />
6. Lack of dedicated or specialized<br />
logistics due to low volume <strong>and</strong><br />
prioritization problems<br />
Processing<br />
7. Available processing technologies 7. Prevalence of poor quality abbatoir<br />
8. Non observance of product<br />
st<strong>and</strong>ards<br />
Marketing<br />
8. Large domestic market. 9. Low purchasing power of the<br />
masses<br />
9. High utilization of pork byproducts.<br />
Opportunities Threats<br />
1. Growing domestic market 1. Entry of imported pork<br />
2. Bargaining power of retailers<br />
3. Environmental compliance<br />
4. Urbanization (communities<br />
encroaching on swine growing areas<br />
5- 62
<strong>5.</strong>9 BROILER<br />
Production<br />
<strong>5.</strong>9.1 Production increased by 8.21% per annum from 679,000 tons in 1993 to<br />
930,000 tons in 1997. The tremendous increase in chicken imports in 1995 (2<br />
million birds) resulted in a bumper broiler output in 1996 <strong>and</strong> 1997. Output<br />
however dropped to -1.1% as integrators limited their production to prevent the<br />
glut <strong>and</strong> recover losses in the past years. Despite this drop however, the industry<br />
was able to recover in 1999 <strong>and</strong> posted an average annual growth of <strong>5.</strong>9% from<br />
1999 to 2004.<br />
Figure <strong>5.</strong>9.1. BROILER: Volume of Production, 1993-2004<br />
Quantity ('000 tons)<br />
1,400<br />
1,200<br />
1,000<br />
800<br />
600<br />
400<br />
200<br />
0<br />
Source: BAS<br />
93 94 95 96 97 98 99 00 01 02 03 04<br />
<strong>5.</strong>9.2 Compared to 1993 levels, production performed better in 1999-2004 than<br />
in 1993-1998. Output in 2004 was 78% higher than in 1993.<br />
Figure <strong>5.</strong>9.2. BROILER: Production Index, 1993-2004<br />
Production index (1993=100)<br />
200<br />
150<br />
100<br />
50<br />
0<br />
93 94 95 96 97 98 99 00 01 02 03 04<br />
Source of basic data: BAS<br />
5- 63
<strong>5.</strong>9.3 The biggest regional producers of broilers are Southern Tagalog <strong>and</strong><br />
Central Luzon. Central Luzon managed to increase its share to total production<br />
from only 27% in 1993 to 29% in 1998 <strong>and</strong> further to 31% in 2004 surpassing<br />
Southern Tagalog which used to be the leading producer in 1993. Other big<br />
producers are Central <strong>and</strong> Western Visayas <strong>and</strong> Davao Region.<br />
Figure <strong>5.</strong>9.3. BROILER: Regional Distribution of Production, 1993, 1998 <strong>and</strong> 2004<br />
Others<br />
1993<br />
Total: 678,760 tons<br />
22% Central<br />
Central<br />
Visay as<br />
6%<br />
Southern<br />
Tagalog<br />
31%<br />
Western<br />
Visay as<br />
6%<br />
Source of basic data: BAS<br />
Dav ao<br />
Region<br />
8%<br />
Others<br />
27%<br />
Luzon<br />
27%<br />
Others<br />
23%<br />
2004<br />
Total: 1,231,794 tons<br />
Western<br />
Visay as<br />
5%<br />
Central<br />
Luzon<br />
31%<br />
Central<br />
Visay as<br />
7%<br />
Dav ao<br />
Region<br />
7%<br />
1998<br />
Total: 919,449 tons<br />
Central<br />
Visay as<br />
7%<br />
Calabarzon<br />
23%<br />
Central<br />
Luzon<br />
29%<br />
Western<br />
Visay as<br />
8%<br />
Dav ao<br />
Region<br />
8%<br />
Southern<br />
Tagalog<br />
25%<br />
5- 64
Trade<br />
<strong>5.</strong>9.4 Imports of chicken meat <strong>and</strong> meat cuts are being undertaken to beef up<br />
local supply. Total imports fluctuated during the past 12 years through 2004<br />
ranged from a low of 106 tons in 1993 to a high of 29,000 tons in 1999. Imports<br />
were minimal in 1995 as many integrators pursued expansion activities owing to<br />
the FMD outbreak in pork. However, following the lifting of import restrictions in<br />
1996, frozen imports surged in 1997-1999. Imports reached 20,300 tons in 2004<br />
which is more than 50% from the previous year. This is a repeat of the 1999<br />
scenario when influx of imported chicken meat was a record high. During the<br />
period, the out-quota tariff on poultry has been reduced to 50% which made the<br />
imported US leg quarters even cheaper.<br />
<strong>5.</strong>9.5 The Philippines is not competitive in the export market due to high cost of<br />
production. The year 2004 was blessed one for the industry because the country<br />
was spared from the Avian Influenza (AI) epidemic which hits a number of Asian<br />
countries. This provided an opportunity for the country to export ready-to-cook<br />
processed chicken to Japan whose imports from AI infected countries like<br />
Thail<strong>and</strong> were restricted.<br />
<strong>5.</strong>9.6 In terms of volume indices pegged at 1993 levels, imports exhibited an<br />
erratic trend with peaks in 1999 <strong>and</strong> 2004.<br />
Figure <strong>5.</strong>9.4. BROILER: Production <strong>and</strong> Import Volume Index, 1993-2004<br />
Volume index (1993=100)<br />
30,000<br />
25,000<br />
20,000<br />
15,000<br />
10,000<br />
5,000<br />
-100<br />
(5,000)<br />
93 94 95 96 97 98 99 00 01 02 03 04<br />
Source of basic data: BAS <strong>and</strong> NSO<br />
5- 65
Benchmarking with Relevant Asian Countries<br />
<strong>5.</strong>9.7 The top three broiler producers are China, India <strong>and</strong> Japan. <strong>Performance</strong><br />
levels among selected Asian countries showed that the Philippines is far behind<br />
these countries. Production growth from 1993-1998 was increasing for most of<br />
the countries except for Indonesia <strong>and</strong> Japan. However, a marked improvement<br />
in production was observed from 1999-2004 including the Philippines with 34%<br />
growth.<br />
Table <strong>5.</strong>9.1. BROILER: Comparative Production of Selected Asian<br />
Countries, 1993, 1998 <strong>and</strong> 2004<br />
Production (ton)<br />
Country<br />
1993 1998 2004<br />
China 4,571,943 7,954,083 9,895,485<br />
India 560,000 710,000 1,650,000<br />
Indonesia 687,634 604,707 1,190,900<br />
Japan 1,318,000 1,211,671 1,241,981<br />
Korea 361,000 349,746 386,000<br />
Malaysia 606,000 675,000 825,466<br />
Philippines 346,600 491,230 658,123<br />
Singapore 80,000 82,248 68,726<br />
Thail<strong>and</strong> 943,000 1,097,000 878,489<br />
Viet Nam 120,000 239,200 316,409<br />
Source of basic data: FAO<br />
<strong>5.</strong>9.8 Based on the study conducted in 2004, in terms of technical production<br />
parameters, Indonesia seemed to have the highest feed efficiency among broiler<br />
integrators with feed conversion ratio of 1.5 to 1.7. The Philippines, Thail<strong>and</strong> <strong>and</strong><br />
Malaysia had identical FCR for integrators ranging from 1.9 to 2.1. It is also<br />
noted that integrators across countries had higher percentage of livability <strong>and</strong><br />
shorter days of growing (STRIVE Foundation <strong>and</strong> UA&P, 2004).<br />
<strong>5.</strong>9.9 The Philippines came out to be the most expensive producer of chicken in<br />
1993 among selected Asian countries. However this position was not sustained<br />
as Philippine prices went down in 1998 <strong>and</strong> 2002. Nevertheless, the significant<br />
decrease in 2002 Philippine prices saw the country with lower prices than<br />
Indonesia <strong>and</strong> Japan.<br />
5- 66
Table <strong>5.</strong>9.2. BROILER: Comparative Producer Prices of Selected Asian<br />
Countries, 1993, 1998 <strong>and</strong> 2002<br />
Price ($/ton)<br />
Country<br />
1993 1998 2002<br />
China 887.37 64<strong>5.</strong>97 523.50<br />
India 954.65 1,136.60 994.80<br />
Indonesia 1,106.80 558.74 1,030.37<br />
Japan 1,670.86 1,333.74 1,380.49<br />
Korea 1,397.83 926.19 918.40<br />
Philippines 1,864.68 1,338.86 1,152.24<br />
Thail<strong>and</strong> 89<strong>5.</strong>34 77<strong>5.</strong>16 713.69<br />
Source of basic data: FAO <strong>and</strong> IFS<br />
<strong>5.</strong>9.10 Based on the study conducted in 2004, Thail<strong>and</strong> appeared to have the<br />
lowest wholesale cost of broiler at US$0.56-0.59 per kilo. The major reasons<br />
were the cost of feeds, DOCs, labor, processing, transport <strong>and</strong> h<strong>and</strong>ling costs.<br />
In contrast, the Philippines had the highest wholesale cost of broiler ranging from<br />
US$1.13-1.14 per kilo (Strive Foundation <strong>and</strong> UA&P, 2004).<br />
Competitiveness analysis<br />
<strong>5.</strong>9.11 Based on the study conducted in 2000, domestic broiler production is not<br />
competitive in the export market. The export parity/domestic price ratios were<br />
generally less than one at exchange rates between P3<strong>5.</strong>00 <strong>and</strong> P40.00 per dollar<br />
implying that broler domestic prices were not competitive with the export parity<br />
price. This price uncompetitiveness could be due to the relatively high per unit<br />
cost of production attributed to high feed costs especially corn. (UA&P<br />
Foundation, 2000)<br />
<strong>5.</strong>9.12 The analysis of the import parity/domestic price comparisons showed that<br />
domestic wholesale prices of chicken were not competitive with price of chicken<br />
imports. The price ratios were all less than one at different exchange rates (P35,<br />
P40, <strong>and</strong> P45) implying not price competitive with imports (UA&P Foundation,<br />
2000)<br />
<strong>5.</strong>9.13 In terms of cost, the analysis showed that in general, the Philippines had<br />
no competitive advantage in chicken export except marginal competitiveness for<br />
some benchmark farms at the exchange rate of P4<strong>5.</strong> Results of the estimation<br />
showed that at different exchange rates <strong>and</strong> at different production systems<br />
showed that the Philippines is generally not a competitive with imports.<br />
5- 67
SWOT Analysis<br />
<strong>5.</strong>9.14 The chicken broiler industry has a large domestic market with a sizable<br />
institutional market (fastfood chains). It is dominated by integrators (about 80%)<br />
with production <strong>and</strong> technologies that can address global st<strong>and</strong>ards. There are<br />
sufficient feed milling plants <strong>and</strong> toll processing plants which support industry<br />
activities.<br />
<strong>5.</strong>9.15 Among the weaknesses is the high cost of chicken. Growers attribute<br />
the high cost of chicken to at least two factors: high feed costs <strong>and</strong> inflexible<br />
pricing of retailers in the wet markets. The former is caused by the high tariff on<br />
corn as well as the high import dependence of farm inputs. Low income <strong>and</strong> high<br />
cost of chicken combine, make the per capita consumption (8 kilograms<br />
annually) relatively low. The average Malaysian <strong>and</strong> Thais consume about 30 kg<br />
<strong>and</strong> 15 kg, respectively. The low per capita consumption, however, can be<br />
considered an opportunity because as income increases, dem<strong>and</strong> for chicken<br />
would increase.<br />
<strong>5.</strong>9.16 The potential market of chicken is large at more 80 million people <strong>and</strong><br />
growing at over 2% annually. The current per capita dem<strong>and</strong> of 8 kilograms is<br />
very low by global st<strong>and</strong>ards which provide more room to increase consumption.<br />
The presence of institutional market such as fast food chains can boost<br />
consumption as eating out share on food spending continues to grow. Access to<br />
competitively-priced feeds <strong>and</strong> best practice technologies, as well as good<br />
market knowledge, are qualities needed to enter the export market.<br />
Developments in processing processing/value added products like yakitori<br />
chicken opens export potential to the industry.<br />
<strong>5.</strong>9.17 Threats amid global competition continue due to the high cost of locally<br />
produced chicken which deters more consumption <strong>and</strong> encourages imports. The<br />
entry of cheap imported chicken parts (e.g. leg quarter) still poses threat to<br />
industry players. Chicken leg quarters are perceived inferior in many western<br />
countries which prefer white (breast) meat. There is also need to address the<br />
cost of imported feeds, which include corn, soybean meal <strong>and</strong> fishmeal.<br />
5- 68
Table <strong>5.</strong>9.3. BROILER INDUSTRY: SWOT Analysis<br />
Strengths Weaknesses<br />
Inputs<br />
1. Access to feed <strong>and</strong> production<br />
technologies<br />
1. High feed cost: high tariff on corn;<br />
high import dependence of farm inputs<br />
2. Sufficient feedmilling plants 2. High cost of imported equipment<br />
Farm Production<br />
3. Presence of integrators 3. High cost of chicken<br />
Achieving good technical efficiencies 4. Limited feed efficiency due to<br />
(i.e. FCR)<br />
preference for small birds<br />
Logistics<br />
4. Presence of needed infrastructure <strong>5.</strong> High logistics costs<br />
<strong>5.</strong> Presence of toll processing plants<br />
Marketing<br />
6. Large domestic market 6. Low per capita consumption<br />
7. Large institutional markets 7. Inflexible pricing of retailers<br />
8. Established marketing system<br />
Opportunities Threats<br />
1. Growing domestic market of 80M 1. Entry of cheap imported chicken<br />
people<br />
parts<br />
2. Growing eating out spending 2. High price of domestic chicken<br />
3. Low per capita consumption<br />
4. Export potential<br />
<strong>5.</strong> Developments in processing/valueadded<br />
products<br />
3. High cost of feeds<br />
5- 69
<strong>5.</strong>10 CHICKEN EGG<br />
Production<br />
<strong>5.</strong>10.1 Domestic production comes from two sources: commercial <strong>and</strong> native<br />
chicken. Output rose by about 4% annually from 202,100 tons in 1993 to 296,576<br />
tons in 2004. The growth was due to increased investment (number of chicken<br />
layers) <strong>and</strong> improved egg-laying efficiency ratio.<br />
<strong>5.</strong>10.2 From 1993 to 1998, production increased by 3% per year while it grew<br />
faster at 5% per year from 1999 to 2004. Production only declined in 1994 when<br />
the importation of layer breeders was reduced.<br />
Figure <strong>5.</strong>10.1. CHICKEN EGG: Volume of Production, 1993-2004<br />
Quantity (tons)<br />
350,000<br />
300,000<br />
250,000<br />
200,000<br />
150,000<br />
100,000<br />
50,000<br />
0<br />
Source: BAS<br />
93 94 95 96 97 98 99 00 01 02 03 04<br />
<strong>5.</strong>10.3 In 2004, volume of production was 47 percent higher than in 1993. Output<br />
from 1999 to 2004 grew faster compared to production from 1993 to 1998.<br />
Figure <strong>5.</strong>10.2. CHICKEN EGG: Production Index, 1993-2004<br />
Production index (1993=100)<br />
160<br />
140<br />
120<br />
100<br />
80<br />
60<br />
40<br />
20<br />
0<br />
93 94 95 96 97 98 99 00 01 02 03 04<br />
Source of basic data: BAS<br />
5- 70
<strong>5.</strong>10.4 Chicken egg is produced mainly from Southern Tagalog, Central Luzon<br />
<strong>and</strong> Central Visayas. The three regions accounted for an average of 50% from<br />
1993 to 2004. The key producing provinces include Batangas, Rizal, Bulacan,<br />
Nueva Ecija <strong>and</strong> Cebu, where layer farms <strong>and</strong> these are near large markets.<br />
Figure <strong>5.</strong>10.3. CHICKEN EGG: Regional Distribution of Production, 1993,<br />
1998 <strong>and</strong> 2004<br />
Western<br />
Visay as<br />
9%<br />
Others<br />
34%<br />
1993<br />
Total: 202,100 tons<br />
Central<br />
Visay as<br />
10%<br />
Source of basic data: BAS<br />
Trade<br />
Southern<br />
Tagalog<br />
23%<br />
Dav ao<br />
Region<br />
10%<br />
Bicol<br />
Region<br />
8%<br />
Central<br />
Luzon<br />
14%<br />
2004<br />
Total: 296,576 tons<br />
Others<br />
30%<br />
Northern<br />
Mindanao<br />
8%<br />
Central<br />
Visay as<br />
11%<br />
Western<br />
Visay as<br />
9%<br />
Calabarzon<br />
28%<br />
Central<br />
Luzon<br />
15%<br />
1998<br />
Total: 227,038 tons<br />
Others<br />
33%<br />
Dav ao<br />
Region<br />
9%<br />
Southern<br />
Tagalog<br />
Central<br />
25%<br />
Visay as<br />
<strong>5.</strong>10.5 The country imports a small amount of egg <strong>and</strong> egg products. Total<br />
import value grew by 10% per year from 1993 to 2004. The major suppliers in<br />
1993 were Denmark, Germany <strong>and</strong> Netherl<strong>and</strong>s while in 2004 were Denmark,<br />
USA <strong>and</strong> India.<br />
<strong>5.</strong>10.6 Importations comprised mostly of egg products (processed) such as<br />
powdered, dried <strong>and</strong> other than dried. Import value of processed eggs<br />
accelerated by 12% over the 12 year period. At present, the country does not<br />
10%<br />
Central<br />
Luzon<br />
14%<br />
5- 71
produced processed eggs. Mayonnaise manufacturers <strong>and</strong> bakers, however, are<br />
increasingly using processed eggs because it is convenient <strong>and</strong> economical.<br />
Though, imports during 1993 to 1998 grew faster than in later years.<br />
<strong>5.</strong>10.7 By contrast, table eggs imports were volatile. During 1993 to 1995,<br />
imports decreased by 2% per year. There were no registered importations in the<br />
next three years but from 1999 to 2004 the country’s imports dropped by an<br />
average annual growth of 14%. Over the period, table egg imports comprised an<br />
insignificant portion of supply.<br />
Figure <strong>5.</strong>10.4. CHICKEN EGG: Production <strong>and</strong> Import Volume Index by<br />
Product Type, 1993-2004<br />
Volume index<br />
(1993=100)<br />
700<br />
600<br />
500<br />
400<br />
300<br />
200<br />
100<br />
0<br />
Production<br />
Pow dered imports<br />
Egg y olk, other than dried imports<br />
93 94 95 96 97 98 99 00 01 02 03 04<br />
Source of basic data: BAS <strong>and</strong> NSO<br />
Benchmarking with Relevant Asian Countries<br />
<strong>5.</strong>10.8 The Philippine egg industry primarily serves the domestic market. It is<br />
relatively small compared to the top producers in Asia - China <strong>and</strong> India. By<br />
industry size, the Philippines is a little over half of Indonesia <strong>and</strong> is slightly bigger<br />
than Malaysia <strong>and</strong> Thail<strong>and</strong>.<br />
Table <strong>5.</strong>10.1. CHICKEN EGG: Comparative Production of Selected Asian<br />
Countries, 1993, 1998 <strong>and</strong> 2004<br />
Country Production (ton)<br />
1993 1998 2004<br />
China 9,685,700 17,531,550 23,501,250<br />
India 1,329,000 1,623,000 2,464,000<br />
Indonesia 448,305 392,892 857,370<br />
Malaysia 350,000 383,000 431,004<br />
Philippines 335,000 528,000 480,000<br />
Thail<strong>and</strong> 426,000 535,563 393,360<br />
Viet Nam 115,000 161,333 197,000<br />
Source: FAO<br />
5- 72
<strong>5.</strong>10.9 During 1993 to 2002, India had the lowest producer price while Indonesia<br />
had the highest. In 2002, the producer prices of a ton eggs in the Philippines at<br />
US$1,213 was higher by US$722 than India but US$743 lower than Indonesia.<br />
Table <strong>5.</strong>10.2. CHICKEN EGG: Comparative Producer Prices of Selected<br />
Asian Countries, 1993, 1998 <strong>and</strong> 2002<br />
Country Producer Prices (US$/ton)<br />
1993 1998 2002<br />
China 861 695 556<br />
India 335 529 492<br />
Indonesia 3,141 1,085 1,956<br />
Philippines 1,583 1,293 1,213<br />
Thail<strong>and</strong> 643 804 792<br />
Source: FAO <strong>and</strong> IFS<br />
Competitiveness Analysis<br />
<strong>5.</strong>10.10 Chicken eggs are not price competitive in the export market but<br />
competitive with imports in the domestic market at P35, P40 <strong>and</strong> P45 exchange<br />
rates. Meanwhile, based on resource cost ratios (RCR) <strong>and</strong> varying exchange<br />
rates, chicken eggs have competitive advantage only under import substitution<br />
regime. The RCRs obtained across farms were less than one (UA&P Foundation,<br />
2000). In another study, local table eggs are price competitive with imports at<br />
P55 exchange rate but not at P45 <strong>and</strong> indifferent at P50 (Strive Foundation,<br />
2000).<br />
<strong>5.</strong>10.11 Based on technical parameters such as laying rate, number of eggs<br />
produced, <strong>and</strong> FCR, the medium-sized chicken layer farms were the most<br />
efficient in the Philippines while large layer farms produced more eggs in Asian<br />
countries like Thail<strong>and</strong>, Malaysia <strong>and</strong> Indonesia. Moreover, the medium-sized<br />
farms in the country were more profitable compared to large farms. By contrast,<br />
large farms earned more in Thail<strong>and</strong> <strong>and</strong> Malaysia (Strive Foundation <strong>and</strong> UA&P,<br />
2004).<br />
SWOT Analysis<br />
<strong>5.</strong>10.12 The strengths, weaknesses, opportunities <strong>and</strong> threats identified below<br />
are factors that largely affect the chicken egg industry.<br />
<strong>5.</strong>10.13 Among the advantages of the industry are the growing institutional<br />
market which offers wider product offerings especially in their breakfast line that<br />
usually includes eggs; the key players have the capability to produce their own<br />
feeds <strong>and</strong> possess the technical know-how on the operations of the business;<br />
<strong>and</strong> a medium sized cooked egg is equivalent to one serving of meat making it<br />
the cheapest source of protein. Moreover, a large potential is seen given the low<br />
domestic per capita consumption <strong>and</strong> growing population.<br />
5- 73
<strong>5.</strong>10.14 Meanwhile, the major constraints of the industry are: production cost -<br />
the rising costs of imported farm inputs like soybean meal, fishmeal, biologics<br />
<strong>and</strong> medications; <strong>and</strong> market-presence of low-priced substitutes like noodles <strong>and</strong><br />
canned sardines.<br />
Table <strong>5.</strong>10.3. CHICKEN EGG INDUSTRY: SWOT Analysis<br />
STRENGTHS WEAKNESSES<br />
Inputs<br />
1. High cost of feeds<br />
2. Alternative local feeds supply<br />
undeveloped<br />
Production<br />
1. Access to feed <strong>and</strong> production 3. Limited l<strong>and</strong> access<br />
technologies<br />
2. Achieving good technical<br />
4. Occurrence of diseases<br />
efficiencies<br />
Logistics<br />
<strong>5.</strong> High transport cost<br />
Marketing<br />
3. Large institutional market 6. Strong retail price fixing<br />
4. Absence of ethnic taboo 7. Negative impression on eggs<br />
<strong>5.</strong> Cheapest source of protein<br />
6. Easy to prepare<br />
8. Poor market information<br />
OPPORTUNITIES THREATS<br />
1. Growing domestic market 1. Presence of lower priced<br />
substitutes<br />
2. Low per capita consumption 2. High cost of farm inputs<br />
3. Increasing eating-out <strong>and</strong> baked 3. Entry of imported processed eggs<br />
products spending<br />
Source: Layer Industry Master Plan, 2002<br />
(i.e. powdered <strong>and</strong> frozen)<br />
5- 74
<strong>5.</strong>11 MILKFISH<br />
Production<br />
<strong>5.</strong>11.1 Milkfish continues to be an important part of the fish supply in the country.<br />
It accounts for 50% of total fisheries supply from aquaculture (excluding<br />
seaweeds). Although, milkfish is known to grow in marine <strong>and</strong> freshwaters pens<br />
<strong>and</strong> cages, it is mainly cultured in brackish water fishponds. At present, there are<br />
more than 176,000 hectares of ponds <strong>and</strong> 5,000 hectares of pens operated for<br />
milkfish production (Lopez, 2005).<br />
<strong>5.</strong>11.2 Production grew by about 6% per year from 148,970 tons 1993 to 274,150<br />
tons in 2004. From 1993 to 1998, production grew at a modest rate of 2% per<br />
year. The increase in output was attributed to the favorable weather condition,<br />
better quality of fry/fingerlings, rehabilitation of ponds, pens <strong>and</strong> cages <strong>and</strong><br />
improved technology in brackish water fishponds.<br />
<strong>5.</strong>11.3 By contrast, production grew rapidly during 1999 to 2004 with an average<br />
annual growth rate of about 9%. The growth was due to the programs (e.g.<br />
dispersal of fry/fingerlings) supported by government organizations such as the<br />
Bureau of Fisheries <strong>and</strong> Aquatic Resources, Local Government Units <strong>and</strong><br />
QUEDANCOR, non-occurrence of calamities <strong>and</strong> increased stocking density.<br />
The notable growth in 2000 <strong>and</strong> 2004 were largely driven by the expansion of<br />
area harvested, rehabilitation of unused ponds, availability of good quality<br />
fry/fingerlings <strong>and</strong> continuous support from government organizations.<br />
Figure <strong>5.</strong>11.1. MILKFISH: Volume of Production, 1993-2004<br />
Quantity (tons)<br />
300,000<br />
250,000<br />
200,000<br />
150,000<br />
100,000<br />
50,000<br />
-<br />
Source: BAS<br />
93 94 95 96 97 98 99 00 01 02 03 04<br />
<strong>5.</strong>11.4 In 2004, volume of production is 84 percent higher than in 1993.<br />
Production from 1999 to 2004 grew faster with more investments compared to<br />
the output during 1993 to 1998.<br />
5- 75
Figure <strong>5.</strong>11.2. MILKFISH: Production Index, 1993-2004<br />
Production index<br />
(1993=100)<br />
200<br />
150<br />
100<br />
-<br />
50<br />
93 94 95 96 97 98 99 00 01 02 03 04<br />
Source of basic data: BAS<br />
<strong>5.</strong>11.5 The regions with the highest surplus production include Western Visayas,<br />
Central Luzon <strong>and</strong> Ilocos Region. The top four producing regions accounting for<br />
at least 70% of production from 1993 to 2004 are Western Visayas, Central<br />
Luzon, Ilocos Region <strong>and</strong> Southern Tagalog. Regional shares have been<br />
relatively at the same level in since 1993 for Western Visayas <strong>and</strong> Central Luzon.<br />
Meanwhile, Ilocos Region has been increasing its slice of the output at the<br />
expense of Southern Tagalog.<br />
Figure <strong>5.</strong>11.3. MILKFISH: Regional Distribution of Production, 1993, 1998<br />
<strong>and</strong> 2004<br />
Dav ao<br />
Region<br />
6%<br />
Ilocos<br />
Region<br />
8%<br />
1993<br />
Total: 148,965 tons<br />
Others<br />
18%<br />
Central<br />
Luzon<br />
21%<br />
Southern<br />
Tagalog<br />
23%<br />
Western<br />
Visay as<br />
24%<br />
Central<br />
Visay as<br />
4%<br />
Ilocos<br />
Region<br />
11%<br />
1998<br />
Total: 165,458 tons<br />
Others<br />
19%<br />
Central<br />
Luzon<br />
19%<br />
Western<br />
Visay as<br />
27%<br />
Southern<br />
Tagalog<br />
20%<br />
5- 76
SOCCSK-<br />
SARGEN<br />
Source of basic data: BAS<br />
Trade<br />
5%<br />
Southern<br />
Tagalog<br />
13%<br />
2004<br />
Total: 274,151 tons<br />
Others<br />
19%<br />
Ilocos<br />
Region<br />
18%<br />
Western<br />
Visay as<br />
<strong>5.</strong>11.6 The country exports milkfish in the following forms: frozen, fresh/chilled,<br />
dried, smoked, whole or in pieces, in airtight containers (ex. canned, bottled,<br />
vacuum packed), or whole or in pieces, not in airtight containers. Total exports<br />
grew by about 20% per year to US$ 3.4 million in 2004 from US$ 1.2 million in<br />
1993. Total export trend was worrisome during 1993 to 1998 as it declined by 6%<br />
per year. The trend was reversed thereafter when milkfish exports especially<br />
whole <strong>and</strong> smoked forms gained growth from 1999 to 2004. The biggest total<br />
export was in 2004 with USA as the largest market where Filipino immigrants are<br />
believed to be the buyers.<br />
<strong>5.</strong>11.7 By product form, exports have performed differently from 1993 to 2004.<br />
Over the period, export volume of frozen milkfish was erratic while fresh/chilled<br />
was relatively stable. On the contrary, whole milkfish increased noticeably over<br />
the period from a low base in 1993. Since 2000, as production improved the<br />
country increasingly shifted exports to whole milkfish.<br />
24%<br />
Central<br />
Figure <strong>5.</strong>11.4. MILKFISH: Production <strong>and</strong> Export Volume Index by Product<br />
Type, 1993-2004<br />
Volume index<br />
(1993=100)<br />
700<br />
600<br />
500<br />
400<br />
300<br />
200<br />
100<br />
-<br />
Production Frozen ex ports<br />
Whole ex ports Fresh ex ports<br />
93 94 95 96 97 98 99 00 01 02 03 04<br />
Source of basic data: BAS <strong>and</strong> NSO<br />
Luzon<br />
21%<br />
5- 77
Benchmarking with Relevant Asian Countries<br />
<strong>5.</strong>11.8 In 2004, the Philippines produced 273,590 tons of milkfish making it the<br />
largest producer in the world. It was followed by Indonesia at 241,440 tons. The<br />
two countries accounted for about 90% of the total output. Moreover, both mainly<br />
cultured milkfish in brackish water.<br />
Table <strong>5.</strong>11.1. MILKFISH: Comparative Production of Selected Asian<br />
Countries, 1993, 1998 <strong>and</strong> 2004<br />
Production (ton)<br />
Country<br />
1993 1998 2004<br />
Indonesia 164,448 158,666 241,438<br />
Philippines<br />
Source: FAO<br />
148,965 162,458 273,592<br />
Competitiveness Analysis<br />
<strong>5.</strong>11.9 Despite being the world’s largest producer, the Philippines lags behind<br />
other major producers like Indonesia <strong>and</strong> Taiwan in technological advancement.<br />
Nonetheless, it remains to be a viable venture because of high the local market<br />
dem<strong>and</strong> (To, 2003).<br />
<strong>5.</strong>11.10 Local consumers still prefer fresh/chilled milkfish in wet markets <strong>and</strong> fish<br />
port complexes as prices are cheaper. They tend to be discriminating on frozen<br />
fish. Moreover, services such as gutting or cleaning of milkfish are offered in<br />
most local public markets <strong>and</strong> large supermarkets to attract buyers.<br />
SWOT Analysis<br />
<strong>5.</strong>11.11 Milkfish is an important commodity in the country. The industry has<br />
several strengths such as improving farming technology, expansion of utilized<br />
areas <strong>and</strong> growing market dem<strong>and</strong>. It is, however, still confronted with<br />
constraints such as inadequate fry supply, high cost of farm inputs, lack of<br />
technology for value-added <strong>and</strong> multi-layered marketing system.<br />
<strong>5.</strong>11.12 The following are the strengths, weaknesses, opportunities <strong>and</strong> threats<br />
of the milkfish industry.<br />
5- 78
Table <strong>5.</strong>11.2. MILKFISH INDUSTRY: SWOT Analysis<br />
STRENGTHS WEAKNESSES<br />
Inputs<br />
1. Available aquatic resources 1. Insufficient supply of fry<br />
2. High cost of feeds<br />
3. Poor quality feeds<br />
Production<br />
2. Improving farming technology 4. Inadequate extension services<br />
3. Expansion of utilized areas <strong>5.</strong> Low farm gate prices<br />
Processing<br />
6. Lack pf post harvest facilities for<br />
value-adding<br />
Marketing<br />
4. Growing local dem<strong>and</strong> 7. Presence of several marketing<br />
layers<br />
OPPORTUNITIES THREATS<br />
4. Exp<strong>and</strong>ing export market 4. Overproduction<br />
<strong>5.</strong> Value addition potential<br />
Source: Lopez, 2005<br />
5- 79
<strong>5.</strong>12 TILAPIA<br />
Production<br />
<strong>5.</strong>12.1 Production of farmed tilapia grew by about 5% per year from 96,339 tons<br />
in 1993 to 145,868 in 2004. The bulk of tilapia production is from aquaculture<br />
with little contribution from municipal fishing. For aquaculture, freshwater<br />
fishpond <strong>and</strong> fishcages account for about 90% of total production.<br />
<strong>5.</strong>12.2 From 1993 to 1996, tilapia production continually declined. This was due<br />
to water pollution, scarcity of good quality fry <strong>and</strong> typhoons in North <strong>and</strong> South<br />
Luzon. By 1997, output managed to bounce due to favorable weather condition<br />
<strong>and</strong> rehabilitation of pens <strong>and</strong> cages. However, the El Niño phenomenon in the<br />
following year again caused decline in production.<br />
<strong>5.</strong>12.3 By contrast, production steadily increased by 12% per year during 1999 to<br />
2004. The increasing supply was driven by an increase in area harvested,<br />
availability of better quality fingerlings, increase stocking rate using Genetically<br />
Improved Farm Tilapia (GIFT) strain fingerlings, support of the Bureau of<br />
Fisheries <strong>and</strong> Aquatic Resources (BFAR), favorable weather conditions <strong>and</strong><br />
rising consumer dem<strong>and</strong>.<br />
Figure <strong>5.</strong>12.1. TILAPIA: Volume of Production, 1993-2004<br />
Quantity (tons)<br />
160,000<br />
140,000<br />
120,000<br />
100,000<br />
80,000<br />
60,000<br />
40,000<br />
20,000<br />
-<br />
Source: BAS<br />
93 94 95 96 97 98 99 00 01 02 03 04<br />
<strong>5.</strong>12.4 In 2004, volume of production was 51 percent higher than in 1993.<br />
Production grew by 12% per year from 1999 to 2004 while it was relatively<br />
stagnant during 1993 to 1997.<br />
5- 80
Figure <strong>5.</strong>12.2. TILAPIA: Production Index, 1993-2004<br />
Production index<br />
(1993=100)<br />
160<br />
140<br />
120<br />
100<br />
80<br />
60<br />
-<br />
40<br />
20<br />
93 94 95 96 97 98 99 00 01 02 03 04<br />
Source of basic data: BAS<br />
<strong>5.</strong>12.5 The major producers are located in the provinces of Pampanga (Central<br />
Luzon) <strong>and</strong> Batangas (Southern Tagalog). Central Luzon contributes an average<br />
of more than 40% of the country’s production. Meanwhile, Southern Tagalog<br />
increased its contribution from 24% in 1993 to 35% in 1998 but fell to 33% in<br />
2004.<br />
Figure <strong>5.</strong>12.3.TILAPIA: Regional Distribution of Production, 1993, 1998 <strong>and</strong><br />
2004<br />
1993<br />
Total: 96,339 tons<br />
Ilocos<br />
Others<br />
Region<br />
15%<br />
Dav ao 3% Central<br />
Region<br />
7%<br />
Bicol<br />
Region<br />
11%<br />
Southern<br />
Tagalog<br />
24%<br />
Luzon<br />
40%<br />
SOCCSK-<br />
Bicol<br />
Region<br />
8%<br />
SARGEN<br />
4%<br />
1998<br />
Total: 72,023 tons<br />
Ilocos<br />
Region<br />
3%<br />
Southern<br />
Tagalog<br />
35%<br />
Others<br />
6%<br />
Central<br />
Luzon<br />
44%<br />
5- 81
Source of basic data: BAS<br />
Trade<br />
SOCCSK-<br />
SARGEN<br />
7%<br />
Bicol<br />
Region<br />
4%<br />
2004<br />
Total: 145,868 tons<br />
Southern<br />
Tagalog<br />
33%<br />
Cagay an<br />
Region<br />
3%<br />
Others<br />
<strong>5.</strong>12.6 Tilapia products (fresh <strong>and</strong> frozen fillets, whole <strong>and</strong> gutted fish) have<br />
become important commodities in the global seafood trade. The country,<br />
however, ships insignificant volumes abroad. At present, there are no particular<br />
trade data for tilapia as it is lumped with other fishes <strong>and</strong> not classified<br />
separately.<br />
<strong>5.</strong>12.7 Based on USA import data, the Philippines is a small player <strong>and</strong> supplied<br />
mostly frozen whole tilapia with minimal amounts of frozen fillet during 1993 to<br />
2004. Exports were irregular <strong>and</strong> totaled only 24 tons (US $44,000) from 1993 to<br />
1998. The biggest shipment was about 80 tons (US $93,000) in 1999. The<br />
country continually supplied USA from then on but in decreasing volumes.<br />
Aggregate tilapia export to USA amounted 224 tons (US $274,000) from 1999 to<br />
2004.<br />
Benchmarking with Relevant Asian Countries<br />
<strong>5.</strong>12.8 Tilapia, one of the promising aquaculture species, is farmed in at least 85<br />
countries. It is one of the fastest growing aquaculture products because it can<br />
consume a wide extent of food <strong>and</strong> tolerant to poor water quality. The largest<br />
producers of the world are in Asia, namely, China, Philippines, Indonesia <strong>and</strong><br />
Thail<strong>and</strong>.<br />
<strong>5.</strong>12.9 China is the biggest producer accounted for about 50% of the total output<br />
in 2004. Its tilapia farming practices include semi-intensive culture in fertilized<br />
ponds with polyculture system, intensive culture in tanks with monoculture <strong>and</strong><br />
intensive culture in reservoirs.<br />
8%<br />
Central<br />
Luzon<br />
45%<br />
5- 82
<strong>5.</strong>12.10 Meanwhile, the Philippines is far second contributed 8% of the<br />
production. Tilapia culture is mainly in freshwater ponds <strong>and</strong> cages with semiintensive<br />
<strong>and</strong> intensive systems. It pioneered for commercial tilapia cage culture,<br />
application of hormonal sex reversal <strong>and</strong> use of net enclosures for breeding of<br />
tilapias in the region.<br />
<strong>5.</strong>12.11 The next top producers were by Indonesia <strong>and</strong> Thail<strong>and</strong> with about 8%<br />
<strong>and</strong> 5% of the total output, respectively. Farming practices of tilapia in Indonesia<br />
are semi-intensive culture with polyculture, intensive cage culture in rivers,<br />
canals, lakes <strong>and</strong> reservoirs <strong>and</strong> semi-intensive in brackishwater ponds. On the<br />
other h<strong>and</strong>, Thail<strong>and</strong>’s farming practices are extensive culture in rice paddies,<br />
semi-intensive freshwater pond culture with polyculture, intensive culture in<br />
ponds <strong>and</strong> pond culture of tilapia in polyculture system with chicken/duck/pig<br />
farming.<br />
Table <strong>5.</strong>12.1. TILAPIA: Comparative Production of Selected Asian<br />
Countries, 1993, 1998 <strong>and</strong> 2004<br />
Production (ton)<br />
Country<br />
1993 1998 2004<br />
China 191,257 525,926 897,276<br />
Indonesia 61,896 65,894 139,651<br />
Malaysia 6,611 12,625 25,642<br />
Philippines 96,339 72,023 145,869<br />
Thail<strong>and</strong><br />
Source: FAO<br />
54,114 73,809 97,653<br />
Competitiveness Analysis<br />
<strong>5.</strong>12.12 Production is mainly absorbed by the domestic market. Export is<br />
reported to be not competitive at P35 <strong>and</strong> P40 exchange rates. It can be<br />
competitive at P45 exchange rate if there is adequate volume <strong>and</strong> exceptional<br />
quality. In the domestic market, tilapia is competitive as its wholesale price is<br />
lower than the derived import price at varying exchange rates i.e. P35, P40 <strong>and</strong><br />
P4<strong>5.</strong> Domestic resource cost analysis indicates that tilapia is generally<br />
competitive at P35, P40 <strong>and</strong> P45 exchange rates (UA&P Foundation, 2000).<br />
<strong>5.</strong>12.13 At present, the US is the world’s largest importer. The Philippines has<br />
been a small player in this market since the late 90s. Exports were mainly frozen<br />
whole tilapia. From 1999 to 2003, exports have declined <strong>and</strong> none were recorded<br />
in 2002. The unsteady supply of the country is due to the jittery price in the local<br />
wet market. Moreover, domestic small growers who compose bulk of the tilapia<br />
industry are disposed to pole-vault when wet market price is higher.<br />
5- 83
SWOT Analysis<br />
<strong>5.</strong>12.14 The major strengths of the tilapia industry include the availability of the<br />
production areas, availability of quality fingerlings <strong>and</strong> skills of the people. While<br />
the country is one of the top producers, the potential of the industry especially in<br />
the international trade is not fully tapped. The developing market of China <strong>and</strong><br />
huge markets for tilapia product forms <strong>and</strong> by-products are opportunities for the<br />
industry.<br />
<strong>5.</strong>12.15 By contrast, among main constraints are the high cost of inputs i.e.<br />
feeds, poor marketing infrastructure <strong>and</strong> stringent safety <strong>and</strong> quality<br />
requirements on processed fish enforced by the major markets such as USA <strong>and</strong><br />
EU.<br />
Table <strong>5.</strong>12.2. TILAPIA INDUSTRY: SWOT Analysis<br />
STRENGTHS WEAKNESSES<br />
Inputs<br />
2. Available aquatic resources 1. High cost of inputs (feeds <strong>and</strong> fuel)<br />
3. Accessible genetically improved<br />
strains<br />
Production<br />
4. Technological innovation <strong>and</strong> 2. Inadequate extension services<br />
advancements<br />
3. Limited credit assistance<br />
Marketing<br />
2. Strong consumer dem<strong>and</strong> 4. Lack of market information <strong>and</strong><br />
assistance<br />
<strong>5.</strong> Stringent requirements of export<br />
markets<br />
OPPORTUNITIES THREATS<br />
6. Export prospect <strong>5.</strong> Negative environmental impacts of<br />
intensive culture systems<br />
7. Value addition potential 6. <strong>Agricultural</strong> conversion to fishponds<br />
8. Saline tilapia culture 7. Unregulated use of water supply<br />
from aquifers<br />
Source: Tilapia Industry Master Plan, 2002 <strong>and</strong> Guerrero III, R., 2006<br />
5- 84
<strong>5.</strong>13 TUNA<br />
Production<br />
<strong>5.</strong>13.1 Total production from commercial <strong>and</strong> municipal fishing exp<strong>and</strong>ed by 8%<br />
per year from 238,128 tons in 1993 to 525,679 tons in 2004. Over the period,<br />
commercial catch accounted for 64% of the total; the rest came from municipal<br />
fishing. Production from commercial fishing grew by 10% per year while output<br />
from municipal fishing increased by 5% per year.<br />
<strong>5.</strong>13.2 The use of efficient gears <strong>and</strong> favorable weather condition enhanced<br />
production from 1993 to 1998. However, the unfavorable weather condition that<br />
decreased the number of fishing trips caused production to decline in 1995 <strong>and</strong><br />
1996. The more rapid growth during 1999 to 2004 was largely due to the good<br />
weather condition increasing the number of fishing days <strong>and</strong> operation of newly<br />
repaired fishing vessels.<br />
Figure <strong>5.</strong>13.1. TUNA: Volume of Production, 1993-2004<br />
Quantity (tons)<br />
600,000<br />
500,000<br />
400,000<br />
300,000<br />
200,000<br />
100,000<br />
0<br />
Source: BAS<br />
93 94 95 96 97 98 99 00 01 02 03 04<br />
<strong>5.</strong>13.3 In 2004, volume of production was 121 percent higher than in 1993. Tuna<br />
output grew faster from 1999 to 2004 than during 1993 to 1998.<br />
Figure <strong>5.</strong>13.2. TUNA: Production Index, 1993-2004<br />
Production index<br />
(1993=100)<br />
250<br />
200<br />
150<br />
100<br />
50<br />
0<br />
93 94 95 96 97 98 99 00 01 02 03 04<br />
Source of basic data: BAS<br />
5- 85
<strong>5.</strong>13.4 In 1993, Zamboanga Peninsula <strong>and</strong> Metro Manila posted the highest tuna<br />
production (19% each) followed by Southern Tagalong (14%) <strong>and</strong> Davao Region<br />
(11%). By 1998, Zamboanga Peninsula remained the biggest producer<br />
accounting for 26% of total output. The other major producing regions accounting<br />
for 40% of production were Southern Tagalog, NCR <strong>and</strong> Davao Region. In 2004,<br />
SOCCSKSARGEN emerged has the biggest producer resulting from increasing<br />
tuna catch since 2003. It was followed by Zamboanga Peninsula <strong>and</strong> Southern<br />
Tagalog.<br />
Figure <strong>5.</strong>13.3. TUNA: Regional Distribution of Production, 1993, 1998 <strong>and</strong><br />
2004<br />
Central<br />
Visay as<br />
7%<br />
1993<br />
Total: 238,128 tons<br />
Others<br />
24%<br />
Southern<br />
Tagalog<br />
14%<br />
Source of basic data: BAS<br />
Zamboanga<br />
Peninsula<br />
19%<br />
Dav ao<br />
Region<br />
17%<br />
NCR<br />
5%<br />
ARMM<br />
7%<br />
NCR<br />
19%<br />
Western<br />
Visay as<br />
7%<br />
2004<br />
Total: 525,679 tons<br />
Others<br />
24%<br />
Southern<br />
Tagalog<br />
12%<br />
1998<br />
Total: 326,745 tons<br />
Others<br />
27%<br />
Dav ao<br />
Region<br />
11%<br />
SOCCSK-<br />
SARGEN<br />
36%<br />
Zamboanga<br />
Peninsula<br />
16%<br />
NCR<br />
13%<br />
Zamboanga<br />
Peninsula<br />
26%<br />
Southern<br />
Tagalog<br />
16%<br />
5- 86
Trade<br />
<strong>5.</strong>13.5 Total export earnings increased by 2% per year from US$ 150.2 million<br />
FOB in 1993 to US$ 154 million FOB in 2004. The bulk of exports are canned<br />
tuna. Others are in the form of fresh/chilled, frozen <strong>and</strong> smoked tuna. During<br />
1993 to 1997, total receipts posted a moderate growth. It peaked in 1998 due to<br />
surplus catches. However, a sharp decline in 1999 reduced export earnings by<br />
33% mainly due to weak consumer dem<strong>and</strong> especially those from USA. This was<br />
aggravated by high freight costs, inadequate infrastructure <strong>and</strong> weak market<br />
access. Subsequently, total exports grew by 3% per year from 1999 to 2004.<br />
<strong>5.</strong>13.6 Meanwhile, imports were mostly in frozen form. Total import value rose by<br />
12% per year during 1993 to 1998. It amounted to US$ 42 million CIF in 1998,<br />
the highest over the six year period. From 1999 to 2004, total import slowed<br />
down <strong>and</strong> value increased by only 2% per year.<br />
<strong>5.</strong>13.7 In terms of volume, exports grew more rapidly for frozen tuna than canned<br />
tuna from 1993 to 2004. (Caveat: Official statistics for canned tuna exports are<br />
too low compared to industry estimates.) In addition, frozen tuna exports<br />
significantly fell in 2001 when canneries shifted to local catch in raw material use<br />
which was a good thing. Since then more of the local production was used as an<br />
input for the canning industry.<br />
Figure <strong>5.</strong>13.4. TUNA: Production <strong>and</strong> Trade Volume Index by Product Type,<br />
1993-2004<br />
Volume index<br />
(1993=100)<br />
500<br />
400<br />
300<br />
200<br />
100<br />
0<br />
Production Frozen ex ports<br />
Canned ex ports Frozen imports<br />
93 94 95 96 97 98 99 00 01 02 03 04<br />
Source of basic data: BAS <strong>and</strong> NSO<br />
Benchmarking with Relevant Asian Countries<br />
<strong>5.</strong>13.8 Tuna is a major industry that accounts for about 12% of the total<br />
Philippine fish production. The country is among the top producers of tuna in the<br />
world. Japan <strong>and</strong> Taiwan supplied bulk of the world’s production. In 2004, the<br />
Philippines contributed 7% or 278,000 tons (FAO) to total. However, based on<br />
BAS records the country’s tuna catch was over 500,000 tons in the same year.<br />
5- 87
Table <strong>5.</strong>13.1. TUNA: Comparative Production of Selected Asian Countries,<br />
1993, 1998 <strong>and</strong> 2004<br />
Production (ton)<br />
Country<br />
1993 1998 2004<br />
China 6,629 8,130 64,410<br />
India 16,487 3,799 5,872<br />
Indonesia 226,130 390,356 341,948<br />
Philippines<br />
Source: FAO<br />
106,280 199,889 278,000<br />
Competitiveness Analysis<br />
<strong>5.</strong>13.9 The Philippines is competitive in tuna. It is mainly export driven. In terms<br />
of price, the Philippines tuna (skipjack) price is close to Thail<strong>and</strong>. The country<br />
has at best a US$50/ton advantage over Thail<strong>and</strong> due to transport advantage<br />
from the Pacific.<br />
<strong>5.</strong>13.10 On the other h<strong>and</strong>, the Philippines is competitive in most of the fishing<br />
cost items such as crew wage, parts <strong>and</strong> repairs. Although cost competitive, the<br />
country’s fishing fleets are known to suffer inefficiencies due to outmoded<br />
facilities causing price <strong>and</strong> supply uncertainties. According to a study, the fishing<br />
industry is competitive with resource cost ratios of less than one (Gonzales,<br />
1998).<br />
SWOT Analysis<br />
<strong>5.</strong>13.11 The performance of the tuna industry is influenced by many factors.<br />
Some of the advantages are the proximity to fishing ground <strong>and</strong> the presence of<br />
canneries. Meanwhile, the factors that offset the country’s advantages include<br />
high fuel costs, discriminatory tariffs <strong>and</strong> increasing competition from other<br />
countries.<br />
Table <strong>5.</strong>13.2. TUNA INDUSTRY: SWOT Analysis<br />
STRENGTHS WEAKNESSES<br />
Inputs<br />
1. Proximity to Pacific fishing grounds 1. High fuel cost<br />
2. Small fleets<br />
Production<br />
3. Limited capacity of fishports<br />
4. Gaps in facilities (cold storage)<br />
<strong>5.</strong> Inadequate long-term finance<br />
Logistics<br />
2. Established infrastructure in<br />
General Santos<br />
5- 88
Processing<br />
3. Presence of canneries<br />
Marketing<br />
4. Established marketing system <strong>5.</strong> No br<strong>and</strong> identity<br />
OPPORTUNITIES THREATS<br />
1. Growing global market 1. Depletion of fish resources<br />
2. Improving catching technologies 2. Uncontrolled illegal fishing<br />
3. Limited access to rich exclusive<br />
economic zones<br />
4. Discriminatory tariffs in EU<br />
<strong>5.</strong> Technical barriers to trade<br />
6. Competition to other countries<br />
Source: Dy, 2000<br />
5- 89
<strong>5.</strong>14 SEAWEEDS<br />
Production<br />
<strong>5.</strong>14.1 Production posted double digit growth throughout 1993-1997, with<br />
average of 13.3% from 402,000 tons to 657,000 tons in 1997. The expansion<br />
was driven by the increasing dem<strong>and</strong> in the global market. The primary reasons<br />
were the discovery of new applications <strong>and</strong> the improved quality of local<br />
seaweed as a result of improved farming habits/techniques of local farmers.<br />
Growth decelerated to by 1.5% in 1999 <strong>and</strong> 2000 as a result of the El Niño<br />
weather disturbance in 1998. Production recovered in 2001 with 11.1% growth.<br />
From 1999-2004, output exp<strong>and</strong>ed by 11.8%, pulled down by the sharp<br />
contraction 1.6% in 1999 <strong>and</strong> 2000. Output peaked in 2004 at 1.2 million tons<br />
due to favorable weather conditions <strong>and</strong> increasing dem<strong>and</strong> for dried seaweeds<br />
in the export market.<br />
Figure <strong>5.</strong>14.1. SEAWEEDS: Volume of Production, 1993-2004<br />
Quantity ('000 tons)<br />
1400<br />
1200<br />
1000<br />
800<br />
600<br />
400<br />
200<br />
0<br />
Source: BAS<br />
93 94 95 96 97 98 99 00 01 02 03 04<br />
<strong>5.</strong>14.2 Relative to 1993 levels, production was up by 200% in 2004. Production<br />
gains were higher by 127-percentage points during 1999-2004 as against 1993-<br />
1998.<br />
Figure <strong>5.</strong>14.2. SEAWEEDS: Production Index, 1993-2004<br />
Production index (1993=100)<br />
350<br />
300<br />
250<br />
200<br />
150<br />
100<br />
-<br />
50<br />
93 94 95 96 97 98 99 00 01 02 03 04<br />
Source of basis data: BAS<br />
5- 90
<strong>5.</strong>14.3 Production is highly concentrated in the ARMM region particularly in the<br />
provinces of Sulu <strong>and</strong> Tawi-tawi. ARMM contributed 68% of total seaweeds<br />
production in 1993. The region share dropped to 40% in 2004 as more <strong>and</strong> more<br />
areas opened up for seaweeds production.<br />
Figure <strong>5.</strong>14.3. SEAWEEDS: Regional Distribution of Production, 1993, 1998<br />
<strong>and</strong> 2004<br />
Others<br />
1%<br />
1993<br />
Total: 400,707 tons<br />
Western<br />
Visay as<br />
0.3%<br />
ARMM<br />
68%<br />
Zamboanga Southern<br />
Peninsula<br />
6%<br />
Source of basic data: BAS<br />
Trade<br />
Tagalog<br />
6%<br />
Others<br />
7%<br />
Central<br />
Visay as<br />
19%<br />
Others<br />
2%<br />
2004<br />
Total: 1,204,808 tons<br />
ARMM<br />
40%<br />
Western<br />
Visay as<br />
4%<br />
Central<br />
Visay as<br />
7%<br />
1998<br />
Total: 685,336 tons<br />
Western<br />
Visay as<br />
2%<br />
Zamboanga<br />
Peninsula<br />
13%<br />
ARMM<br />
Central<br />
Visay as<br />
6%<br />
Southern<br />
Tagalog<br />
29%<br />
52%<br />
Zamboanga<br />
Peninsula<br />
17%<br />
Southern<br />
Tagalog<br />
21%<br />
5- 91
<strong>5.</strong>14.4 The country is a net exporter of seaweeds. Total export receipts<br />
increased by 29% per year from US$18.1 million in 1993 to US$89.6 million in<br />
2004. About 40% of the total value of exports in 2004 were dried seaweeds<br />
<strong>and</strong> the rest are in carrageenan form. Exports of dried seaweeds increased<br />
by 1<strong>5.</strong>7% per year from 1993-1998 but experienced a drastic decline of 8% in<br />
1988 <strong>and</strong> further declined by 3% per annum in 1999-2004. Declines in<br />
exports were due to low production in 1997 <strong>and</strong> 1998 brought about by the El<br />
Niño <strong>and</strong> the La Niña. The Asian financial crisis also hit some of the<br />
exporters which resulted to reduction in business operations.<br />
<strong>5.</strong>14.5 Considering the country’s export of dried seaweeds <strong>and</strong> carrageenan<br />
the volume indices relative to 1993 levels were generally increasing. In 2000,<br />
dried seaweeds exports increased while carrageenan exports decreased.<br />
This could imply that more production were exported as dried seaweeds<br />
instead of processed carrageenan.<br />
Figure <strong>5.</strong>14.4. SEAWEEDS AND CARRAGEENAN: Production <strong>and</strong> Export<br />
Volume Index by Product Type, 1993-2004<br />
Volume index (1993=100)<br />
350<br />
300<br />
250<br />
200<br />
150<br />
100<br />
-<br />
50<br />
Seaw eeds Production Carrageenan<br />
93 94 95 96 97 98 99 00 01 02 03 04<br />
Source of basic data: BAS <strong>and</strong> NSO<br />
Benchmarking with Relevant Asian Countries<br />
<strong>5.</strong>14.6 Benchmarking production levels among selected Asian countries indicated<br />
that the Philippines is the leading producer of red seaweeds followed by China.<br />
Except for the Philippines, China had overtaken other major producer countries<br />
in Asia in 2004. Philippine yield performance from 1993-1998 was higher at 74%<br />
but experienced a slower performance at 49.9% growth from 1999-2004.<br />
Table <strong>5.</strong>14.1. RED SEAWEEDS: Comparative Production of Selected Asian<br />
Countries, 1993, 1998 <strong>and</strong> 2004<br />
Country Production in Ton<br />
1993 1998 2003<br />
China 201,211 379,233 739,948<br />
Indonesia 228,395 164,725 288,170<br />
Japan 369,750 400,104 339,527<br />
5- 92
Korea 240,002 194,882 194,853<br />
Philippines 377,523 657,049 985,176<br />
Viet Nam 5,000 12,000 30,000<br />
Source of basic data: FAO<br />
Competitiveness Analysis<br />
<strong>5.</strong>14.7 Results of the analysis showed that locally produced dried seaweeds<br />
were generally export competitive at exchange rate of P40 <strong>and</strong> P4<strong>5.</strong> While at the<br />
exchange rate of P35:US$1, prices were not export competitive owing to the fact<br />
that local dem<strong>and</strong> is unlimited. In general, dem<strong>and</strong> is always greater than<br />
supply.<br />
<strong>5.</strong>14.8 All the computed RCRs were very much less than one implying that the<br />
Philippines is highly competitive as an exporter of seaweed. RCR under import<br />
trade scenario indicated a very high competitive advantage of Philippine<br />
seaweed. The Philippines remains as the major supplier of dried seaweeds in<br />
the world.<br />
<strong>5.</strong>14.9 Carrageenan produced in the country were mainly for exports. It is highly<br />
competitive as manifested in the increasing exports.<br />
<strong>5.</strong>14.10 The Philippines has a high competitive advantage in the export of<br />
carrageenan. All the computed RCRs implied that even with the existing<br />
distortions <strong>and</strong> interventions in the economy, the Philippines can compete in the<br />
world market. Moreover, the Philippines is producing the low-priced carrageenan<br />
SRC foodgrade or better known as PNG which is also acceptable for human<br />
consumption.<br />
SWOT Analysis<br />
<strong>5.</strong>14.11 The Philippine seaweed-carrageenan industry faces a bright future<br />
provided it plays its cards well. The gains can be protected if the industry<br />
continues to improve itself. While international lobby for non-tariff barriers against<br />
the Philippine carrageenan have quieted down, the industry must maintain<br />
vigilance as lobby groups will continue to search for opportunistic gains. The<br />
industry must continually assess itself. It must capitalize on its strengths. At the<br />
same time, it must try to address its weaknesses. Benchmarking <strong>and</strong> sustained<br />
search for best practices are imperative. These strengths <strong>and</strong> weaknesses<br />
should always be calibrated with the opportunities <strong>and</strong> threats the industry faces.<br />
<strong>5.</strong>14.12 The Philippines will remain as the leading <strong>and</strong> preferred supplier of raw<br />
seaweeds <strong>and</strong> carrageenan in the world market. Over the past two decades, it<br />
has laid a foundation, which if nurtured well, can sustain its growth.<br />
5- 93
<strong>5.</strong>14.13 The industry’s weaknesses, if not addressed well, could cause a<br />
long-term decline in competitiveness. Among the major factor to look into is<br />
the high incidence of low farm productivity. This is attributed to poor quality of<br />
seedlings in some areas, poor farming practices (i.e. early harvesting, use of<br />
salt <strong>and</strong> stones to increase product weight) <strong>and</strong> inadequate technical services<br />
<strong>and</strong> training on planting, harvesting <strong>and</strong> drying.<br />
<strong>5.</strong>14.14 The future of the industry offers promise provided the strengths are<br />
capitalized on <strong>and</strong> the weaknesses frontally addressed. There are still high<br />
potentials for farm productivity enhancement <strong>and</strong> quality improvements.<br />
Moreover, potentials for area expansion is still present to address increasing<br />
market potentials i.e. new markets for new applications, market potential for<br />
new varieties, exp<strong>and</strong>ing product applications.<br />
<strong>5.</strong>14.15 The development <strong>and</strong> expansion of the industry are constrained by a<br />
number of factors. Among these are pollution of some production areas,<br />
observance of inadequate quality st<strong>and</strong>ards for raw seaweed that impacts on<br />
carrageenan recovery <strong>and</strong> increasing competition in the global market.<br />
Table <strong>5.</strong>14.2. SEAWEED/CARRAGEENAN INDUSTRY: SWOT Analysis<br />
Strengths Weaknesses<br />
Inputs<br />
1. Availability of seedling nurseries in<br />
some areas<br />
2. Presence of established production<br />
technology.<br />
Farm Production<br />
3. Ideal agro-climatic endowment<br />
(availability of good growing areas)<br />
4. Available production areas <strong>and</strong><br />
farmers are willing to farm <strong>and</strong> take<br />
risks.<br />
Logistics<br />
<strong>5.</strong> Available infrastructure in some<br />
areas<br />
1. Poor quality of seedlings in some<br />
areas<br />
2. High incidence of low farm<br />
productivity<br />
3. Poor quality of seaweed in some<br />
areas due to poor farming practices i.e.<br />
early harvesting, use of salt <strong>and</strong> stones<br />
to increase product weight, <strong>and</strong> other<br />
malpractices<br />
4. Lack of organized growers or<br />
cooperatives<br />
<strong>5.</strong> High logistics costs<br />
6. Limited transport facilities<br />
Processing<br />
6. Available processing technologies 7. Inadequate technical services <strong>and</strong><br />
training on planting, harvesting <strong>and</strong><br />
drying<br />
8. Lack of farm or village level postharvest<br />
<strong>and</strong> drying facilities<br />
5- 94
Marketing<br />
7. Established marketing <strong>and</strong><br />
distribution system.<br />
8. Presence of many players in the<br />
processing <strong>and</strong> export sectors.<br />
Global:<br />
9. Global presence<br />
10. The Philippines Natural Grade<br />
(PNG) carrageenan is competitive<br />
with refined carrageenan from other<br />
species.<br />
11. Globally competitive cost<br />
structures<br />
9. Lack of industry-wide quality<br />
st<strong>and</strong>ards on raw seaweed<br />
10. High marketing costs from the farm<br />
to the processors<br />
11. Limited competition at the farm<br />
level marketing chain.<br />
Global:<br />
12. Weak government support in<br />
international regulatory forums.<br />
13. Limited access to global market<br />
intelligence by many stakeholders.<br />
14. Inadequate R&D budget on<br />
processing <strong>and</strong> product applications<br />
Opportunities Threats<br />
1. High potential for farm area 1. Increasing unit costs due to slow (or<br />
expansion<br />
unrealized) productivity gains.<br />
2. High potentials for farm productivity 2. Rising cost of doing business<br />
enhancement <strong>and</strong> quality<br />
improvements<br />
(transport, purchased inputs, etc)<br />
3. Entry of new investors in the 3. Inadequate supply of raw seaweeds<br />
processing sector<br />
for SRC plants leading to low capacity<br />
utilization or closures<br />
4. Market potential for new varieties 4. Pollution of some farm production<br />
areas<br />
<strong>5.</strong> New markets for new applications <strong>5.</strong> Inadequate observance/<br />
implementation of quality st<strong>and</strong>ards for<br />
raw seaweed that impacts on<br />
carrageenan recovery<br />
6. High dem<strong>and</strong> for technical services 6. Peace <strong>and</strong> order concerns in some<br />
parts of Mindanao<br />
Global: Global:<br />
7. Higher growth rate than the total 7. Increasing competition in<br />
hydrocolloid market.<br />
Eucheuma growing from Indonesia,<br />
Malaysia <strong>and</strong> Africa<br />
8. Exp<strong>and</strong>ing new product<br />
8. Establishment of carrageenan<br />
applications.<br />
plants in competitor countries<br />
9. Opening of markets for new 9. New lobbying <strong>and</strong> disinformation<br />
applications (e.g. China)<br />
tactics by competing firms overseas<br />
10. Acceptance of PNG as food 10. Country specific regulatory<br />
additive.<br />
guidelines <strong>and</strong> their high rates of<br />
change in the EU.<br />
5- 95