5. Key Commodity Performance - National Agricultural and Fishery ...
5. Key Commodity Performance - National Agricultural and Fishery ...
5. Key Commodity Performance - National Agricultural and Fishery ...

Create successful ePaper yourself
Turn your PDF publications into a flip-book with our unique Google optimized e-Paper software.
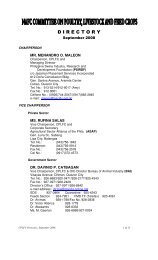
Figure <strong>5.</strong><strong>5.</strong><strong>5.</strong> BANANA: Production <strong>and</strong> Export Volume Index by Product<br />
Form, 1993-2004<br />
Production <strong>and</strong> export volume indices (1993=100)<br />
300<br />
250<br />
200<br />
150<br />
100<br />
-<br />
50<br />
Production Fresh Chips<br />
93 94 95 96 97 98 99 00 01 02 03 04<br />
Source of basic data: NSO<br />
Benchmarking with Relevant Asian Countries<br />
<strong>5.</strong><strong>5.</strong>13 Relative to its Asian neighbors, Philippine yield levels for all banana<br />
varieties were the lowest in 1993 <strong>and</strong> 1998. In 2004, however, the country<br />
managed to post a slight edge over Thail<strong>and</strong>. Nonetheless, the data masks the<br />
fact that the Cavendish farms in Mindanao are among the best in the world.<br />
Table <strong>5.</strong><strong>5.</strong>1. BANANA: Comparative Yields of Selected Asian Countries,<br />
1993, 1998 <strong>and</strong> 2004<br />
Yield (Ton/Ha)<br />
Country 1993 1998 2004<br />
China 14.2 19.9 23.2<br />
India 23.0 32.8 24.7<br />
Indonesia 13.6 12.3 1<strong>5.</strong>5<br />
Malaysia 17.4 17.8 20.4<br />
Philippines 9.4 10.7 13.6<br />
Thail<strong>and</strong> 12.5 12.8 13.1<br />
Viet Nam 14.8 14.7 14.7<br />
Source: FAO<br />
5- 36