City of Sunnyvale Waste Characterization Report
City of Sunnyvale Waste Characterization Report
City of Sunnyvale Waste Characterization Report

You also want an ePaper? Increase the reach of your titles
YUMPU automatically turns print PDFs into web optimized ePapers that Google loves.
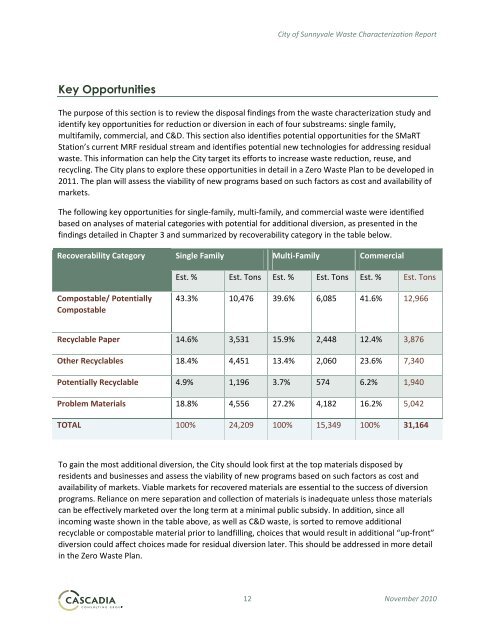
Key Opportunities<br />
<strong>City</strong> <strong>of</strong> <strong>Sunnyvale</strong> <strong>Waste</strong> <strong>Characterization</strong> <strong>Report</strong><br />
The purpose <strong>of</strong> this section is to review the disposal findings from the waste characterization study and<br />
identify key opportunities for reduction or diversion in each <strong>of</strong> four substreams: single family,<br />
multifamily, commercial, and C&D. This section also identifies potential opportunities for the SMaRT<br />
Station’s current MRF residual stream and identifies potential new technologies for addressing residual<br />
waste. This information can help the <strong>City</strong> target its efforts to increase waste reduction, reuse, and<br />
recycling. The <strong>City</strong> plans to explore these opportunities in detail in a Zero <strong>Waste</strong> Plan to be developed in<br />
2011. The plan will assess the viability <strong>of</strong> new programs based on such factors as cost and availability <strong>of</strong><br />
markets.<br />
The following key opportunities for single-family, multi-family, and commercial waste were identified<br />
based on analyses <strong>of</strong> material categories with potential for additional diversion, as presented in the<br />
findings detailed in Chapter 3 and summarized by recoverability category in the table below.<br />
Recoverability Category<br />
Compostable/ Potentially<br />
Compostable<br />
Single Family Multi-Family Commercial<br />
Est. % Est. Tons Est. % Est. Tons Est. % Est. Tons<br />
43.3%<br />
10,476 39.6% 6,085 41.6% 12,966<br />
Recyclable Paper 14.6% 3,531 15.9% 2,448 12.4% 3,876<br />
Other Recyclables 18.4% 4,451 13.4% 2,060 23.6% 7,340<br />
Potentially Recyclable 4.9% 1,196 3.7% 574 6.2% 1,940<br />
Problem Materials 18.8% 4,556 27.2% 4,182 16.2% 5,042<br />
TOTAL 100% 24,209 100% 15,349 100% 31,164<br />
To gain the most additional diversion, the <strong>City</strong> should look first at the top materials disposed by<br />
residents and businesses and assess the viability <strong>of</strong> new programs based on such factors as cost and<br />
availability <strong>of</strong> markets. Viable markets for recovered materials are essential to the success <strong>of</strong> diversion<br />
programs. Reliance on mere separation and collection <strong>of</strong> materials is inadequate unless those materials<br />
can be effectively marketed over the long term at a minimal public subsidy. In addition, since all<br />
incoming waste shown in the table above, as well as C&D waste, is sorted to remove additional<br />
recyclable or compostable material prior to landfilling, choices that would result in additional “up-front”<br />
diversion could affect choices made for residual diversion later. This should be addressed in more detail<br />
in the Zero <strong>Waste</strong> Plan.<br />
12 November 2010