City of Sunnyvale Waste Characterization Report
City of Sunnyvale Waste Characterization Report
City of Sunnyvale Waste Characterization Report

You also want an ePaper? Increase the reach of your titles
YUMPU automatically turns print PDFs into web optimized ePapers that Google loves.
<strong>City</strong> <strong>of</strong> <strong>Sunnyvale</strong> <strong>Waste</strong> <strong>Characterization</strong> <strong>Report</strong><br />
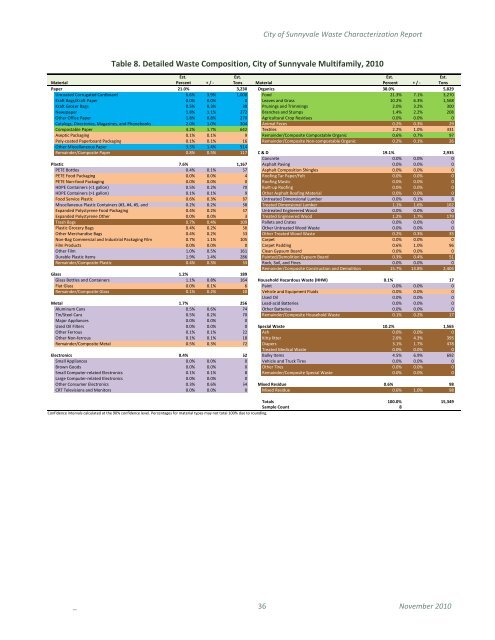
Table 8. Detailed <strong>Waste</strong> Composition, <strong>City</strong> <strong>of</strong> <strong>Sunnyvale</strong> Multifamily, 2010<br />
Est. Est. Est. Est.<br />
Material Percent + / - Tons Material Percent + / - Tons<br />
Paper 21.0% 3,230 Organics 38.0% 5,829<br />
Uncoated Corrugated Cardboard 6.6% 3.9% 1,008 Food 21.3% 7.1% 3,270<br />
Kraft Bags/Kraft Paper 0.0% 0.0% 0 Leaves and Grass 10.2% 6.3% 1,568<br />
Kraft Grocer Bags 0.5% 0.3% 80 Prunings and Trimmings 2.0% 3.2% 300<br />
Newspaper 1.8% 1.1% 272 Branches and Stumps 1.4% 2.2% 208<br />
Other Office Paper 1.8% 0.8% 270 Agricultural Crop Residues 0.0% 0.0% 0<br />
Catalogs, Directories, Magazines, and Phonebooks 2.0% 1.0% 304 Animal Feces 0.2% 0.3% 29<br />
Compostable Paper 4.2% 1.7% 642 Textiles 2.2% 1.0% 331<br />
Aseptic Packaging 0.1% 0.1% 9 Remainder/Composite Compostable Organic 0.6% 0.7% 97<br />
Poly-coated Paperboard Packaging 0.1% 0.1% 16 Remainder/Composite Non-compostable Organic 0.2% 0.1% 26<br />
Other Miscellaneous Paper 3.3% 1.4% 514<br />
Remainder/Composite Paper 0.8% 0.5% 117 C & D 19.1% 2,935<br />
Concrete 0.0% 0.0% 0<br />
Plastic 7.6% 1,167 Asphalt Paving 0.0% 0.0% 0<br />
PETE Bottles 0.4% 0.1% 57 Asphalt Composition Shingles 0.0% 0.0% 0<br />
PETE Food Packaging 0.0% 0.0% 4 Ro<strong>of</strong>ing Tar Paper/Felt 0.0% 0.0% 0<br />
PETE Non-food Packaging 0.0% 0.0% 0 Ro<strong>of</strong>ing Mastic 0.0% 0.0% 0<br />
HDPE Containers (1 gallon) 0.1% 0.1% 9 Other Asphalt Ro<strong>of</strong>ing Material 0.0% 0.0% 0<br />
Food Service Plastic 0.6% 0.3% 87 Untreated Dimensional Lumber 0.0% 0.1% 8<br />
Miscellaneous Plastic Containers (#3, #4, #5, and 0.2% 0.2% 38 Treated Dimensional Lumber 1.1% 1.6% 162<br />
Expanded Polystyrene Food Packaging 0.4% 0.2% 57 Untreated Engineered Wood 0.0% 0.0% 0<br />
Expanded Polystyrene Other 0.0% 0.0% 3 Treated Engineered Wood 1.2% 1.7% 179<br />
Trash Bags 0.7% 0.4% 109 Pallets and Crates 0.0% 0.0% 0<br />
Plastic Grocery Bags 0.4% 0.2% 56 Other Untreated Wood <strong>Waste</strong> 0.0% 0.0% 0<br />
Other Merchandise Bags 0.4% 0.2% 63 Other Treated Wood <strong>Waste</strong> 0.2% 0.3% 35<br />
Non-Bag Commercial and Industrial Packaging Film 0.7% 1.1% 105 Carpet 0.0% 0.0% 0<br />
Film Products 0.0% 0.0% 0 Carpet Padding 0.6% 1.0% 96<br />
Other Film 1.0% 0.5% 161 Clean Gypsum Board 0.0% 0.0% 0<br />
Durable Plastic Items 1.9% 1.4% 286 Painted/Demolition Gypsum Board 0.3% 0.4% 51<br />
Remainder/Composite Plastic 0.4% 0.3% 63 Rock, Soil, and Fines 0.0% 0.0% 0<br />
Remainder/Composite Construction and Demolition 15.7% 13.8% 2,404<br />
Glass 1.2% 189<br />
Glass Bottles and Containers 1.1% 0.8% 164 Household Hazardous <strong>Waste</strong> (HHW) 0.1% 17<br />
Flat Glass 0.0% 0.1% 6 Paint 0.0% 0.0% 0<br />
Remainder/Composite Glass 0.1% 0.2% 20 Vehicle and Equipment Fluids 0.0% 0.0% 0<br />
Used Oil 0.0% 0.0% 0<br />
Metal 1.7% 256 Lead-acid Batteries 0.0% 0.0% 0<br />
Aluminum Cans 0.5% 0.6% 74 Other Batteries 0.0% 0.0% 0<br />
Tin/Steel Cans 0.5% 0.2% 70 Remainder/Composite Household <strong>Waste</strong> 0.1% 0.2% 17<br />
Major Appliances 0.0% 0.0% 0<br />
Used Oil Filters 0.0% 0.0% 0 Special <strong>Waste</strong> 10.2% 1,565<br />
Other Ferrous 0.1% 0.1% 22 Ash 0.0% 0.0% 0<br />
Other Non-ferrous 0.1% 0.1% 18 Kitty litter 2.6% 4.3% 395<br />
Remainder/Composite Metal 0.5% 0.3% 72 Diapers 3.1% 1.7% 478<br />
Treated Medical <strong>Waste</strong> 0.0% 0.0% 0<br />
Electronics 0.4% 62 Bulky Items 4.5% 6.9% 692<br />
Small Appliances 0.0% 0.0% 0 Vehicle and Truck Tires 0.0% 0.0% 0<br />
Brown Goods 0.0% 0.0% 0 Other Tires 0.0% 0.0% 0<br />
Small Computer-related Electronics 0.1% 0.1% 8 Remainder/Composite Special <strong>Waste</strong> 0.0% 0.0% 0<br />
Large Computer-related Electronics 0.0% 0.0% 0<br />
Other Consumer Electronics 0.3% 0.6% 54 Mixed Residue 0.6% 98<br />
CRT Televisions and Monitors 0.0% 0.0% 0 Mixed Residue 0.6% 1.0% 98<br />
Totals 100.0% 15,349<br />
Sample Count 8<br />
Confidence intervals calculated at the 90% confidence level. Percentages for material types may not total 100% due to rounding.<br />
_ 36 November 2010