City of Sunnyvale Waste Characterization Report
City of Sunnyvale Waste Characterization Report
City of Sunnyvale Waste Characterization Report

You also want an ePaper? Increase the reach of your titles
YUMPU automatically turns print PDFs into web optimized ePapers that Google loves.
<strong>City</strong> <strong>of</strong> <strong>Sunnyvale</strong> <strong>Waste</strong> <strong>Characterization</strong> <strong>Report</strong><br />
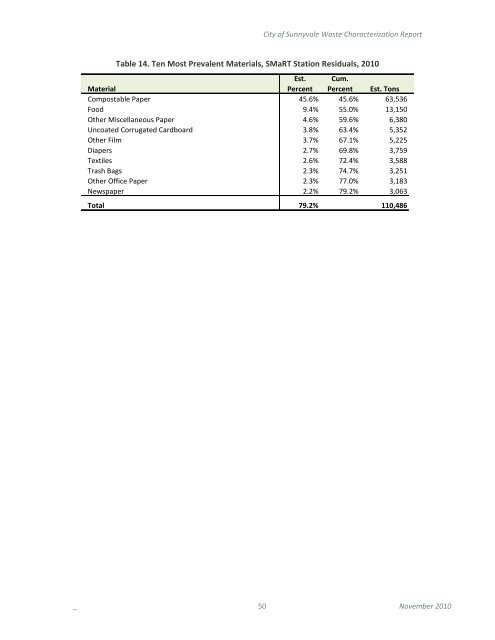
Table 14. Ten Most Prevalent Materials, SMaRT Station Residuals, 2010<br />
Est. Cum.<br />
Material<br />
Percent Percent Est. Tons<br />
Compostable Paper 45.6% 45.6% 63,536<br />
Food 9.4% 55.0% 13,150<br />
Other Miscellaneous Paper 4.6% 59.6% 6,380<br />
Uncoated Corrugated Cardboard 3.8% 63.4% 5,352<br />
Other Film 3.7% 67.1% 5,225<br />
Diapers 2.7% 69.8% 3,759<br />
Textiles 2.6% 72.4% 3,588<br />
Trash Bags 2.3% 74.7% 3,251<br />
Other Office Paper 2.3% 77.0% 3,183<br />
Newspaper 2.2% 79.2% 3,063<br />
Total 79.2% 110,486<br />
_ 50 November 2010