City of Sunnyvale Waste Characterization Report
City of Sunnyvale Waste Characterization Report
City of Sunnyvale Waste Characterization Report

Create successful ePaper yourself
Turn your PDF publications into a flip-book with our unique Google optimized e-Paper software.
<strong>City</strong> <strong>of</strong> <strong>Sunnyvale</strong> <strong>Waste</strong> <strong>Characterization</strong> <strong>Report</strong><br />
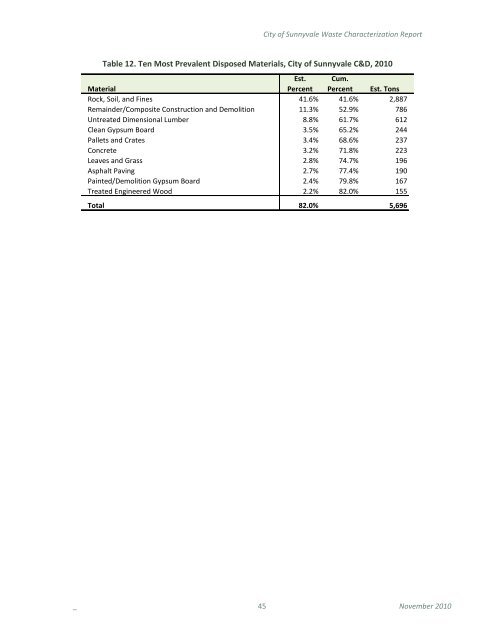
Table 12. Ten Most Prevalent Disposed Materials, <strong>City</strong> <strong>of</strong> <strong>Sunnyvale</strong> C&D, 2010<br />
Est. Cum.<br />
Material<br />
Percent Percent Est. Tons<br />
Rock, Soil, and Fines 41.6% 41.6% 2,887<br />
Remainder/Composite Construction and Demolition 11.3% 52.9% 786<br />
Untreated Dimensional Lumber 8.8% 61.7% 612<br />
Clean Gypsum Board 3.5% 65.2% 244<br />
Pallets and Crates 3.4% 68.6% 237<br />
Concrete 3.2% 71.8% 223<br />
Leaves and Grass 2.8% 74.7% 196<br />
Asphalt Paving 2.7% 77.4% 190<br />
Painted/Demolition Gypsum Board 2.4% 79.8% 167<br />
Treated Engineered Wood 2.2% 82.0% 155<br />
Total 82.0% 5,696<br />
_ 45 November 2010