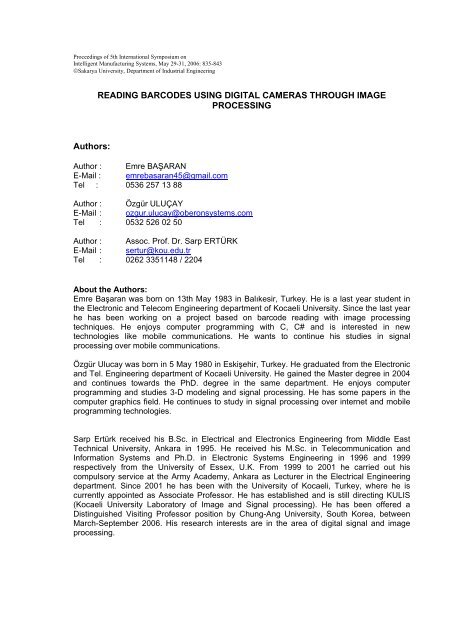
READING BARCODES USING DIGITAL CAMERAS ... - KULIS
READING BARCODES USING DIGITAL CAMERAS ... - KULIS
READING BARCODES USING DIGITAL CAMERAS ... - KULIS

You also want an ePaper? Increase the reach of your titles
YUMPU automatically turns print PDFs into web optimized ePapers that Google loves.
Proceedings of 5th International Symposium on<br />
Intelligent Manufacturing Systems, May 29-31, 2006: 835-843<br />
©Sakarya University, Department of Industrial Engineering<br />
Authors:<br />
<strong>READING</strong> <strong>BARCODES</strong> <strong>USING</strong> <strong>DIGITAL</strong> <strong>CAMERAS</strong> THROUGH IMAGE<br />
PROCESSING<br />
Author : Emre BAŞARAN<br />
E-Mail : emrebasaran45@gmail.com<br />
Tel : 0536 257 13 88<br />
Author : Özgür ULUÇAY<br />
E-Mail : ozgur.ulucay@oberonsystems.com<br />
Tel : 0532 526 02 50<br />
Author : Assoc. Prof. Dr. Sarp ERTÜRK<br />
E-Mail : sertur@kou.edu.tr<br />
Tel : 0262 3351148 / 2204<br />
About the Authors:<br />
Emre Başaran was born on 13th May 1983 in Balıkesir, Turkey. He is a last year student in<br />
the Electronic and Telecom Engineering department of Kocaeli University. Since the last year<br />
he has been working on a project based on barcode reading with image processing<br />
techniques. He enjoys computer programming with C, C# and is interested in new<br />
technologies like mobile communications. He wants to continue his studies in signal<br />
processing over mobile communications.<br />
Özgür Ulucay was born in 5 May 1980 in Eskişehir, Turkey. He graduated from the Electronic<br />
and Tel. Engineering department of Kocaeli University. He gained the Master degree in 2004<br />
and continues towards the PhD. degree in the same department. He enjoys computer<br />
programming and studies 3-D modeling and signal processing. He has some papers in the<br />
computer graphics field. He continues to study in signal processing over internet and mobile<br />
programming technologies.<br />
Sarp Ertürk received his B.Sc. in Electrical and Electronics Engineering from Middle East<br />
Technical University, Ankara in 1995. He received his M.Sc. in Telecommunication and<br />
Information Systems and Ph.D. in Electronic Systems Engineering in 1996 and 1999<br />
respectively from the University of Essex, U.K. From 1999 to 2001 he carried out his<br />
compulsory service at the Army Academy, Ankara as Lecturer in the Electrical Engineering<br />
department. Since 2001 he has been with the University of Kocaeli, Turkey, where he is<br />
currently appointed as Associate Professor. He has established and is still directing <strong>KULIS</strong><br />
(Kocaeli University Laboratory of Image and Signal processing). He has been offered a<br />
Distinguished Visiting Professor position by Chung-Ang University, South Korea, between<br />
March-September 2006. His research interests are in the area of digital signal and image<br />
processing.
Abstract:<br />
All people go to the supermarket to buy something that needs lots of time. Each product has<br />
a label made up of lines with different thicknesses. We go to cashbox when buying these<br />
products. Cashiers pass the products through a hand-scanner to see the corresponding price.<br />
In this paper, a method is presented for barcode reading with camera which is based on<br />
image processing. Normally, the barcode reading process is performed by laser readers, and<br />
laser readers are necessary tools for barcode readings. In this paper we present an<br />
alternative method for barcode reading directly from camera images. The advantage of the<br />
proposed method is that barcodes can be read directly from the line, having product barcodes<br />
look upwards facing a camera located above the line, so that it will not be necessary to pick<br />
up all individual products to pass them through a laser scanner manually. Thus the proposed<br />
approach will provide speed and simplicity.<br />
Introduction:<br />
Generally, barcodes are symbols shaped in the form of rectangles which consist of thin or<br />
thick parallel lines parallel to each other. Barcodes provide means for automatic rapid data<br />
input into the computer. Since the last decade, barcodes are being used in many areas such<br />
as market products and electronic devices. The lines on barcodes contain the reference<br />
number of the product. This information should be recorded in computers to store each<br />
product separately for counting company sales and purchase quantities. When reading<br />
barcodes on products using some laser scanning device, a signal is generated by the system<br />
and is processed in the computer by some software. Then this information is used to<br />
determine which product is selected. This process provides rapid and reliable sales<br />
opportunities to companies for selling their products.<br />
There are very different types of barcodes: EAN, EAN-13, EAN-8, Code 39, Code 93, Code<br />
128, and UPC are well known. UPC and EAN types are most commonly used cases. The<br />
UPC numbering system is used in Canada and America, while the EAN 13 numbering system<br />
is used in Europe and Turkey [3].<br />
Figure 1: A sample barcode in EAN 13 numbering system<br />
836
Figure 1 shows a sample barcode in the EAN 13 numbering system structure. The black lines<br />
on the top of the barcode represent the logic true or ‘1’, and the blanks represent the logic<br />
false or ‘0’. The width of the thinnest black line is the reference width. The reference width is<br />
presented by a single bit and the largest line width of the barcodes can be four times the<br />
reference width at the maximum. In the same way, the width of the thinnest white line has a<br />
reference value, and the thickest white line can have a width of four times the reference width<br />
at maximum. There are starting and finishing codes equal to 101 values at the beginning and<br />
end of the barcode which show the reference widths. There is a longer barcode giving the<br />
01010 value in the center of the barcode and this code lines have reference widths, too.<br />
Barcodes are formed in the form of a bit string according to line thickness to analyze a<br />
barcode. There are 12 numbers on the barcode and each number is defined by 7 bits.<br />
Barcodes also have 3 start, 3 stop and 5 bits in the middle for referencing. As a result the<br />
barcodes are defined by 95 bits in total.<br />
Barcode values are not obtained directly from these 95 bits long codes. These values will be<br />
obtained using barcode numbering schemes. In this paper, the EAN 13 numbering scheme is<br />
used to determine the barcode reading process. The methodology to achieve the value of the<br />
barcodes using this scheme includes the following structure:<br />
1. Find reference width using start (3); stop (3) and center (5) guard bits.<br />
2. Remove the reference bits (3 start, 3 stop, and 5 center bits) from the barcode code bit string.<br />
As a result obtain the 84 bits long barcode information code bit string.<br />
3. Divide the barcode bits into two areas. The first area consists of the first 42 bits, and the<br />
second area consists of the last 42 bits.<br />
For the first area:<br />
4. Find first the decimal value parity of the barcode. This parity value will be used to determine the<br />
order of barcode code readings. The first 42 bits will be read using the encoding table shown in<br />
Figure 2b according to the order obtained from the odd-even table shown in Figure 2a.<br />
5. Select seven (7) bit to encode/decode a digit:<br />
a. Find the resulting value by searching the respective odd/even column of the left-hand<br />
encoding table shown in Figure 2b.<br />
b. Go to step 5 if remaining bit count is bigger than zero.<br />
For the second area:<br />
6. Select seven (7) bits to encode/decode a digit:<br />
a. Find the resulting value by searching the right-hand encoding table shown in figure 2b.<br />
b. Go to step 6 if remaining bit count is bigger than zero.<br />
7. Construct the barcode code using the obtained values.<br />
Algorithm 1: Barcode encoding algorithm for EAN 13 numbering system.<br />
837
a) Odd/Even Parity Table b) Encoding Table<br />
Figure 2: Encoding tables for the EAN 13 numbering system.<br />
As the first decimal number (for instance the first 9 in the barcode shown in Figure 1) shows<br />
the corresponding row of the odd/even parity table and is not encoded in the barcode, it<br />
cannot be extracted by identifying the thickness of vertical lines. In laser scanner systems,<br />
this number is obtained using parity calculation. For simplification, the parity calculation step<br />
is omitted in the proposed system, and both sides of the left-hand encoding approach shown<br />
in Figure 2b is entered into the database and the correct value is determined by comparing<br />
against both (odd and even parity) cases.<br />
Approach:<br />
Our approach contains an edge detection algorithm to obtain barcode borders from images<br />
acquired using a camera, and some threshold mechanism to process images as binary<br />
patterns.<br />
At first, an image that contains the barcode information is acquired using a camera. The<br />
color image contains in fact the full usable information. For faster and simple processing, the<br />
image is converted to grayscale format. Because the acquired image will typically contain an<br />
area larger than the barcode, it is initially required to crop the barcode area as the rest of the<br />
image is unnecessary.<br />
Because only the barcode region is required, the borders of the barcode line coordinates<br />
must be determined. An edge detection algorithm can be used for determining the borders.<br />
Edge detection algorithms can use different kernels. The Canny edge detector provides a<br />
reasonable and successful approach for edge detection [1]. The Canny detector uses two<br />
kernels, one for the vertical edges and one for the horizontal edges. The utilized kernels are<br />
shown in Figure 3. The Canny algorithm provides an optimal edge detector based on a set of<br />
838
criteria which includes finding the most edges by minimizing the error rate, marking edges as<br />
closely as possible to the actual edges to maximize localization, and marking edges only<br />
once when a single edge exists for minimal response [2].<br />
Figure 3: Canny edge detection kernels. The left kernel is used for the detection of vertical<br />
edges and the right kernel is used for the detection of the horizontal edges [2].<br />
In this paper Canny edge detection kernels are used to determine the barcode area. As a<br />
barcode is made up of vertical lines, it has been found that utilization of the vertical edge<br />
detection kernel is sufficient. Hence the computational load is reduced by using only the<br />
vertical edge detection kernel instead of both kernels. Hence, a single pass with the vertical<br />
edge detection kernel is used to determine the barcode area. After applying the edge<br />
detection kernel, a threshold algorithm is applied on the resulting image. At this stage, the<br />
image indicates all vertical lines including barcode lines.<br />
The algorithm that is used in this work is described below in algorithm 2. Note that<br />
For all pixels:<br />
1. Select the pixel to be processed and determine the kernel area.<br />
2. Apply the vertical edge kernel shown in figure 3 (the left picture) to the selected kernel area.<br />
3. If the result is positive, the new pixel value will be the resulting value.<br />
4. If the result is negative, go to step 1.<br />
5. The average value of the output is calculated.<br />
6. Threshold the output using this average value.<br />
This algorithm gives all vertical lines in an image. This process is shown for example barcode<br />
images in Figures 4-6 below.<br />
Figure 4: An image with purple background color.<br />
839
Figure 5: An image with white background color.<br />
Figure 6: An image with red background color.<br />
The obtained white lines on the resulted image after Canny edge detection and<br />
thresholding will then be separated into several parts. This partitioning is accomplished by<br />
finding neighbor pixels in the image. All neighbor white pixels must stay together, and all<br />
pixels that are not-neighbors must be separated. All of the resulted neighbor pixels will be<br />
stored in the form of neighbor tables as an array. This operation is summarized in algorithm 3<br />
given below.<br />
For all pixels:<br />
1. Select the pixel to be processed.<br />
2. If the pixel is black go to 1. Else go to the next step.<br />
3. If any neighbor table exists, go to step 4. Else construct a new neighbor table entry.<br />
4. For all neighbor tables<br />
a) Search all pixel coordinates in the table to detect any neighbor relationship with<br />
a selected pixel.<br />
b) If any relationship is found, put this pixel in this table and return to step 1.<br />
c) If any relationship is not found, construct a new table and put this pixel in it. Go<br />
to step 1.<br />
Algorithm 3: Constructing neighbor tables.<br />
These tables include all the barcode line places and unnecessary noise. For eliminating<br />
unnecessary noise from the barcode information we have to determine the differences<br />
between them. To do that, at first we must determine the table entries that only includes<br />
barcode line places. The size of tables which include barcode lines must be equal or very<br />
close to each other; because all barcode line heights are equal in an image.<br />
840
There are 30 black stripes and 29 white stripes in every barcode. Our edge detection<br />
algorithm just detects the passing from black to white, so there will be 30 tables which have<br />
same or very close sizes.<br />
In this approach, the 30 tables which contain the barcode line pixels must be consecutive. At<br />
first we must determine the barcode upper-left pixel coordinate which is mainly any one of the<br />
available table entries. Then we have to search all tables to determine the barcode area. To<br />
do that, we use a standard deviation value to find all 30 barcode lines which follow each<br />
other, and have the same or close size. This approach is described in algorithm 4 below.<br />
For all tables:<br />
1. Determine the standard deviation of region areas<br />
2. Construct one counter that counts neighbor tables which have suitable standard deviation<br />
and set counter value to zero.<br />
3. Select one table for comparison of table sizes if there is no selected table.<br />
a) Get the table size.<br />
4. Select next table for comparison.<br />
a) Get the second table size.<br />
5. Compare the values using computed standard deviation.<br />
a) If division of table size value difference is below the standard deviation.<br />
Increase counter value and assign the first table as the one with this counter value.<br />
I. If the counter value is equal to 30 Go to step 6.<br />
II. Else go to step 4.<br />
b) Else go to step 2.<br />
6. First and second selected tables together indicate the barcode start and stop positions,<br />
respectively. The area covering the pixel values of the first and second table is the barcode field.<br />
Algorithm 4: Determining the Barcode Area<br />
The approach given in Algorithm 4 is used to obtain the barcode fields in the sample images<br />
shown in Figure 4-6. In fact, these fields indicate the coordinates of the barcode fields. These<br />
coordinates will be used to obtain the real barcode lines. The lines that are included in the<br />
tables are not the actual barcode lines yet, they only indicate the barcode line positions. The<br />
barcode images only contain barcode lines and their threshold equivalents are obtained using<br />
these coordinates as shown in Figure (7-9) below.<br />
Figure 7: The barcode field of the full image shown in Figure 4.<br />
841
Figure 8: The barcode field of the full image shown in Figure 5.<br />
Figure 9: The barcode field of the full image in Figure 6.<br />
After barcode fields are cut out from the image, a threshold is applied on these fields using<br />
the mean values of these fields. Then, the resulting image only contains the barcode lines<br />
which indicate the barcode codes. The barcode codes are obtained using these images using<br />
an algorithm that stores white and black lines together in arrays by determining positions of<br />
these lines described above. Then, every barcode code is obtained using these array sizes.<br />
Note that the reference sizes have to be considered to make codes meaningful. This<br />
operation is given in Algorithm 5 below.<br />
1. Construct a variable ‘refsize’ to indicate a reference size, and a variable ‘result’ for the result<br />
code.<br />
2. Select first array to be processed.<br />
3. This array should contain black pixels. The refsize variable is set to this array size.<br />
For all lines:<br />
4. Select next array if any unselected array exists else go to step 8.<br />
5. Divide this array size to refsize. The calculated floating value is stored as a variable<br />
‘codeValbyRef’. Round this value to the closest integer.<br />
6. If this array includes black pixels write logic ‘1’ for the corresponding amount of the<br />
codeValByRef value to the result value. Go to step 4.<br />
7. If this array includes white pixels write logic ‘0’ for the corresponding amount of the<br />
codeValByRef value to the result value. Go to step 4.<br />
8. The result value must be the 95 bits long barcode code.<br />
Algorithm 5: Determining the Barcode Code<br />
842
After obtaining the 95 bits long barcode code, it must be converted to meaningful decimal<br />
numbers. This can be accomplished using Algorithm 1, as described earlier. The resulting<br />
decimal numbers indicates the barcode code and is meaningfully constructed as shown in<br />
Figure 10 using algorithm 5 and 1 for sample images shown in Figures (7-9)<br />
Figure 10: The barcode results obtained for the sample images<br />
A total of 15 barcode images with differently sized barcodes have been processed with the<br />
presented method. A 100 % correct detection performance has been obtained for the<br />
method. In the future it is planned to evaluate the methods on a larger database, with images<br />
taken under different lighting conditions, with various orientations and multiple barcodes<br />
within an image.<br />
Conclusions:<br />
In this paper; a method for barcode reading with a camera based on image processing has<br />
been presented. First of all; edges are detected in the image using an edge detection method<br />
and then white areas are assigned into arrays. Then we subtract the barcode area from the<br />
original image using these array sizes. A threshold is applied using images mean values of<br />
the barcode field after this process. Then we get the barcode number from black and white<br />
areas obtained after threshold process. The barcode reading process has been carried out<br />
fast, effectively and successfully with the presented method.<br />
References:<br />
[1] Canny, J., “A Computational Approach to Edge Detection”, IEEE Trans. Pattern<br />
Analysis and Machine Intelligence, 8:679-714, November 1986<br />
[2] Hong Shan Neoh, Asher Hazanchuk, “Adaptive Edge Detection for Real-Time Video<br />
Processing using FPGAs”, GSPx 2004 conference paper:<br />
http://www.altera.com/technology/dsp/conf-papers/dsp-conf-papers.html<br />
[3] Barcode toolkits from Softek Software: http://www.bardecode.com/<br />
[4] Vault Information Services LLC: http://www.barcodeisland.com/ean13.phtml<br />
843

![Page 1 %XODQÕN 6 ]JHo LOH *|U QW 6WDELOL]DV\RQX M ...](https://img.yumpu.com/18085529/1/184x260/page-1-xodqon-6-jho-loh-u-qw-6wdeloldvrqx-m-.jpg?quality=85)
![[ ]T [ ]T - KULIS - Kocaeli Üniversitesi](https://img.yumpu.com/18085463/1/184x260/-t-t-kulis-kocaeli-universitesi.jpg?quality=85)