Texas 2012 NCLB Report Card Part I - Campus Level: Student ...
Texas 2012 NCLB Report Card Part I - Campus Level: Student ...
Texas 2012 NCLB Report Card Part I - Campus Level: Student ...

Create successful ePaper yourself
Turn your PDF publications into a flip-book with our unique Google optimized e-Paper software.
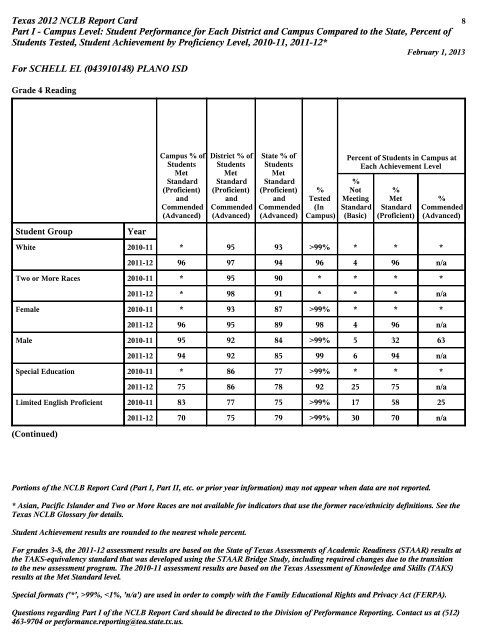
<strong>Texas</strong> <strong>2012</strong> <strong>NCLB</strong> <strong>Report</strong> <strong>Card</strong> 8<br />
<strong>Part</strong> I - <strong>Campus</strong> <strong>Level</strong>: <strong>Student</strong> Performance for Each District and <strong>Campus</strong> Compared to the State, Percent of<br />
<strong>Student</strong>s Tested, <strong>Student</strong> Achievement by Proficiency <strong>Level</strong>, 2010-11, 2011-12*<br />
February 1, 2013<br />
For SCHELL EL (043910148) PLANO ISD<br />
Grade 4 Reading<br />
<strong>Student</strong> Group Year<br />
<strong>Campus</strong> % of<br />
<strong>Student</strong>s<br />
Met<br />
Standard<br />
(Proficient)<br />
and<br />
Commended<br />
(Advanced)<br />
District % of<br />
<strong>Student</strong>s<br />
Met<br />
Standard<br />
(Proficient)<br />
and<br />
Commended<br />
(Advanced)<br />
Portions of the <strong>NCLB</strong> <strong>Report</strong> <strong>Card</strong> (<strong>Part</strong> I, <strong>Part</strong> II, etc. or prior year information) may not appear when data are not reported.<br />
* Asian, Pacific Islander and Two or More Races are not available for indicators that use the former race/ethnicity definitions. See the<br />
<strong>Texas</strong> <strong>NCLB</strong> Glossary for details.<br />
<strong>Student</strong> Achievement results are rounded to the nearest whole percent.<br />
State % of<br />
<strong>Student</strong>s<br />
Met<br />
Standard<br />
(Proficient)<br />
and<br />
Commended<br />
(Advanced)<br />
%<br />
Tested<br />
(In<br />
<strong>Campus</strong>)<br />
Percent of <strong>Student</strong>s in <strong>Campus</strong> at<br />
Each Achievement <strong>Level</strong><br />
%<br />
Not<br />
Meeting<br />
Standard<br />
(Basic)<br />
%<br />
Met<br />
Standard<br />
(Proficient)<br />
%<br />
Commended<br />
(Advanced)<br />
White 2010-11 * 95 93 >99% * * *<br />
2011-12 96 97 94 96 4 96 n/a<br />
Two or More Races 2010-11 * 95 90 * * * *<br />
2011-12 * 98 91 * * * n/a<br />
Female 2010-11 * 93 87 >99% * * *<br />
2011-12 96 95 89 98 4 96 n/a<br />
Male 2010-11 95 92 84 >99% 5 32 63<br />
2011-12 94 92 85 99 6 94 n/a<br />
Special Education 2010-11 * 86 77 >99% * * *<br />
2011-12 75 86 78 92 25 75 n/a<br />
Limited English Proficient 2010-11 83 77 75 >99% 17 58 25<br />
(Continued)<br />
2011-12 70 75 79 >99% 30 70 n/a<br />
For grades 3-8, the 2011-12 assessment results are based on the State of <strong>Texas</strong> Assessments of Academic Readiness (STAAR) results at<br />
the TAKS-equivalency standard that was developed using the STAAR Bridge Study, including required changes due to the transition<br />
to the new assessment program. The 2010-11 assessment results are based on the <strong>Texas</strong> Assessment of Knowledge and Skills (TAKS)<br />
results at the Met Standard level.<br />
Special formats ('*', >99%,