Texas 2012 NCLB Report Card Part I - Campus Level: Student ...
Texas 2012 NCLB Report Card Part I - Campus Level: Student ...
Texas 2012 NCLB Report Card Part I - Campus Level: Student ...

Create successful ePaper yourself
Turn your PDF publications into a flip-book with our unique Google optimized e-Paper software.
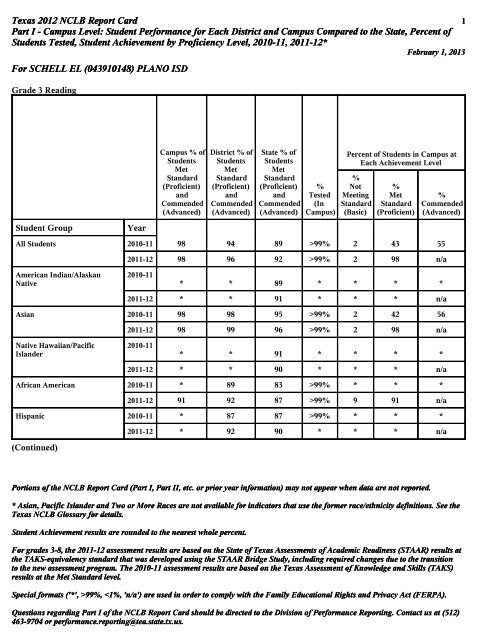
<strong>Texas</strong> <strong>2012</strong> <strong>NCLB</strong> <strong>Report</strong> <strong>Card</strong> 1<br />
<strong>Part</strong> I - <strong>Campus</strong> <strong>Level</strong>: <strong>Student</strong> Performance for Each District and <strong>Campus</strong> Compared to the State, Percent of<br />
<strong>Student</strong>s Tested, <strong>Student</strong> Achievement by Proficiency <strong>Level</strong>, 2010-11, 2011-12*<br />
February 1, 2013<br />
For SCHELL EL (043910148) PLANO ISD<br />
Grade 3 Reading<br />
<strong>Student</strong> Group Year<br />
<strong>Campus</strong> % of<br />
<strong>Student</strong>s<br />
Met<br />
Standard<br />
(Proficient)<br />
and<br />
Commended<br />
(Advanced)<br />
District % of<br />
<strong>Student</strong>s<br />
Met<br />
Standard<br />
(Proficient)<br />
and<br />
Commended<br />
(Advanced)<br />
Portions of the <strong>NCLB</strong> <strong>Report</strong> <strong>Card</strong> (<strong>Part</strong> I, <strong>Part</strong> II, etc. or prior year information) may not appear when data are not reported.<br />
* Asian, Pacific Islander and Two or More Races are not available for indicators that use the former race/ethnicity definitions. See the<br />
<strong>Texas</strong> <strong>NCLB</strong> Glossary for details.<br />
<strong>Student</strong> Achievement results are rounded to the nearest whole percent.<br />
State % of<br />
<strong>Student</strong>s<br />
Met<br />
Standard<br />
(Proficient)<br />
and<br />
Commended<br />
(Advanced)<br />
%<br />
Tested<br />
(In<br />
<strong>Campus</strong>)<br />
Percent of <strong>Student</strong>s in <strong>Campus</strong> at<br />
Each Achievement <strong>Level</strong><br />
%<br />
Not<br />
Meeting<br />
Standard<br />
(Basic)<br />
%<br />
Met<br />
Standard<br />
(Proficient)<br />
%<br />
Commended<br />
(Advanced)<br />
All <strong>Student</strong>s 2010-11 98 94 89 >99% 2 43 55<br />
American Indian/Alaskan<br />
Native<br />
2011-12 98 96 92 >99% 2 98 n/a<br />
2010-11<br />
* * 89 * * * *<br />
2011-12 * * 91 * * * n/a<br />
Asian 2010-11 98 98 95 >99% 2 42 56<br />
Native Hawaiian/Pacific<br />
Islander<br />
2011-12 98 99 96 >99% 2 98 n/a<br />
2010-11<br />
* * 91 * * * *<br />
2011-12 * * 90 * * * n/a<br />
African American 2010-11 * 89 83 >99% * * *<br />
2011-12 91 92 87 >99% 9 91 n/a<br />
Hispanic 2010-11 * 87 87 >99% * * *<br />
(Continued)<br />
2011-12 * 92 90 * * * n/a<br />
For grades 3-8, the 2011-12 assessment results are based on the State of <strong>Texas</strong> Assessments of Academic Readiness (STAAR) results at<br />
the TAKS-equivalency standard that was developed using the STAAR Bridge Study, including required changes due to the transition<br />
to the new assessment program. The 2010-11 assessment results are based on the <strong>Texas</strong> Assessment of Knowledge and Skills (TAKS)<br />
results at the Met Standard level.<br />
Special formats ('*', >99%,
<strong>Texas</strong> <strong>2012</strong> <strong>NCLB</strong> <strong>Report</strong> <strong>Card</strong> 2<br />
<strong>Part</strong> I - <strong>Campus</strong> <strong>Level</strong>: <strong>Student</strong> Performance for Each District and <strong>Campus</strong> Compared to the State, Percent of<br />
<strong>Student</strong>s Tested, <strong>Student</strong> Achievement by Proficiency <strong>Level</strong>, 2010-11, 2011-12*<br />
February 1, 2013<br />
For SCHELL EL (043910148) PLANO ISD<br />
Grade 3 Reading<br />
<strong>Student</strong> Group Year<br />
<strong>Campus</strong> % of<br />
<strong>Student</strong>s<br />
Met<br />
Standard<br />
(Proficient)<br />
and<br />
Commended<br />
(Advanced)<br />
District % of<br />
<strong>Student</strong>s<br />
Met<br />
Standard<br />
(Proficient)<br />
and<br />
Commended<br />
(Advanced)<br />
Portions of the <strong>NCLB</strong> <strong>Report</strong> <strong>Card</strong> (<strong>Part</strong> I, <strong>Part</strong> II, etc. or prior year information) may not appear when data are not reported.<br />
* Asian, Pacific Islander and Two or More Races are not available for indicators that use the former race/ethnicity definitions. See the<br />
<strong>Texas</strong> <strong>NCLB</strong> Glossary for details.<br />
<strong>Student</strong> Achievement results are rounded to the nearest whole percent.<br />
State % of<br />
<strong>Student</strong>s<br />
Met<br />
Standard<br />
(Proficient)<br />
and<br />
Commended<br />
(Advanced)<br />
%<br />
Tested<br />
(In<br />
<strong>Campus</strong>)<br />
Percent of <strong>Student</strong>s in <strong>Campus</strong> at<br />
Each Achievement <strong>Level</strong><br />
%<br />
Not<br />
Meeting<br />
Standard<br />
(Basic)<br />
%<br />
Met<br />
Standard<br />
(Proficient)<br />
%<br />
Commended<br />
(Advanced)<br />
White 2010-11 96 97 94 >99% 4 36 60<br />
2011-12 * 98 96 >99% * * n/a<br />
Two or More Races 2010-11 * 96 93 * * * *<br />
2011-12 * 98 95 * * * n/a<br />
Female 2010-11 * 95 91 >99% * * *<br />
2011-12 98 97 93 >99% 2 98 n/a<br />
Male 2010-11 97 93 87 >99% 3 44 54<br />
2011-12 98 96 90 >99% 2 98 n/a<br />
Special Education 2010-11 92 87 82 >99% 8 85 8<br />
2011-12 88 94 86 >99% 13 88 n/a<br />
Limited English Proficient 2010-11 88 84 85 >99% 12 59 29<br />
(Continued)<br />
2011-12 85 89 88 >99% 15 85 n/a<br />
For grades 3-8, the 2011-12 assessment results are based on the State of <strong>Texas</strong> Assessments of Academic Readiness (STAAR) results at<br />
the TAKS-equivalency standard that was developed using the STAAR Bridge Study, including required changes due to the transition<br />
to the new assessment program. The 2010-11 assessment results are based on the <strong>Texas</strong> Assessment of Knowledge and Skills (TAKS)<br />
results at the Met Standard level.<br />
Special formats ('*', >99%,
<strong>Texas</strong> <strong>2012</strong> <strong>NCLB</strong> <strong>Report</strong> <strong>Card</strong> 3<br />
<strong>Part</strong> I - <strong>Campus</strong> <strong>Level</strong>: <strong>Student</strong> Performance for Each District and <strong>Campus</strong> Compared to the State, Percent of<br />
<strong>Student</strong>s Tested, <strong>Student</strong> Achievement by Proficiency <strong>Level</strong>, 2010-11, 2011-12*<br />
February 1, 2013<br />
For SCHELL EL (043910148) PLANO ISD<br />
Grade 3 Reading<br />
<strong>Student</strong> Group Year<br />
<strong>Campus</strong> % of<br />
<strong>Student</strong>s<br />
Met<br />
Standard<br />
(Proficient)<br />
and<br />
Commended<br />
(Advanced)<br />
District % of<br />
<strong>Student</strong>s<br />
Met<br />
Standard<br />
(Proficient)<br />
and<br />
Commended<br />
(Advanced)<br />
Portions of the <strong>NCLB</strong> <strong>Report</strong> <strong>Card</strong> (<strong>Part</strong> I, <strong>Part</strong> II, etc. or prior year information) may not appear when data are not reported.<br />
* Asian, Pacific Islander and Two or More Races are not available for indicators that use the former race/ethnicity definitions. See the<br />
<strong>Texas</strong> <strong>NCLB</strong> Glossary for details.<br />
<strong>Student</strong> Achievement results are rounded to the nearest whole percent.<br />
State % of<br />
<strong>Student</strong>s<br />
Met<br />
Standard<br />
(Proficient)<br />
and<br />
Commended<br />
(Advanced)<br />
%<br />
Tested<br />
(In<br />
<strong>Campus</strong>)<br />
Percent of <strong>Student</strong>s in <strong>Campus</strong> at<br />
Each Achievement <strong>Level</strong><br />
%<br />
Not<br />
Meeting<br />
Standard<br />
(Basic)<br />
%<br />
Met<br />
Standard<br />
(Proficient)<br />
%<br />
Commended<br />
(Advanced)<br />
Economically Disadvantaged 2010-11 93 86 85 >99% 7 57 36<br />
2011-12 * 92 89 >99% * * n/a<br />
Migrant 2010-11 * * 80 * * * *<br />
2011-12 * * 84 * * * n/a<br />
For grades 3-8, the 2011-12 assessment results are based on the State of <strong>Texas</strong> Assessments of Academic Readiness (STAAR) results at<br />
the TAKS-equivalency standard that was developed using the STAAR Bridge Study, including required changes due to the transition<br />
to the new assessment program. The 2010-11 assessment results are based on the <strong>Texas</strong> Assessment of Knowledge and Skills (TAKS)<br />
results at the Met Standard level.<br />
Special formats ('*', >99%,
<strong>Texas</strong> <strong>2012</strong> <strong>NCLB</strong> <strong>Report</strong> <strong>Card</strong> 4<br />
<strong>Part</strong> I - <strong>Campus</strong> <strong>Level</strong>: <strong>Student</strong> Performance for Each District and <strong>Campus</strong> Compared to the State, Percent of<br />
<strong>Student</strong>s Tested, <strong>Student</strong> Achievement by Proficiency <strong>Level</strong>, 2010-11, 2011-12*<br />
February 1, 2013<br />
For SCHELL EL (043910148) PLANO ISD<br />
Grade 3 Mathematics<br />
<strong>Student</strong> Group Year<br />
<strong>Campus</strong> % of<br />
<strong>Student</strong>s<br />
Met<br />
Standard<br />
(Proficient)<br />
and<br />
Commended<br />
(Advanced)<br />
District % of<br />
<strong>Student</strong>s<br />
Met<br />
Standard<br />
(Proficient)<br />
and<br />
Commended<br />
(Advanced)<br />
Portions of the <strong>NCLB</strong> <strong>Report</strong> <strong>Card</strong> (<strong>Part</strong> I, <strong>Part</strong> II, etc. or prior year information) may not appear when data are not reported.<br />
* Asian, Pacific Islander and Two or More Races are not available for indicators that use the former race/ethnicity definitions. See the<br />
<strong>Texas</strong> <strong>NCLB</strong> Glossary for details.<br />
<strong>Student</strong> Achievement results are rounded to the nearest whole percent.<br />
State % of<br />
<strong>Student</strong>s<br />
Met<br />
Standard<br />
(Proficient)<br />
and<br />
Commended<br />
(Advanced)<br />
%<br />
Tested<br />
(In<br />
<strong>Campus</strong>)<br />
Percent of <strong>Student</strong>s in <strong>Campus</strong> at<br />
Each Achievement <strong>Level</strong><br />
%<br />
Not<br />
Meeting<br />
Standard<br />
(Basic)<br />
%<br />
Met<br />
Standard<br />
(Proficient)<br />
%<br />
Commended<br />
(Advanced)<br />
All <strong>Student</strong>s 2010-11 97 92 86 >99% 3 47 50<br />
American Indian/Alaskan<br />
Native<br />
2011-12 96 91 86 >99% 4 96 n/a<br />
2010-11<br />
* 93 86 * * * *<br />
2011-12 * * 87 * * * n/a<br />
Asian 2010-11 * 98 96 >99% * * *<br />
Native Hawaiian/Pacific<br />
Islander<br />
2011-12 98 98 96 >99% 2 98 n/a<br />
2010-11<br />
* * 88 * * * *<br />
2011-12 * * 87 * * * n/a<br />
African American 2010-11 92 79 77 >99% 8 67 25<br />
2011-12 91 74 76 >99% 9 91 n/a<br />
Hispanic 2010-11 90 84 84 >99% 10 40 50<br />
(Continued)<br />
2011-12 * 86 84 * * * n/a<br />
For grades 3-8, the 2011-12 assessment results are based on the State of <strong>Texas</strong> Assessments of Academic Readiness (STAAR) results at<br />
the TAKS-equivalency standard that was developed using the STAAR Bridge Study, including required changes due to the transition<br />
to the new assessment program. The 2010-11 assessment results are based on the <strong>Texas</strong> Assessment of Knowledge and Skills (TAKS)<br />
results at the Met Standard level.<br />
Special formats ('*', >99%,
<strong>Texas</strong> <strong>2012</strong> <strong>NCLB</strong> <strong>Report</strong> <strong>Card</strong> 5<br />
<strong>Part</strong> I - <strong>Campus</strong> <strong>Level</strong>: <strong>Student</strong> Performance for Each District and <strong>Campus</strong> Compared to the State, Percent of<br />
<strong>Student</strong>s Tested, <strong>Student</strong> Achievement by Proficiency <strong>Level</strong>, 2010-11, 2011-12*<br />
February 1, 2013<br />
For SCHELL EL (043910148) PLANO ISD<br />
Grade 3 Mathematics<br />
<strong>Student</strong> Group Year<br />
<strong>Campus</strong> % of<br />
<strong>Student</strong>s<br />
Met<br />
Standard<br />
(Proficient)<br />
and<br />
Commended<br />
(Advanced)<br />
District % of<br />
<strong>Student</strong>s<br />
Met<br />
Standard<br />
(Proficient)<br />
and<br />
Commended<br />
(Advanced)<br />
Portions of the <strong>NCLB</strong> <strong>Report</strong> <strong>Card</strong> (<strong>Part</strong> I, <strong>Part</strong> II, etc. or prior year information) may not appear when data are not reported.<br />
* Asian, Pacific Islander and Two or More Races are not available for indicators that use the former race/ethnicity definitions. See the<br />
<strong>Texas</strong> <strong>NCLB</strong> Glossary for details.<br />
<strong>Student</strong> Achievement results are rounded to the nearest whole percent.<br />
State % of<br />
<strong>Student</strong>s<br />
Met<br />
Standard<br />
(Proficient)<br />
and<br />
Commended<br />
(Advanced)<br />
%<br />
Tested<br />
(In<br />
<strong>Campus</strong>)<br />
Percent of <strong>Student</strong>s in <strong>Campus</strong> at<br />
Each Achievement <strong>Level</strong><br />
%<br />
Not<br />
Meeting<br />
Standard<br />
(Basic)<br />
%<br />
Met<br />
Standard<br />
(Proficient)<br />
%<br />
Commended<br />
(Advanced)<br />
White 2010-11 92 95 92 >99% 8 60 32<br />
2011-12 93 95 92 >99% 7 93 n/a<br />
Two or More Races 2010-11 * 92 90 * * * *<br />
2011-12 * 95 90 * * * n/a<br />
Female 2010-11 93 91 86 >99% 7 49 44<br />
2011-12 96 91 86 >99% 4 96 n/a<br />
Male 2010-11 99 92 87 >99% 1 45 54<br />
2011-12 96 91 86 >99% 4 96 n/a<br />
Special Education 2010-11 85 82 78 >99% 15 69 15<br />
2011-12 88 82 77 >99% 13 88 n/a<br />
Limited English Proficient 2010-11 94 82 83 >99% 6 59 35<br />
(Continued)<br />
2011-12 77 83 83 >99% 23 77 n/a<br />
For grades 3-8, the 2011-12 assessment results are based on the State of <strong>Texas</strong> Assessments of Academic Readiness (STAAR) results at<br />
the TAKS-equivalency standard that was developed using the STAAR Bridge Study, including required changes due to the transition<br />
to the new assessment program. The 2010-11 assessment results are based on the <strong>Texas</strong> Assessment of Knowledge and Skills (TAKS)<br />
results at the Met Standard level.<br />
Special formats ('*', >99%,
<strong>Texas</strong> <strong>2012</strong> <strong>NCLB</strong> <strong>Report</strong> <strong>Card</strong> 6<br />
<strong>Part</strong> I - <strong>Campus</strong> <strong>Level</strong>: <strong>Student</strong> Performance for Each District and <strong>Campus</strong> Compared to the State, Percent of<br />
<strong>Student</strong>s Tested, <strong>Student</strong> Achievement by Proficiency <strong>Level</strong>, 2010-11, 2011-12*<br />
February 1, 2013<br />
For SCHELL EL (043910148) PLANO ISD<br />
Grade 3 Mathematics<br />
<strong>Student</strong> Group Year<br />
<strong>Campus</strong> % of<br />
<strong>Student</strong>s<br />
Met<br />
Standard<br />
(Proficient)<br />
and<br />
Commended<br />
(Advanced)<br />
District % of<br />
<strong>Student</strong>s<br />
Met<br />
Standard<br />
(Proficient)<br />
and<br />
Commended<br />
(Advanced)<br />
Portions of the <strong>NCLB</strong> <strong>Report</strong> <strong>Card</strong> (<strong>Part</strong> I, <strong>Part</strong> II, etc. or prior year information) may not appear when data are not reported.<br />
* Asian, Pacific Islander and Two or More Races are not available for indicators that use the former race/ethnicity definitions. See the<br />
<strong>Texas</strong> <strong>NCLB</strong> Glossary for details.<br />
<strong>Student</strong> Achievement results are rounded to the nearest whole percent.<br />
State % of<br />
<strong>Student</strong>s<br />
Met<br />
Standard<br />
(Proficient)<br />
and<br />
Commended<br />
(Advanced)<br />
%<br />
Tested<br />
(In<br />
<strong>Campus</strong>)<br />
Percent of <strong>Student</strong>s in <strong>Campus</strong> at<br />
Each Achievement <strong>Level</strong><br />
%<br />
Not<br />
Meeting<br />
Standard<br />
(Basic)<br />
%<br />
Met<br />
Standard<br />
(Proficient)<br />
%<br />
Commended<br />
(Advanced)<br />
Economically Disadvantaged 2010-11 93 82 82 >99% 7 64 29<br />
2011-12 90 81 82 >99% 10 90 n/a<br />
Migrant 2010-11 * * 79 * * * *<br />
2011-12 * * 78 * * * n/a<br />
For grades 3-8, the 2011-12 assessment results are based on the State of <strong>Texas</strong> Assessments of Academic Readiness (STAAR) results at<br />
the TAKS-equivalency standard that was developed using the STAAR Bridge Study, including required changes due to the transition<br />
to the new assessment program. The 2010-11 assessment results are based on the <strong>Texas</strong> Assessment of Knowledge and Skills (TAKS)<br />
results at the Met Standard level.<br />
Special formats ('*', >99%,
<strong>Texas</strong> <strong>2012</strong> <strong>NCLB</strong> <strong>Report</strong> <strong>Card</strong> 7<br />
<strong>Part</strong> I - <strong>Campus</strong> <strong>Level</strong>: <strong>Student</strong> Performance for Each District and <strong>Campus</strong> Compared to the State, Percent of<br />
<strong>Student</strong>s Tested, <strong>Student</strong> Achievement by Proficiency <strong>Level</strong>, 2010-11, 2011-12*<br />
February 1, 2013<br />
For SCHELL EL (043910148) PLANO ISD<br />
Grade 4 Reading<br />
<strong>Student</strong> Group Year<br />
<strong>Campus</strong> % of<br />
<strong>Student</strong>s<br />
Met<br />
Standard<br />
(Proficient)<br />
and<br />
Commended<br />
(Advanced)<br />
District % of<br />
<strong>Student</strong>s<br />
Met<br />
Standard<br />
(Proficient)<br />
and<br />
Commended<br />
(Advanced)<br />
Portions of the <strong>NCLB</strong> <strong>Report</strong> <strong>Card</strong> (<strong>Part</strong> I, <strong>Part</strong> II, etc. or prior year information) may not appear when data are not reported.<br />
* Asian, Pacific Islander and Two or More Races are not available for indicators that use the former race/ethnicity definitions. See the<br />
<strong>Texas</strong> <strong>NCLB</strong> Glossary for details.<br />
<strong>Student</strong> Achievement results are rounded to the nearest whole percent.<br />
State % of<br />
<strong>Student</strong>s<br />
Met<br />
Standard<br />
(Proficient)<br />
and<br />
Commended<br />
(Advanced)<br />
%<br />
Tested<br />
(In<br />
<strong>Campus</strong>)<br />
Percent of <strong>Student</strong>s in <strong>Campus</strong> at<br />
Each Achievement <strong>Level</strong><br />
%<br />
Not<br />
Meeting<br />
Standard<br />
(Basic)<br />
%<br />
Met<br />
Standard<br />
(Proficient)<br />
%<br />
Commended<br />
(Advanced)<br />
All <strong>Student</strong>s 2010-11 97 93 85 >99% 3 32 65<br />
American Indian/Alaskan<br />
Native<br />
2011-12 95 93 87 98 5 95 n/a<br />
2010-11<br />
* * 86 * * * *<br />
2011-12 * 81 88 * * * n/a<br />
Asian 2010-11 97 97 93 >99% 3 22 75<br />
Native Hawaiian/Pacific<br />
Islander<br />
2011-12 93 97 94 99 7 93 n/a<br />
2010-11<br />
* * 84 * * * *<br />
2011-12 * * 90 * * * n/a<br />
African American 2010-11 92 84 79 >99% 8 62 31<br />
2011-12 * 85 79 >99% * * n/a<br />
Hispanic 2010-11 * 87 82 >99% * * *<br />
(Continued)<br />
2011-12 * 87 84 >99% * * n/a<br />
For grades 3-8, the 2011-12 assessment results are based on the State of <strong>Texas</strong> Assessments of Academic Readiness (STAAR) results at<br />
the TAKS-equivalency standard that was developed using the STAAR Bridge Study, including required changes due to the transition<br />
to the new assessment program. The 2010-11 assessment results are based on the <strong>Texas</strong> Assessment of Knowledge and Skills (TAKS)<br />
results at the Met Standard level.<br />
Special formats ('*', >99%,
<strong>Texas</strong> <strong>2012</strong> <strong>NCLB</strong> <strong>Report</strong> <strong>Card</strong> 8<br />
<strong>Part</strong> I - <strong>Campus</strong> <strong>Level</strong>: <strong>Student</strong> Performance for Each District and <strong>Campus</strong> Compared to the State, Percent of<br />
<strong>Student</strong>s Tested, <strong>Student</strong> Achievement by Proficiency <strong>Level</strong>, 2010-11, 2011-12*<br />
February 1, 2013<br />
For SCHELL EL (043910148) PLANO ISD<br />
Grade 4 Reading<br />
<strong>Student</strong> Group Year<br />
<strong>Campus</strong> % of<br />
<strong>Student</strong>s<br />
Met<br />
Standard<br />
(Proficient)<br />
and<br />
Commended<br />
(Advanced)<br />
District % of<br />
<strong>Student</strong>s<br />
Met<br />
Standard<br />
(Proficient)<br />
and<br />
Commended<br />
(Advanced)<br />
Portions of the <strong>NCLB</strong> <strong>Report</strong> <strong>Card</strong> (<strong>Part</strong> I, <strong>Part</strong> II, etc. or prior year information) may not appear when data are not reported.<br />
* Asian, Pacific Islander and Two or More Races are not available for indicators that use the former race/ethnicity definitions. See the<br />
<strong>Texas</strong> <strong>NCLB</strong> Glossary for details.<br />
<strong>Student</strong> Achievement results are rounded to the nearest whole percent.<br />
State % of<br />
<strong>Student</strong>s<br />
Met<br />
Standard<br />
(Proficient)<br />
and<br />
Commended<br />
(Advanced)<br />
%<br />
Tested<br />
(In<br />
<strong>Campus</strong>)<br />
Percent of <strong>Student</strong>s in <strong>Campus</strong> at<br />
Each Achievement <strong>Level</strong><br />
%<br />
Not<br />
Meeting<br />
Standard<br />
(Basic)<br />
%<br />
Met<br />
Standard<br />
(Proficient)<br />
%<br />
Commended<br />
(Advanced)<br />
White 2010-11 * 95 93 >99% * * *<br />
2011-12 96 97 94 96 4 96 n/a<br />
Two or More Races 2010-11 * 95 90 * * * *<br />
2011-12 * 98 91 * * * n/a<br />
Female 2010-11 * 93 87 >99% * * *<br />
2011-12 96 95 89 98 4 96 n/a<br />
Male 2010-11 95 92 84 >99% 5 32 63<br />
2011-12 94 92 85 99 6 94 n/a<br />
Special Education 2010-11 * 86 77 >99% * * *<br />
2011-12 75 86 78 92 25 75 n/a<br />
Limited English Proficient 2010-11 83 77 75 >99% 17 58 25<br />
(Continued)<br />
2011-12 70 75 79 >99% 30 70 n/a<br />
For grades 3-8, the 2011-12 assessment results are based on the State of <strong>Texas</strong> Assessments of Academic Readiness (STAAR) results at<br />
the TAKS-equivalency standard that was developed using the STAAR Bridge Study, including required changes due to the transition<br />
to the new assessment program. The 2010-11 assessment results are based on the <strong>Texas</strong> Assessment of Knowledge and Skills (TAKS)<br />
results at the Met Standard level.<br />
Special formats ('*', >99%,
<strong>Texas</strong> <strong>2012</strong> <strong>NCLB</strong> <strong>Report</strong> <strong>Card</strong> 9<br />
<strong>Part</strong> I - <strong>Campus</strong> <strong>Level</strong>: <strong>Student</strong> Performance for Each District and <strong>Campus</strong> Compared to the State, Percent of<br />
<strong>Student</strong>s Tested, <strong>Student</strong> Achievement by Proficiency <strong>Level</strong>, 2010-11, 2011-12*<br />
February 1, 2013<br />
For SCHELL EL (043910148) PLANO ISD<br />
Grade 4 Reading<br />
<strong>Student</strong> Group Year<br />
<strong>Campus</strong> % of<br />
<strong>Student</strong>s<br />
Met<br />
Standard<br />
(Proficient)<br />
and<br />
Commended<br />
(Advanced)<br />
District % of<br />
<strong>Student</strong>s<br />
Met<br />
Standard<br />
(Proficient)<br />
and<br />
Commended<br />
(Advanced)<br />
Portions of the <strong>NCLB</strong> <strong>Report</strong> <strong>Card</strong> (<strong>Part</strong> I, <strong>Part</strong> II, etc. or prior year information) may not appear when data are not reported.<br />
* Asian, Pacific Islander and Two or More Races are not available for indicators that use the former race/ethnicity definitions. See the<br />
<strong>Texas</strong> <strong>NCLB</strong> Glossary for details.<br />
<strong>Student</strong> Achievement results are rounded to the nearest whole percent.<br />
State % of<br />
<strong>Student</strong>s<br />
Met<br />
Standard<br />
(Proficient)<br />
and<br />
Commended<br />
(Advanced)<br />
%<br />
Tested<br />
(In<br />
<strong>Campus</strong>)<br />
Percent of <strong>Student</strong>s in <strong>Campus</strong> at<br />
Each Achievement <strong>Level</strong><br />
%<br />
Not<br />
Meeting<br />
Standard<br />
(Basic)<br />
%<br />
Met<br />
Standard<br />
(Proficient)<br />
%<br />
Commended<br />
(Advanced)<br />
Economically Disadvantaged 2010-11 * 82 80 >99% * * *<br />
2011-12 95 86 82 >99% 5 95 n/a<br />
Migrant 2010-11 * * 72 * * * *<br />
2011-12 * * 75 * * * n/a<br />
For grades 3-8, the 2011-12 assessment results are based on the State of <strong>Texas</strong> Assessments of Academic Readiness (STAAR) results at<br />
the TAKS-equivalency standard that was developed using the STAAR Bridge Study, including required changes due to the transition<br />
to the new assessment program. The 2010-11 assessment results are based on the <strong>Texas</strong> Assessment of Knowledge and Skills (TAKS)<br />
results at the Met Standard level.<br />
Special formats ('*', >99%,
<strong>Texas</strong> <strong>2012</strong> <strong>NCLB</strong> <strong>Report</strong> <strong>Card</strong> 10<br />
<strong>Part</strong> I - <strong>Campus</strong> <strong>Level</strong>: <strong>Student</strong> Performance for Each District and <strong>Campus</strong> Compared to the State, Percent of<br />
<strong>Student</strong>s Tested, <strong>Student</strong> Achievement by Proficiency <strong>Level</strong>, 2010-11, 2011-12*<br />
February 1, 2013<br />
For SCHELL EL (043910148) PLANO ISD<br />
Grade 4 Mathematics<br />
<strong>Student</strong> Group Year<br />
<strong>Campus</strong> % of<br />
<strong>Student</strong>s<br />
Met<br />
Standard<br />
(Proficient)<br />
and<br />
Commended<br />
(Advanced)<br />
District % of<br />
<strong>Student</strong>s<br />
Met<br />
Standard<br />
(Proficient)<br />
and<br />
Commended<br />
(Advanced)<br />
Portions of the <strong>NCLB</strong> <strong>Report</strong> <strong>Card</strong> (<strong>Part</strong> I, <strong>Part</strong> II, etc. or prior year information) may not appear when data are not reported.<br />
* Asian, Pacific Islander and Two or More Races are not available for indicators that use the former race/ethnicity definitions. See the<br />
<strong>Texas</strong> <strong>NCLB</strong> Glossary for details.<br />
<strong>Student</strong> Achievement results are rounded to the nearest whole percent.<br />
State % of<br />
<strong>Student</strong>s<br />
Met<br />
Standard<br />
(Proficient)<br />
and<br />
Commended<br />
(Advanced)<br />
%<br />
Tested<br />
(In<br />
<strong>Campus</strong>)<br />
Percent of <strong>Student</strong>s in <strong>Campus</strong> at<br />
Each Achievement <strong>Level</strong><br />
%<br />
Not<br />
Meeting<br />
Standard<br />
(Basic)<br />
%<br />
Met<br />
Standard<br />
(Proficient)<br />
%<br />
Commended<br />
(Advanced)<br />
All <strong>Student</strong>s 2010-11 97 93 88 >99% 3 35 62<br />
American Indian/Alaskan<br />
Native<br />
2011-12 98 92 89 >99% 2 98 n/a<br />
2010-11<br />
* * 89 * * * *<br />
2011-12 * 75 90 * * * n/a<br />
Asian 2010-11 * 99 96 >99% * * *<br />
Native Hawaiian/Pacific<br />
Islander<br />
2011-12 97 98 97 >99% 3 97 n/a<br />
2010-11<br />
* * 88 * * * *<br />
2011-12 * * 93 * * * n/a<br />
African American 2010-11 92 80 80 >99% 8 46 46<br />
2011-12 * 79 80 >99% * * n/a<br />
Hispanic 2010-11 * 89 86 >99% * * *<br />
(Continued)<br />
2011-12 * 86 88 >99% * * n/a<br />
For grades 3-8, the 2011-12 assessment results are based on the State of <strong>Texas</strong> Assessments of Academic Readiness (STAAR) results at<br />
the TAKS-equivalency standard that was developed using the STAAR Bridge Study, including required changes due to the transition<br />
to the new assessment program. The 2010-11 assessment results are based on the <strong>Texas</strong> Assessment of Knowledge and Skills (TAKS)<br />
results at the Met Standard level.<br />
Special formats ('*', >99%,
<strong>Texas</strong> <strong>2012</strong> <strong>NCLB</strong> <strong>Report</strong> <strong>Card</strong> 11<br />
<strong>Part</strong> I - <strong>Campus</strong> <strong>Level</strong>: <strong>Student</strong> Performance for Each District and <strong>Campus</strong> Compared to the State, Percent of<br />
<strong>Student</strong>s Tested, <strong>Student</strong> Achievement by Proficiency <strong>Level</strong>, 2010-11, 2011-12*<br />
February 1, 2013<br />
For SCHELL EL (043910148) PLANO ISD<br />
Grade 4 Mathematics<br />
<strong>Student</strong> Group Year<br />
<strong>Campus</strong> % of<br />
<strong>Student</strong>s<br />
Met<br />
Standard<br />
(Proficient)<br />
and<br />
Commended<br />
(Advanced)<br />
District % of<br />
<strong>Student</strong>s<br />
Met<br />
Standard<br />
(Proficient)<br />
and<br />
Commended<br />
(Advanced)<br />
Portions of the <strong>NCLB</strong> <strong>Report</strong> <strong>Card</strong> (<strong>Part</strong> I, <strong>Part</strong> II, etc. or prior year information) may not appear when data are not reported.<br />
* Asian, Pacific Islander and Two or More Races are not available for indicators that use the former race/ethnicity definitions. See the<br />
<strong>Texas</strong> <strong>NCLB</strong> Glossary for details.<br />
<strong>Student</strong> Achievement results are rounded to the nearest whole percent.<br />
State % of<br />
<strong>Student</strong>s<br />
Met<br />
Standard<br />
(Proficient)<br />
and<br />
Commended<br />
(Advanced)<br />
%<br />
Tested<br />
(In<br />
<strong>Campus</strong>)<br />
Percent of <strong>Student</strong>s in <strong>Campus</strong> at<br />
Each Achievement <strong>Level</strong><br />
%<br />
Not<br />
Meeting<br />
Standard<br />
(Basic)<br />
%<br />
Met<br />
Standard<br />
(Proficient)<br />
%<br />
Commended<br />
(Advanced)<br />
White 2010-11 95 95 92 >99% 5 48 48<br />
2011-12 * 96 94 >99% * * n/a<br />
Two or More Races 2010-11 * 95 91 * * * *<br />
2011-12 * 93 92 * * * n/a<br />
Female 2010-11 98 92 88 >99% 2 35 63<br />
2011-12 96 93 89 >99% 4 96 n/a<br />
Male 2010-11 97 93 88 >99% 3 35 62<br />
2011-12 * 92 88 >99% * * n/a<br />
Special Education 2010-11 78 86 79 >99% 22 67 11<br />
2011-12 * 85 80 >99% * * n/a<br />
Limited English Proficient 2010-11 * 84 83 >99% * * *<br />
(Continued)<br />
2011-12 90 81 85 >99% 10 90 n/a<br />
For grades 3-8, the 2011-12 assessment results are based on the State of <strong>Texas</strong> Assessments of Academic Readiness (STAAR) results at<br />
the TAKS-equivalency standard that was developed using the STAAR Bridge Study, including required changes due to the transition<br />
to the new assessment program. The 2010-11 assessment results are based on the <strong>Texas</strong> Assessment of Knowledge and Skills (TAKS)<br />
results at the Met Standard level.<br />
Special formats ('*', >99%,
<strong>Texas</strong> <strong>2012</strong> <strong>NCLB</strong> <strong>Report</strong> <strong>Card</strong> 12<br />
<strong>Part</strong> I - <strong>Campus</strong> <strong>Level</strong>: <strong>Student</strong> Performance for Each District and <strong>Campus</strong> Compared to the State, Percent of<br />
<strong>Student</strong>s Tested, <strong>Student</strong> Achievement by Proficiency <strong>Level</strong>, 2010-11, 2011-12*<br />
February 1, 2013<br />
For SCHELL EL (043910148) PLANO ISD<br />
Grade 4 Mathematics<br />
<strong>Student</strong> Group Year<br />
<strong>Campus</strong> % of<br />
<strong>Student</strong>s<br />
Met<br />
Standard<br />
(Proficient)<br />
and<br />
Commended<br />
(Advanced)<br />
District % of<br />
<strong>Student</strong>s<br />
Met<br />
Standard<br />
(Proficient)<br />
and<br />
Commended<br />
(Advanced)<br />
Portions of the <strong>NCLB</strong> <strong>Report</strong> <strong>Card</strong> (<strong>Part</strong> I, <strong>Part</strong> II, etc. or prior year information) may not appear when data are not reported.<br />
* Asian, Pacific Islander and Two or More Races are not available for indicators that use the former race/ethnicity definitions. See the<br />
<strong>Texas</strong> <strong>NCLB</strong> Glossary for details.<br />
<strong>Student</strong> Achievement results are rounded to the nearest whole percent.<br />
State % of<br />
<strong>Student</strong>s<br />
Met<br />
Standard<br />
(Proficient)<br />
and<br />
Commended<br />
(Advanced)<br />
%<br />
Tested<br />
(In<br />
<strong>Campus</strong>)<br />
Percent of <strong>Student</strong>s in <strong>Campus</strong> at<br />
Each Achievement <strong>Level</strong><br />
%<br />
Not<br />
Meeting<br />
Standard<br />
(Basic)<br />
%<br />
Met<br />
Standard<br />
(Proficient)<br />
%<br />
Commended<br />
(Advanced)<br />
Economically Disadvantaged 2010-11 94 84 84 >99% 6 72 22<br />
2011-12 * 85 85 >99% * * n/a<br />
Migrant 2010-11 * * 80 * * * *<br />
2011-12 * * 82 * * * n/a<br />
For grades 3-8, the 2011-12 assessment results are based on the State of <strong>Texas</strong> Assessments of Academic Readiness (STAAR) results at<br />
the TAKS-equivalency standard that was developed using the STAAR Bridge Study, including required changes due to the transition<br />
to the new assessment program. The 2010-11 assessment results are based on the <strong>Texas</strong> Assessment of Knowledge and Skills (TAKS)<br />
results at the Met Standard level.<br />
Special formats ('*', >99%,
<strong>Texas</strong> <strong>2012</strong> <strong>NCLB</strong> <strong>Report</strong> <strong>Card</strong> 13<br />
<strong>Part</strong> I - <strong>Campus</strong> <strong>Level</strong>: <strong>Student</strong> Performance for Each District and <strong>Campus</strong> Compared to the State, Percent of<br />
<strong>Student</strong>s Tested, <strong>Student</strong> Achievement by Proficiency <strong>Level</strong>, 2010-11, 2011-12*<br />
February 1, 2013<br />
For SCHELL EL (043910148) PLANO ISD<br />
Grade 5 Reading<br />
<strong>Student</strong> Group Year<br />
<strong>Campus</strong> % of<br />
<strong>Student</strong>s<br />
Met<br />
Standard<br />
(Proficient)<br />
and<br />
Commended<br />
(Advanced)<br />
District % of<br />
<strong>Student</strong>s<br />
Met<br />
Standard<br />
(Proficient)<br />
and<br />
Commended<br />
(Advanced)<br />
Portions of the <strong>NCLB</strong> <strong>Report</strong> <strong>Card</strong> (<strong>Part</strong> I, <strong>Part</strong> II, etc. or prior year information) may not appear when data are not reported.<br />
* Asian, Pacific Islander and Two or More Races are not available for indicators that use the former race/ethnicity definitions. See the<br />
<strong>Texas</strong> <strong>NCLB</strong> Glossary for details.<br />
<strong>Student</strong> Achievement results are rounded to the nearest whole percent.<br />
State % of<br />
<strong>Student</strong>s<br />
Met<br />
Standard<br />
(Proficient)<br />
and<br />
Commended<br />
(Advanced)<br />
%<br />
Tested<br />
(In<br />
<strong>Campus</strong>)<br />
Percent of <strong>Student</strong>s in <strong>Campus</strong> at<br />
Each Achievement <strong>Level</strong><br />
%<br />
Not<br />
Meeting<br />
Standard<br />
(Basic)<br />
%<br />
Met<br />
Standard<br />
(Proficient)<br />
%<br />
Commended<br />
(Advanced)<br />
All <strong>Student</strong>s 2010-11 97 97 92 >99% 3 43 55<br />
American Indian/Alaskan<br />
Native<br />
2011-12 98 94 87 >99% 2 98 n/a<br />
2010-11<br />
* 89 93 * * * *<br />
2011-12 * * 87 * * * n/a<br />
Asian 2010-11 98 98 96 >99% 2 35 63<br />
Native Hawaiian/Pacific<br />
Islander<br />
2011-12 98 98 95 >99% 2 98 n/a<br />
2010-11<br />
* * 94 * * * *<br />
2011-12 * * 88 * * * n/a<br />
African American 2010-11 * 94 90 >99% * * *<br />
2011-12 * 87 82 >99% * * n/a<br />
Hispanic 2010-11 * 93 90 >99% * * *<br />
(Continued)<br />
2011-12 * 89 84 >99% * * n/a<br />
For grades 3-8, the 2011-12 assessment results are based on the State of <strong>Texas</strong> Assessments of Academic Readiness (STAAR) results at<br />
the TAKS-equivalency standard that was developed using the STAAR Bridge Study, including required changes due to the transition<br />
to the new assessment program. The 2010-11 assessment results are based on the <strong>Texas</strong> Assessment of Knowledge and Skills (TAKS)<br />
results at the Met Standard level.<br />
Special formats ('*', >99%,
<strong>Texas</strong> <strong>2012</strong> <strong>NCLB</strong> <strong>Report</strong> <strong>Card</strong> 14<br />
<strong>Part</strong> I - <strong>Campus</strong> <strong>Level</strong>: <strong>Student</strong> Performance for Each District and <strong>Campus</strong> Compared to the State, Percent of<br />
<strong>Student</strong>s Tested, <strong>Student</strong> Achievement by Proficiency <strong>Level</strong>, 2010-11, 2011-12*<br />
February 1, 2013<br />
For SCHELL EL (043910148) PLANO ISD<br />
Grade 5 Reading<br />
<strong>Student</strong> Group Year<br />
<strong>Campus</strong> % of<br />
<strong>Student</strong>s<br />
Met<br />
Standard<br />
(Proficient)<br />
and<br />
Commended<br />
(Advanced)<br />
District % of<br />
<strong>Student</strong>s<br />
Met<br />
Standard<br />
(Proficient)<br />
and<br />
Commended<br />
(Advanced)<br />
Portions of the <strong>NCLB</strong> <strong>Report</strong> <strong>Card</strong> (<strong>Part</strong> I, <strong>Part</strong> II, etc. or prior year information) may not appear when data are not reported.<br />
* Asian, Pacific Islander and Two or More Races are not available for indicators that use the former race/ethnicity definitions. See the<br />
<strong>Texas</strong> <strong>NCLB</strong> Glossary for details.<br />
<strong>Student</strong> Achievement results are rounded to the nearest whole percent.<br />
State % of<br />
<strong>Student</strong>s<br />
Met<br />
Standard<br />
(Proficient)<br />
and<br />
Commended<br />
(Advanced)<br />
%<br />
Tested<br />
(In<br />
<strong>Campus</strong>)<br />
Percent of <strong>Student</strong>s in <strong>Campus</strong> at<br />
Each Achievement <strong>Level</strong><br />
%<br />
Not<br />
Meeting<br />
Standard<br />
(Basic)<br />
%<br />
Met<br />
Standard<br />
(Proficient)<br />
%<br />
Commended<br />
(Advanced)<br />
White 2010-11 94 99 97 >99% 6 52 42<br />
2011-12 96 96 93 >99% 4 96 n/a<br />
Two or More Races 2010-11 * 99 96 * * * *<br />
2011-12 * 99 92 * * * n/a<br />
Female 2010-11 99 97 93 >99% 1 40 59<br />
2011-12 * 95 89 >99% * * n/a<br />
Male 2010-11 96 97 91 >99% 4 47 49<br />
2011-12 97 93 86 >99% 3 97 n/a<br />
Special Education 2010-11 86 94 87 >99% 14 * *<br />
2011-12 90 88 78 >99% 10 90 n/a<br />
Limited English Proficient 2010-11 67 79 79 >99% 33 50 17<br />
(Continued)<br />
2011-12 * 74 72 >99% * * n/a<br />
For grades 3-8, the 2011-12 assessment results are based on the State of <strong>Texas</strong> Assessments of Academic Readiness (STAAR) results at<br />
the TAKS-equivalency standard that was developed using the STAAR Bridge Study, including required changes due to the transition<br />
to the new assessment program. The 2010-11 assessment results are based on the <strong>Texas</strong> Assessment of Knowledge and Skills (TAKS)<br />
results at the Met Standard level.<br />
Special formats ('*', >99%,
<strong>Texas</strong> <strong>2012</strong> <strong>NCLB</strong> <strong>Report</strong> <strong>Card</strong> 15<br />
<strong>Part</strong> I - <strong>Campus</strong> <strong>Level</strong>: <strong>Student</strong> Performance for Each District and <strong>Campus</strong> Compared to the State, Percent of<br />
<strong>Student</strong>s Tested, <strong>Student</strong> Achievement by Proficiency <strong>Level</strong>, 2010-11, 2011-12*<br />
February 1, 2013<br />
For SCHELL EL (043910148) PLANO ISD<br />
Grade 5 Reading<br />
<strong>Student</strong> Group Year<br />
<strong>Campus</strong> % of<br />
<strong>Student</strong>s<br />
Met<br />
Standard<br />
(Proficient)<br />
and<br />
Commended<br />
(Advanced)<br />
District % of<br />
<strong>Student</strong>s<br />
Met<br />
Standard<br />
(Proficient)<br />
and<br />
Commended<br />
(Advanced)<br />
Portions of the <strong>NCLB</strong> <strong>Report</strong> <strong>Card</strong> (<strong>Part</strong> I, <strong>Part</strong> II, etc. or prior year information) may not appear when data are not reported.<br />
* Asian, Pacific Islander and Two or More Races are not available for indicators that use the former race/ethnicity definitions. See the<br />
<strong>Texas</strong> <strong>NCLB</strong> Glossary for details.<br />
<strong>Student</strong> Achievement results are rounded to the nearest whole percent.<br />
State % of<br />
<strong>Student</strong>s<br />
Met<br />
Standard<br />
(Proficient)<br />
and<br />
Commended<br />
(Advanced)<br />
%<br />
Tested<br />
(In<br />
<strong>Campus</strong>)<br />
Percent of <strong>Student</strong>s in <strong>Campus</strong> at<br />
Each Achievement <strong>Level</strong><br />
%<br />
Not<br />
Meeting<br />
Standard<br />
(Basic)<br />
%<br />
Met<br />
Standard<br />
(Proficient)<br />
%<br />
Commended<br />
(Advanced)<br />
Economically Disadvantaged 2010-11 * 93 89 >99% * * *<br />
2011-12 * 86 83 >99% * * n/a<br />
Migrant 2010-11 * * 82 * * * *<br />
2011-12 * * 76 * * * n/a<br />
For grades 3-8, the 2011-12 assessment results are based on the State of <strong>Texas</strong> Assessments of Academic Readiness (STAAR) results at<br />
the TAKS-equivalency standard that was developed using the STAAR Bridge Study, including required changes due to the transition<br />
to the new assessment program. The 2010-11 assessment results are based on the <strong>Texas</strong> Assessment of Knowledge and Skills (TAKS)<br />
results at the Met Standard level.<br />
Special formats ('*', >99%,
<strong>Texas</strong> <strong>2012</strong> <strong>NCLB</strong> <strong>Report</strong> <strong>Card</strong> 16<br />
<strong>Part</strong> I - <strong>Campus</strong> <strong>Level</strong>: <strong>Student</strong> Performance for Each District and <strong>Campus</strong> Compared to the State, Percent of<br />
<strong>Student</strong>s Tested, <strong>Student</strong> Achievement by Proficiency <strong>Level</strong>, 2010-11, 2011-12*<br />
February 1, 2013<br />
For SCHELL EL (043910148) PLANO ISD<br />
Grade 5 Mathematics<br />
<strong>Student</strong> Group Year<br />
<strong>Campus</strong> % of<br />
<strong>Student</strong>s<br />
Met<br />
Standard<br />
(Proficient)<br />
and<br />
Commended<br />
(Advanced)<br />
District % of<br />
<strong>Student</strong>s<br />
Met<br />
Standard<br />
(Proficient)<br />
and<br />
Commended<br />
(Advanced)<br />
Portions of the <strong>NCLB</strong> <strong>Report</strong> <strong>Card</strong> (<strong>Part</strong> I, <strong>Part</strong> II, etc. or prior year information) may not appear when data are not reported.<br />
* Asian, Pacific Islander and Two or More Races are not available for indicators that use the former race/ethnicity definitions. See the<br />
<strong>Texas</strong> <strong>NCLB</strong> Glossary for details.<br />
<strong>Student</strong> Achievement results are rounded to the nearest whole percent.<br />
State % of<br />
<strong>Student</strong>s<br />
Met<br />
Standard<br />
(Proficient)<br />
and<br />
Commended<br />
(Advanced)<br />
%<br />
Tested<br />
(In<br />
<strong>Campus</strong>)<br />
Percent of <strong>Student</strong>s in <strong>Campus</strong> at<br />
Each Achievement <strong>Level</strong><br />
%<br />
Not<br />
Meeting<br />
Standard<br />
(Basic)<br />
%<br />
Met<br />
Standard<br />
(Proficient)<br />
%<br />
Commended<br />
(Advanced)<br />
All <strong>Student</strong>s 2010-11 97 96 92 >99% 3 39 58<br />
American Indian/Alaskan<br />
Native<br />
2011-12 99 93 86 >99% 1 99 n/a<br />
2010-11<br />
* 78 92 * * * *<br />
2011-12 * * 85 * * * n/a<br />
Asian 2010-11 * 99 96 >99% * * *<br />
Native Hawaiian/Pacific<br />
Islander<br />
2011-12 * 99 96 >99% * * n/a<br />
2010-11<br />
* * 91 * * * *<br />
2011-12 * * 88 * * * n/a<br />
African American 2010-11 92 91 86 >99% 8 38 54<br />
2011-12 * 82 78 >99% * * n/a<br />
Hispanic 2010-11 * 94 91 >99% * * *<br />
(Continued)<br />
2011-12 * 86 84 >99% * * n/a<br />
For grades 3-8, the 2011-12 assessment results are based on the State of <strong>Texas</strong> Assessments of Academic Readiness (STAAR) results at<br />
the TAKS-equivalency standard that was developed using the STAAR Bridge Study, including required changes due to the transition<br />
to the new assessment program. The 2010-11 assessment results are based on the <strong>Texas</strong> Assessment of Knowledge and Skills (TAKS)<br />
results at the Met Standard level.<br />
Special formats ('*', >99%,
<strong>Texas</strong> <strong>2012</strong> <strong>NCLB</strong> <strong>Report</strong> <strong>Card</strong> 17<br />
<strong>Part</strong> I - <strong>Campus</strong> <strong>Level</strong>: <strong>Student</strong> Performance for Each District and <strong>Campus</strong> Compared to the State, Percent of<br />
<strong>Student</strong>s Tested, <strong>Student</strong> Achievement by Proficiency <strong>Level</strong>, 2010-11, 2011-12*<br />
February 1, 2013<br />
For SCHELL EL (043910148) PLANO ISD<br />
Grade 5 Mathematics<br />
<strong>Student</strong> Group Year<br />
<strong>Campus</strong> % of<br />
<strong>Student</strong>s<br />
Met<br />
Standard<br />
(Proficient)<br />
and<br />
Commended<br />
(Advanced)<br />
District % of<br />
<strong>Student</strong>s<br />
Met<br />
Standard<br />
(Proficient)<br />
and<br />
Commended<br />
(Advanced)<br />
Portions of the <strong>NCLB</strong> <strong>Report</strong> <strong>Card</strong> (<strong>Part</strong> I, <strong>Part</strong> II, etc. or prior year information) may not appear when data are not reported.<br />
* Asian, Pacific Islander and Two or More Races are not available for indicators that use the former race/ethnicity definitions. See the<br />
<strong>Texas</strong> <strong>NCLB</strong> Glossary for details.<br />
<strong>Student</strong> Achievement results are rounded to the nearest whole percent.<br />
State % of<br />
<strong>Student</strong>s<br />
Met<br />
Standard<br />
(Proficient)<br />
and<br />
Commended<br />
(Advanced)<br />
%<br />
Tested<br />
(In<br />
<strong>Campus</strong>)<br />
Percent of <strong>Student</strong>s in <strong>Campus</strong> at<br />
Each Achievement <strong>Level</strong><br />
%<br />
Not<br />
Meeting<br />
Standard<br />
(Basic)<br />
%<br />
Met<br />
Standard<br />
(Proficient)<br />
%<br />
Commended<br />
(Advanced)<br />
White 2010-11 94 98 96 >99% 6 48 45<br />
2011-12 96 96 92 >99% 4 96 n/a<br />
Two or More Races 2010-11 * 96 94 * * * *<br />
2011-12 * 98 90 * * * n/a<br />
Female 2010-11 99 96 92 >99% 1 40 59<br />
2011-12 * 93 87 >99% * * n/a<br />
Male 2010-11 96 96 92 >99% 4 39 57<br />
2011-12 98 93 86 >99% 2 98 n/a<br />
Special Education 2010-11 * 91 85 >99% * * *<br />
2011-12 90 82 74 >99% 10 90 n/a<br />
Limited English Proficient 2010-11 83 85 84 >99% 17 50 33<br />
(Continued)<br />
2011-12 * 77 77 >99% * * n/a<br />
For grades 3-8, the 2011-12 assessment results are based on the State of <strong>Texas</strong> Assessments of Academic Readiness (STAAR) results at<br />
the TAKS-equivalency standard that was developed using the STAAR Bridge Study, including required changes due to the transition<br />
to the new assessment program. The 2010-11 assessment results are based on the <strong>Texas</strong> Assessment of Knowledge and Skills (TAKS)<br />
results at the Met Standard level.<br />
Special formats ('*', >99%,
<strong>Texas</strong> <strong>2012</strong> <strong>NCLB</strong> <strong>Report</strong> <strong>Card</strong> 18<br />
<strong>Part</strong> I - <strong>Campus</strong> <strong>Level</strong>: <strong>Student</strong> Performance for Each District and <strong>Campus</strong> Compared to the State, Percent of<br />
<strong>Student</strong>s Tested, <strong>Student</strong> Achievement by Proficiency <strong>Level</strong>, 2010-11, 2011-12*<br />
February 1, 2013<br />
For SCHELL EL (043910148) PLANO ISD<br />
Grade 5 Mathematics<br />
<strong>Student</strong> Group Year<br />
<strong>Campus</strong> % of<br />
<strong>Student</strong>s<br />
Met<br />
Standard<br />
(Proficient)<br />
and<br />
Commended<br />
(Advanced)<br />
District % of<br />
<strong>Student</strong>s<br />
Met<br />
Standard<br />
(Proficient)<br />
and<br />
Commended<br />
(Advanced)<br />
Portions of the <strong>NCLB</strong> <strong>Report</strong> <strong>Card</strong> (<strong>Part</strong> I, <strong>Part</strong> II, etc. or prior year information) may not appear when data are not reported.<br />
* Asian, Pacific Islander and Two or More Races are not available for indicators that use the former race/ethnicity definitions. See the<br />
<strong>Texas</strong> <strong>NCLB</strong> Glossary for details.<br />
<strong>Student</strong> Achievement results are rounded to the nearest whole percent.<br />
State % of<br />
<strong>Student</strong>s<br />
Met<br />
Standard<br />
(Proficient)<br />
and<br />
Commended<br />
(Advanced)<br />
%<br />
Tested<br />
(In<br />
<strong>Campus</strong>)<br />
Percent of <strong>Student</strong>s in <strong>Campus</strong> at<br />
Each Achievement <strong>Level</strong><br />
%<br />
Not<br />
Meeting<br />
Standard<br />
(Basic)<br />
%<br />
Met<br />
Standard<br />
(Proficient)<br />
%<br />
Commended<br />
(Advanced)<br />
Economically Disadvantaged 2010-11 * 92 89 >99% * * *<br />
2011-12 93 83 82 >99% 7 93 n/a<br />
Migrant 2010-11 * * 85 * * * *<br />
2011-12 * * 78 * * * n/a<br />
For grades 3-8, the 2011-12 assessment results are based on the State of <strong>Texas</strong> Assessments of Academic Readiness (STAAR) results at<br />
the TAKS-equivalency standard that was developed using the STAAR Bridge Study, including required changes due to the transition<br />
to the new assessment program. The 2010-11 assessment results are based on the <strong>Texas</strong> Assessment of Knowledge and Skills (TAKS)<br />
results at the Met Standard level.<br />
Special formats ('*', >99%,
<strong>Texas</strong> <strong>2012</strong> <strong>NCLB</strong> <strong>Report</strong> <strong>Card</strong> 19<br />
<strong>Part</strong> I - <strong>Campus</strong> <strong>Level</strong>: <strong>Student</strong> Performance for Each District and <strong>Campus</strong> Compared to the State, Percent of<br />
<strong>Student</strong>s Tested, <strong>Student</strong> Achievement by Proficiency <strong>Level</strong>, 2010-11, 2011-12*<br />
February 1, 2013<br />
For SCHELL EL (043910148) PLANO ISD<br />
Grade 5 Science<br />
<strong>Student</strong> Group Year<br />
<strong>Campus</strong> % of<br />
<strong>Student</strong>s<br />
Met<br />
Standard<br />
(Proficient)<br />
and<br />
Commended<br />
(Advanced)<br />
District % of<br />
<strong>Student</strong>s<br />
Met<br />
Standard<br />
(Proficient)<br />
and<br />
Commended<br />
(Advanced)<br />
Portions of the <strong>NCLB</strong> <strong>Report</strong> <strong>Card</strong> (<strong>Part</strong> I, <strong>Part</strong> II, etc. or prior year information) may not appear when data are not reported.<br />
* Asian, Pacific Islander and Two or More Races are not available for indicators that use the former race/ethnicity definitions. See the<br />
<strong>Texas</strong> <strong>NCLB</strong> Glossary for details.<br />
<strong>Student</strong> Achievement results are rounded to the nearest whole percent.<br />
State % of<br />
<strong>Student</strong>s<br />
Met<br />
Standard<br />
(Proficient)<br />
and<br />
Commended<br />
(Advanced)<br />
%<br />
Tested<br />
(In<br />
<strong>Campus</strong>)<br />
Percent of <strong>Student</strong>s in <strong>Campus</strong> at<br />
Each Achievement <strong>Level</strong><br />
%<br />
Not<br />
Meeting<br />
Standard<br />
(Basic)<br />
%<br />
Met<br />
Standard<br />
(Proficient)<br />
%<br />
Commended<br />
(Advanced)<br />
All <strong>Student</strong>s 2010-11 96 91 86 >99% 4 34 62<br />
American Indian/Alaskan<br />
Native<br />
2011-12 98 93 87 >99% 2 98 n/a<br />
2010-11<br />
* 78 86 * * * *<br />
2011-12 * * 87 * * * n/a<br />
Asian 2010-11 97 96 93 >99% 3 37 60<br />
Native Hawaiian/Pacific<br />
Islander<br />
2011-12 * 98 97 >99% * * n/a<br />
2010-11<br />
* * 83 * * * *<br />
2011-12 * * 87 * * * n/a<br />
African American 2010-11 93 81 78 >99% 7 36 57<br />
2011-12 * 83 79 >99% * * n/a<br />
Hispanic 2010-11 * 84 82 >99% * * *<br />
(Continued)<br />
2011-12 * 87 84 >99% * * n/a<br />
For grades 3-8, the 2011-12 assessment results are based on the State of <strong>Texas</strong> Assessments of Academic Readiness (STAAR) results at<br />
the TAKS-equivalency standard that was developed using the STAAR Bridge Study, including required changes due to the transition<br />
to the new assessment program. The 2010-11 assessment results are based on the <strong>Texas</strong> Assessment of Knowledge and Skills (TAKS)<br />
results at the Met Standard level.<br />
Special formats ('*', >99%,
<strong>Texas</strong> <strong>2012</strong> <strong>NCLB</strong> <strong>Report</strong> <strong>Card</strong> 20<br />
<strong>Part</strong> I - <strong>Campus</strong> <strong>Level</strong>: <strong>Student</strong> Performance for Each District and <strong>Campus</strong> Compared to the State, Percent of<br />
<strong>Student</strong>s Tested, <strong>Student</strong> Achievement by Proficiency <strong>Level</strong>, 2010-11, 2011-12*<br />
February 1, 2013<br />
For SCHELL EL (043910148) PLANO ISD<br />
Grade 5 Science<br />
<strong>Student</strong> Group Year<br />
<strong>Campus</strong> % of<br />
<strong>Student</strong>s<br />
Met<br />
Standard<br />
(Proficient)<br />
and<br />
Commended<br />
(Advanced)<br />
District % of<br />
<strong>Student</strong>s<br />
Met<br />
Standard<br />
(Proficient)<br />
and<br />
Commended<br />
(Advanced)<br />
Portions of the <strong>NCLB</strong> <strong>Report</strong> <strong>Card</strong> (<strong>Part</strong> I, <strong>Part</strong> II, etc. or prior year information) may not appear when data are not reported.<br />
* Asian, Pacific Islander and Two or More Races are not available for indicators that use the former race/ethnicity definitions. See the<br />
<strong>Texas</strong> <strong>NCLB</strong> Glossary for details.<br />
<strong>Student</strong> Achievement results are rounded to the nearest whole percent.<br />
State % of<br />
<strong>Student</strong>s<br />
Met<br />
Standard<br />
(Proficient)<br />
and<br />
Commended<br />
(Advanced)<br />
%<br />
Tested<br />
(In<br />
<strong>Campus</strong>)<br />
Percent of <strong>Student</strong>s in <strong>Campus</strong> at<br />
Each Achievement <strong>Level</strong><br />
%<br />
Not<br />
Meeting<br />
Standard<br />
(Basic)<br />
%<br />
Met<br />
Standard<br />
(Proficient)<br />
%<br />
Commended<br />
(Advanced)<br />
White 2010-11 94 95 93 >99% 6 27 67<br />
2011-12 96 96 94 >99% 4 96 n/a<br />
Two or More Races 2010-11 * 96 91 * * * *<br />
2011-12 * 95 92 * * * n/a<br />
Female 2010-11 97 91 84 >99% 3 39 59<br />
2011-12 98 92 86 >99% 2 98 n/a<br />
Male 2010-11 94 92 87 >99% 6 28 66<br />
2011-12 98 94 88 >99% 2 98 n/a<br />
Special Education 2010-11 71 72 67 >99% 29 * *<br />
2011-12 80 78 69 >99% 20 80 n/a<br />
Limited English Proficient 2010-11 67 68 68 >99% 33 50 17<br />
(Continued)<br />
2011-12 * 69 72 * * * n/a<br />
For grades 3-8, the 2011-12 assessment results are based on the State of <strong>Texas</strong> Assessments of Academic Readiness (STAAR) results at<br />
the TAKS-equivalency standard that was developed using the STAAR Bridge Study, including required changes due to the transition<br />
to the new assessment program. The 2010-11 assessment results are based on the <strong>Texas</strong> Assessment of Knowledge and Skills (TAKS)<br />
results at the Met Standard level.<br />
Special formats ('*', >99%,
<strong>Texas</strong> <strong>2012</strong> <strong>NCLB</strong> <strong>Report</strong> <strong>Card</strong> 21<br />
<strong>Part</strong> I - <strong>Campus</strong> <strong>Level</strong>: <strong>Student</strong> Performance for Each District and <strong>Campus</strong> Compared to the State, Percent of<br />
<strong>Student</strong>s Tested, <strong>Student</strong> Achievement by Proficiency <strong>Level</strong>, 2010-11, 2011-12*<br />
February 1, 2013<br />
For SCHELL EL (043910148) PLANO ISD<br />
Grade 5 Science<br />
<strong>Student</strong> Group Year<br />
<strong>Campus</strong> % of<br />
<strong>Student</strong>s<br />
Met<br />
Standard<br />
(Proficient)<br />
and<br />
Commended<br />
(Advanced)<br />
District % of<br />
<strong>Student</strong>s<br />
Met<br />
Standard<br />
(Proficient)<br />
and<br />
Commended<br />
(Advanced)<br />
Portions of the <strong>NCLB</strong> <strong>Report</strong> <strong>Card</strong> (<strong>Part</strong> I, <strong>Part</strong> II, etc. or prior year information) may not appear when data are not reported.<br />
* Asian, Pacific Islander and Two or More Races are not available for indicators that use the former race/ethnicity definitions. See the<br />
<strong>Texas</strong> <strong>NCLB</strong> Glossary for details.<br />
<strong>Student</strong> Achievement results are rounded to the nearest whole percent.<br />
State % of<br />
<strong>Student</strong>s<br />
Met<br />
Standard<br />
(Proficient)<br />
and<br />
Commended<br />
(Advanced)<br />
%<br />
Tested<br />
(In<br />
<strong>Campus</strong>)<br />
Percent of <strong>Student</strong>s in <strong>Campus</strong> at<br />
Each Achievement <strong>Level</strong><br />
%<br />
Not<br />
Meeting<br />
Standard<br />
(Basic)<br />
%<br />
Met<br />
Standard<br />
(Proficient)<br />
%<br />
Commended<br />
(Advanced)<br />
Economically Disadvantaged 2010-11 94 81 80 >99% 6 47 47<br />
2011-12 * 83 82 >99% * * n/a<br />
Migrant 2010-11 * * 74 * * * *<br />
2011-12 * * 76 * * * n/a<br />
For grades 3-8, the 2011-12 assessment results are based on the State of <strong>Texas</strong> Assessments of Academic Readiness (STAAR) results at<br />
the TAKS-equivalency standard that was developed using the STAAR Bridge Study, including required changes due to the transition<br />
to the new assessment program. The 2010-11 assessment results are based on the <strong>Texas</strong> Assessment of Knowledge and Skills (TAKS)<br />
results at the Met Standard level.<br />
Special formats ('*', >99%,
<strong>Texas</strong> <strong>2012</strong> <strong>NCLB</strong> <strong>Report</strong> <strong>Card</strong> 22<br />
<strong>Part</strong> II a. - <strong>Campus</strong> <strong>Level</strong>: Comparison Between <strong>Student</strong> Achievement and the State Academic Expectations as<br />
Measured by Adequate Yearly Progress (AYP)*<br />
February 1, 2013<br />
For SCHELL EL (043910148) PLANO ISD<br />
<strong>Student</strong> Group Year<br />
Percent<br />
Tested<br />
Target:<br />
95%<br />
Percent<br />
Tested<br />
Target:<br />
95%<br />
Reading/Language Arts<br />
Percent<br />
Tested<br />
Target:<br />
95%<br />
Percent<br />
Met<br />
Standard<br />
(Includes<br />
Proficient<br />
<strong>Level</strong><br />
and<br />
Above)<br />
'11<br />
Target:<br />
80%<br />
'12<br />
Target:<br />
87%<br />
Percent<br />
Met<br />
Standard<br />
(Includes<br />
Proficient<br />
<strong>Level</strong><br />
and<br />
Above)<br />
'11<br />
Target:<br />
80%<br />
'12<br />
Target:<br />
87%<br />
Percent<br />
Met<br />
Standard<br />
(Includes<br />
Proficient<br />
<strong>Level</strong><br />
and<br />
Above)<br />
'11<br />
Target:<br />
80%<br />
'12<br />
Target:<br />
87%<br />
<strong>Campus</strong> District State <strong>Campus</strong> District State<br />
All <strong>Student</strong>s 2010-11 >99% >99% >99% 97 94 88<br />
2011-12 99 >99% 99 95 94 88<br />
American Indian/Alaskan Native 2010-11 * >99% 99 * 93 88<br />
2011-12 * >99% 99 * 93 88<br />
Asian 2010-11 >99% >99% 99 98 98 94<br />
2011-12 99 >99% >99% 95 98 94<br />
Native Hawaiian/Pacific Islander 2010-11 * >99% 99 * 89 89<br />
2011-12 * 95 99 * 88 89<br />
African American 2010-11 >99% >99% >99% 95 88 83<br />
(Continued)<br />
2011-12 >99% >99% >99% 94 88 83<br />
Portions of the <strong>NCLB</strong> <strong>Report</strong> <strong>Card</strong> (<strong>Part</strong> I, <strong>Part</strong> II, etc. or prior year information) may not appear when data are not reported.<br />
* Asian, Pacific Islander and Two or More Races are not available for indicators that use the former race/ethnicity definitions. See the<br />
<strong>Texas</strong> <strong>NCLB</strong> Glossary for details.<br />
<strong>Student</strong> Achievement results are rounded to the nearest whole percent. Additional Academic Indicators (Graduation and Attendance<br />
Rate) are rounded to the nearest one-tenth of a percent (one decimal place).<br />
Special formats ('*', >99%,
<strong>Texas</strong> <strong>2012</strong> <strong>NCLB</strong> <strong>Report</strong> <strong>Card</strong> 23<br />
<strong>Part</strong> II a. - <strong>Campus</strong> <strong>Level</strong>: Comparison Between <strong>Student</strong> Achievement and the State Academic Expectations as<br />
Measured by Adequate Yearly Progress (AYP)*<br />
February 1, 2013<br />
For SCHELL EL (043910148) PLANO ISD<br />
<strong>Student</strong> Group Year<br />
Percent<br />
Tested<br />
Target:<br />
95%<br />
Percent<br />
Tested<br />
Target:<br />
95%<br />
Reading/Language Arts<br />
Percent<br />
Tested<br />
Target:<br />
95%<br />
Percent<br />
Met<br />
Standard<br />
(Includes<br />
Proficient<br />
<strong>Level</strong><br />
and<br />
Above)<br />
'11<br />
Target:<br />
80%<br />
'12<br />
Target:<br />
87%<br />
Percent<br />
Met<br />
Standard<br />
(Includes<br />
Proficient<br />
<strong>Level</strong><br />
and<br />
Above)<br />
'11<br />
Target:<br />
80%<br />
'12<br />
Target:<br />
87%<br />
Percent<br />
Met<br />
Standard<br />
(Includes<br />
Proficient<br />
<strong>Level</strong><br />
and<br />
Above)<br />
'11<br />
Target:<br />
80%<br />
'12<br />
Target:<br />
87%<br />
<strong>Campus</strong> District State <strong>Campus</strong> District State<br />
Hispanic 2010-11 >99% >99% 99 >99% 88 85<br />
2011-12 >99% >99% 99 >99% 88 85<br />
White 2010-11 >99% >99% >99% 96 96 94<br />
2011-12 99 >99% 99 96 96 94<br />
Two or More Races 2010-11 >99% >99% >99% >99% 96 92<br />
2011-12 >99% >99% >99% 71 96 93<br />
Female 2010-11 >99% >99% >99% 99 95 90<br />
2011-12 99 >99% >99% 97 95 90<br />
Male 2010-11 >99% >99% >99% 96 93 86<br />
(Continued)<br />
2011-12 99 >99% 99 94 93 86<br />
Portions of the <strong>NCLB</strong> <strong>Report</strong> <strong>Card</strong> (<strong>Part</strong> I, <strong>Part</strong> II, etc. or prior year information) may not appear when data are not reported.<br />
* Asian, Pacific Islander and Two or More Races are not available for indicators that use the former race/ethnicity definitions. See the<br />
<strong>Texas</strong> <strong>NCLB</strong> Glossary for details.<br />
<strong>Student</strong> Achievement results are rounded to the nearest whole percent. Additional Academic Indicators (Graduation and Attendance<br />
Rate) are rounded to the nearest one-tenth of a percent (one decimal place).<br />
Special formats ('*', >99%,
<strong>Texas</strong> <strong>2012</strong> <strong>NCLB</strong> <strong>Report</strong> <strong>Card</strong> 24<br />
<strong>Part</strong> II a. - <strong>Campus</strong> <strong>Level</strong>: Comparison Between <strong>Student</strong> Achievement and the State Academic Expectations as<br />
Measured by Adequate Yearly Progress (AYP)*<br />
February 1, 2013<br />
For SCHELL EL (043910148) PLANO ISD<br />
<strong>Student</strong> Group Year<br />
Percent<br />
Tested<br />
Target:<br />
95%<br />
Percent<br />
Tested<br />
Target:<br />
95%<br />
Reading/Language Arts<br />
Percent<br />
Tested<br />
Target:<br />
95%<br />
Percent<br />
Met<br />
Standard<br />
(Includes<br />
Proficient<br />
<strong>Level</strong><br />
and<br />
Above)<br />
'11<br />
Target:<br />
80%<br />
'12<br />
Target:<br />
87%<br />
Percent<br />
Met<br />
Standard<br />
(Includes<br />
Proficient<br />
<strong>Level</strong><br />
and<br />
Above)<br />
'11<br />
Target:<br />
80%<br />
'12<br />
Target:<br />
87%<br />
Percent<br />
Met<br />
Standard<br />
(Includes<br />
Proficient<br />
<strong>Level</strong><br />
and<br />
Above)<br />
'11<br />
Target:<br />
80%<br />
'12<br />
Target:<br />
87%<br />
<strong>Campus</strong> District State <strong>Campus</strong> District State<br />
Special Education 2010-11 >99% >99% 99 86 76 67<br />
2011-12 97 99 99 63 75 67<br />
Limited English Proficient 2010-11 >99% 99 99 95 84 78<br />
2011-12 >99% 99 99 88 83 79<br />
Economically Disadvantaged 2010-11 >99% >99% 99 96 85 83<br />
2011-12 >99% >99% 99 91 86 83<br />
Migrant 2010-11 * >99% 98 * * 76<br />
2011-12 * * 98 * * 76<br />
Portions of the <strong>NCLB</strong> <strong>Report</strong> <strong>Card</strong> (<strong>Part</strong> I, <strong>Part</strong> II, etc. or prior year information) may not appear when data are not reported.<br />
* Asian, Pacific Islander and Two or More Races are not available for indicators that use the former race/ethnicity definitions. See the<br />
<strong>Texas</strong> <strong>NCLB</strong> Glossary for details.<br />
<strong>Student</strong> Achievement results are rounded to the nearest whole percent. Additional Academic Indicators (Graduation and Attendance<br />
Rate) are rounded to the nearest one-tenth of a percent (one decimal place).<br />
Special formats ('*', >99%,
<strong>Texas</strong> <strong>2012</strong> <strong>NCLB</strong> <strong>Report</strong> <strong>Card</strong> 25<br />
<strong>Part</strong> II a. - <strong>Campus</strong> <strong>Level</strong>: Comparison Between <strong>Student</strong> Achievement and the State Academic Expectations as<br />
Measured by Adequate Yearly Progress (AYP)*<br />
February 1, 2013<br />
For SCHELL EL (043910148) PLANO ISD<br />
<strong>Student</strong> Group Year<br />
Percent<br />
Tested<br />
Target:<br />
95%<br />
Percent<br />
Tested<br />
Target:<br />
95%<br />
Percent<br />
Tested<br />
Target:<br />
95%<br />
Mathematics<br />
Percent<br />
Met<br />
Standard<br />
(Includes<br />
Proficient<br />
<strong>Level</strong><br />
and<br />
Above)<br />
'11<br />
Target:<br />
75%<br />
'12<br />
Target:<br />
83%<br />
Percent<br />
Met<br />
Standard<br />
(Includes<br />
Proficient<br />
<strong>Level</strong><br />
and<br />
Above)<br />
'11<br />
Target:<br />
75%<br />
'12<br />
Target:<br />
83%<br />
Percent<br />
Met<br />
Standard<br />
(Includes<br />
Proficient<br />
<strong>Level</strong><br />
and<br />
Above)<br />
'11<br />
Target:<br />
75%<br />
'12<br />
Target:<br />
83%<br />
<strong>Campus</strong> District State <strong>Campus</strong> District State<br />
All <strong>Student</strong>s 2010-11 >99% >99% >99% 96 91 84<br />
2011-12 >99% >99% >99% 97 91 83<br />
American Indian/Alaskan Native 2010-11 * >99% >99% * 89 84<br />
2011-12 * >99% >99% * 86 83<br />
Asian 2010-11 >99% >99% >99% 98 98 95<br />
2011-12 >99% >99% >99% 97 97 95<br />
Native Hawaiian/Pacific Islander 2010-11 * >99% >99% * 84 86<br />
2011-12 * >99% >99% * 76 87<br />
African American 2010-11 >99% >99% >99% 95 80 75<br />
(Continued)<br />
2011-12 >99% >99% >99% 94 78 73<br />
Portions of the <strong>NCLB</strong> <strong>Report</strong> <strong>Card</strong> (<strong>Part</strong> I, <strong>Part</strong> II, etc. or prior year information) may not appear when data are not reported.<br />
* Asian, Pacific Islander and Two or More Races are not available for indicators that use the former race/ethnicity definitions. See the<br />
<strong>Texas</strong> <strong>NCLB</strong> Glossary for details.<br />
<strong>Student</strong> Achievement results are rounded to the nearest whole percent. Additional Academic Indicators (Graduation and Attendance<br />
Rate) are rounded to the nearest one-tenth of a percent (one decimal place).<br />
Special formats ('*', >99%,
<strong>Texas</strong> <strong>2012</strong> <strong>NCLB</strong> <strong>Report</strong> <strong>Card</strong> 26<br />
<strong>Part</strong> II a. - <strong>Campus</strong> <strong>Level</strong>: Comparison Between <strong>Student</strong> Achievement and the State Academic Expectations as<br />
Measured by Adequate Yearly Progress (AYP)*<br />
February 1, 2013<br />
For SCHELL EL (043910148) PLANO ISD<br />
<strong>Student</strong> Group Year<br />
Percent<br />
Tested<br />
Target:<br />
95%<br />
Percent<br />
Tested<br />
Target:<br />
95%<br />
Percent<br />
Tested<br />
Target:<br />
95%<br />
Mathematics<br />
Percent<br />
Met<br />
Standard<br />
(Includes<br />
Proficient<br />
<strong>Level</strong><br />
and<br />
Above)<br />
'11<br />
Target:<br />
75%<br />
'12<br />
Target:<br />
83%<br />
Percent<br />
Met<br />
Standard<br />
(Includes<br />
Proficient<br />
<strong>Level</strong><br />
and<br />
Above)<br />
'11<br />
Target:<br />
75%<br />
'12<br />
Target:<br />
83%<br />
Percent<br />
Met<br />
Standard<br />
(Includes<br />
Proficient<br />
<strong>Level</strong><br />
and<br />
Above)<br />
'11<br />
Target:<br />
75%<br />
'12<br />
Target:<br />
83%<br />
<strong>Campus</strong> District State <strong>Campus</strong> District State<br />
Hispanic 2010-11 >99% >99% >99% 95 83 82<br />
2011-12 >99% >99% >99% >99% 83 80<br />
White 2010-11 >99% >99% >99% 94 94 91<br />
2011-12 >99% >99% >99% 96 94 90<br />
Two or More Races 2010-11 >99% >99% >99% 75 93 89<br />
2011-12 >99% >99% >99% 86 92 88<br />
Female 2010-11 >99% >99% >99% 96 91 85<br />
2011-12 >99% >99% >99% 97 91 84<br />
Male 2010-11 >99% >99% >99% 96 91 84<br />
(Continued)<br />
2011-12 >99% >99% >99% 97 90 83<br />
Portions of the <strong>NCLB</strong> <strong>Report</strong> <strong>Card</strong> (<strong>Part</strong> I, <strong>Part</strong> II, etc. or prior year information) may not appear when data are not reported.<br />
* Asian, Pacific Islander and Two or More Races are not available for indicators that use the former race/ethnicity definitions. See the<br />
<strong>Texas</strong> <strong>NCLB</strong> Glossary for details.<br />
<strong>Student</strong> Achievement results are rounded to the nearest whole percent. Additional Academic Indicators (Graduation and Attendance<br />
Rate) are rounded to the nearest one-tenth of a percent (one decimal place).<br />
Special formats ('*', >99%,
<strong>Texas</strong> <strong>2012</strong> <strong>NCLB</strong> <strong>Report</strong> <strong>Card</strong> 27<br />
<strong>Part</strong> II a. - <strong>Campus</strong> <strong>Level</strong>: Comparison Between <strong>Student</strong> Achievement and the State Academic Expectations as<br />
Measured by Adequate Yearly Progress (AYP)*<br />
February 1, 2013<br />
For SCHELL EL (043910148) PLANO ISD<br />
<strong>Student</strong> Group Year<br />
Percent<br />
Tested<br />
Target:<br />
95%<br />
Percent<br />
Tested<br />
Target:<br />
95%<br />
Percent<br />
Tested<br />
Target:<br />
95%<br />
Mathematics<br />
Percent<br />
Met<br />
Standard<br />
(Includes<br />
Proficient<br />
<strong>Level</strong><br />
and<br />
Above)<br />
'11<br />
Target:<br />
75%<br />
'12<br />
Target:<br />
83%<br />
Percent<br />
Met<br />
Standard<br />
(Includes<br />
Proficient<br />
<strong>Level</strong><br />
and<br />
Above)<br />
'11<br />
Target:<br />
75%<br />
'12<br />
Target:<br />
83%<br />
Percent<br />
Met<br />
Standard<br />
(Includes<br />
Proficient<br />
<strong>Level</strong><br />
and<br />
Above)<br />
'11<br />
Target:<br />
75%<br />
'12<br />
Target:<br />
83%<br />
<strong>Campus</strong> District State <strong>Campus</strong> District State<br />
Special Education 2010-11 >99% >99% >99% 71 70 63<br />
2011-12 >99% >99% 99 81 70 63<br />
Limited English Proficient 2010-11 >99% >99% >99% 93 82 79<br />
2011-12 >99% >99% >99% 93 82 79<br />
Economically Disadvantaged 2010-11 >99% >99% >99% 92 80 79<br />
2011-12 >99% >99% >99% 91 80 78<br />
Migrant 2010-11 * >99% >99% * * 75<br />
2011-12 * * 99 * * 73<br />
Portions of the <strong>NCLB</strong> <strong>Report</strong> <strong>Card</strong> (<strong>Part</strong> I, <strong>Part</strong> II, etc. or prior year information) may not appear when data are not reported.<br />
* Asian, Pacific Islander and Two or More Races are not available for indicators that use the former race/ethnicity definitions. See the<br />
<strong>Texas</strong> <strong>NCLB</strong> Glossary for details.<br />
<strong>Student</strong> Achievement results are rounded to the nearest whole percent. Additional Academic Indicators (Graduation and Attendance<br />
Rate) are rounded to the nearest one-tenth of a percent (one decimal place).<br />
Special formats ('*', >99%,
<strong>Texas</strong> <strong>2012</strong> <strong>NCLB</strong> <strong>Report</strong> <strong>Card</strong> 28<br />
<strong>Part</strong> II a. - <strong>Campus</strong> <strong>Level</strong>: Comparison Between <strong>Student</strong> Achievement and the State Academic Expectations as<br />
Measured by Adequate Yearly Progress (AYP)*<br />
February 1, 2013<br />
For SCHELL EL (043910148) PLANO ISD<br />
<strong>Student</strong> Group Year<br />
Four-year<br />
Graduation<br />
Rate<br />
'11 Target:<br />
75%<br />
'12 Target:<br />
75%<br />
Four-year<br />
Graduation<br />
Rate<br />
'11 Target:<br />
75%<br />
'12 Target:<br />
75%<br />
Additional Academic Indicators<br />
Four-year<br />
Graduation<br />
Rate<br />
'11 Target:<br />
75%<br />
'12 Target:<br />
75%<br />
Five-year<br />
Graduation<br />
Rate<br />
'11 Target:<br />
80%<br />
'12 Target:<br />
80%<br />
Five-year<br />
Graduation<br />
Rate<br />
'11 Target:<br />
80%<br />
'12 Target:<br />
80%<br />
Portions of the <strong>NCLB</strong> <strong>Report</strong> <strong>Card</strong> (<strong>Part</strong> I, <strong>Part</strong> II, etc. or prior year information) may not appear when data are not reported.<br />
Five-year<br />
Graduation<br />
Rate<br />
'11 Target:<br />
80%<br />
'12 Target:<br />
80%<br />
<strong>Campus</strong> District State <strong>Campus</strong> District State<br />
All <strong>Student</strong>s 2010-11 n/a 92.9 84.3 n/a 95.6 85.1<br />
American Indian/Alaskan<br />
Native<br />
2011-12 n/a 93.4 85.9 n/a 96.6 88.0<br />
2010-11<br />
n/a 90.0 84.2 n/a 92.9 83.8<br />
2011-12 n/a 100.0 86.6 n/a 100.0 88.1<br />
Asian 2010-11 n/a n/a n/a n/a n/a n/a<br />
Native Hawaiian/Pacific<br />
Islander<br />
2011-12 n/a 96.7 95.0 n/a n/a n/a<br />
2010-11<br />
n/a n/a n/a n/a n/a n/a<br />
2011-12 n/a 80.0 88.0 n/a n/a n/a<br />
African American 2010-11 n/a 87.4 78.8 n/a 92.3 78.8<br />
2011-12 n/a 87.2 80.9 n/a 93.9 82.9<br />
Hispanic 2010-11 n/a 81.3 78.8 n/a 88.3 80.0<br />
(Continued)<br />
2011-12 n/a 87.5 81.8 n/a 90.9 84.0<br />
* Asian, Pacific Islander and Two or More Races are not available for indicators that use the former race/ethnicity definitions. See the<br />
<strong>Texas</strong> <strong>NCLB</strong> Glossary for details.<br />
<strong>Student</strong> Achievement results are rounded to the nearest whole percent. Additional Academic Indicators (Graduation and Attendance<br />
Rate) are rounded to the nearest one-tenth of a percent (one decimal place).<br />
Special formats ('*', >99%,
<strong>Texas</strong> <strong>2012</strong> <strong>NCLB</strong> <strong>Report</strong> <strong>Card</strong> 29<br />
<strong>Part</strong> II a. - <strong>Campus</strong> <strong>Level</strong>: Comparison Between <strong>Student</strong> Achievement and the State Academic Expectations as<br />
Measured by Adequate Yearly Progress (AYP)*<br />
February 1, 2013<br />
For SCHELL EL (043910148) PLANO ISD<br />
<strong>Student</strong> Group Year<br />
Four-year<br />
Graduation<br />
Rate<br />
'11 Target:<br />
75%<br />
'12 Target:<br />
75%<br />
Four-year<br />
Graduation<br />
Rate<br />
'11 Target:<br />
75%<br />
'12 Target:<br />
75%<br />
Additional Academic Indicators<br />
Four-year<br />
Graduation<br />
Rate<br />
'11 Target:<br />
75%<br />
'12 Target:<br />
75%<br />
Five-year<br />
Graduation<br />
Rate<br />
'11 Target:<br />
80%<br />
'12 Target:<br />
80%<br />
Five-year<br />
Graduation<br />
Rate<br />
'11 Target:<br />
80%<br />
'12 Target:<br />
80%<br />
Portions of the <strong>NCLB</strong> <strong>Report</strong> <strong>Card</strong> (<strong>Part</strong> I, <strong>Part</strong> II, etc. or prior year information) may not appear when data are not reported.<br />
Five-year<br />
Graduation<br />
Rate<br />
'11 Target:<br />
80%<br />
'12 Target:<br />
80%<br />
<strong>Campus</strong> District State <strong>Campus</strong> District State<br />
White 2010-11 n/a 95.5 91.6 n/a 97.0 92.1<br />
2011-12 n/a 95.4 92.0 n/a 97.9 93.6<br />
Two or More Races 2010-11 n/a n/a n/a n/a n/a n/a<br />
2011-12 n/a 100.0 92.1 n/a n/a n/a<br />
Female 2010-11 n/a 95.1 86.5 n/a 96.7 86.8<br />
2011-12 n/a 95.0 88.2 n/a 97.7 89.5<br />
Male 2010-11 n/a 90.8 82.1 n/a 94.6 83.5<br />
2011-12 n/a 91.8 83.7 n/a 95.6 86.5<br />
Special Education 2010-11 n/a 81.5 74.4 n/a 87.8 78.1<br />
Limited English<br />
Proficient<br />
(Continued)<br />
2011-12 n/a 76.5 76.7 n/a 89.4 80.3<br />
2010-11<br />
n/a 76.4 62.8 n/a 82.8 67.5<br />
2011-12 n/a 77.4 66.8 n/a 87.4 72.0<br />
* Asian, Pacific Islander and Two or More Races are not available for indicators that use the former race/ethnicity definitions. See the<br />
<strong>Texas</strong> <strong>NCLB</strong> Glossary for details.<br />
<strong>Student</strong> Achievement results are rounded to the nearest whole percent. Additional Academic Indicators (Graduation and Attendance<br />
Rate) are rounded to the nearest one-tenth of a percent (one decimal place).<br />
Special formats ('*', >99%,
<strong>Texas</strong> <strong>2012</strong> <strong>NCLB</strong> <strong>Report</strong> <strong>Card</strong> 30<br />
<strong>Part</strong> II a. - <strong>Campus</strong> <strong>Level</strong>: Comparison Between <strong>Student</strong> Achievement and the State Academic Expectations as<br />
Measured by Adequate Yearly Progress (AYP)*<br />
February 1, 2013<br />
For SCHELL EL (043910148) PLANO ISD<br />
<strong>Student</strong> Group Year<br />
Economically<br />
Disadvantaged<br />
2010-11<br />
Four-year<br />
Graduation<br />
Rate<br />
'11 Target:<br />
75%<br />
'12 Target:<br />
75%<br />
Four-year<br />
Graduation<br />
Rate<br />
'11 Target:<br />
75%<br />
'12 Target:<br />
75%<br />
Additional Academic Indicators<br />
Four-year<br />
Graduation<br />
Rate<br />
'11 Target:<br />
75%<br />
'12 Target:<br />
75%<br />
Five-year<br />
Graduation<br />
Rate<br />
'11 Target:<br />
80%<br />
'12 Target:<br />
80%<br />
Five-year<br />
Graduation<br />
Rate<br />
'11 Target:<br />
80%<br />
'12 Target:<br />
80%<br />
Portions of the <strong>NCLB</strong> <strong>Report</strong> <strong>Card</strong> (<strong>Part</strong> I, <strong>Part</strong> II, etc. or prior year information) may not appear when data are not reported.<br />
Five-year<br />
Graduation<br />
Rate<br />
'11 Target:<br />
80%<br />
'12 Target:<br />
80%<br />
<strong>Campus</strong> District State <strong>Campus</strong> District State<br />
n/a 85.6 81.9 n/a 91.4 83.7<br />
2011-12 n/a 88.2 83.7 n/a 93.5 87.0<br />
Migrant 2010-11 n/a - 75.7 n/a - 76.4<br />
2011-12 n/a - 78.7 n/a - 82.4<br />
* Asian, Pacific Islander and Two or More Races are not available for indicators that use the former race/ethnicity definitions. See the<br />
<strong>Texas</strong> <strong>NCLB</strong> Glossary for details.<br />
<strong>Student</strong> Achievement results are rounded to the nearest whole percent. Additional Academic Indicators (Graduation and Attendance<br />
Rate) are rounded to the nearest one-tenth of a percent (one decimal place).<br />
Special formats ('*', >99%,
<strong>Texas</strong> <strong>2012</strong> <strong>NCLB</strong> <strong>Report</strong> <strong>Card</strong> 31<br />
<strong>Part</strong> II a. - <strong>Campus</strong> <strong>Level</strong>: Comparison Between <strong>Student</strong> Achievement and the State Academic Expectations as<br />
Measured by Adequate Yearly Progress (AYP)*<br />
February 1, 2013<br />
For SCHELL EL (043910148) PLANO ISD<br />
<strong>Student</strong> Group Year<br />
Additional Academic Indicators<br />
Attendance<br />
Rate<br />
Target:<br />
90%<br />
Attendance<br />
Rate<br />
Target:<br />
90%<br />
Attendance<br />
Rate<br />
Target:<br />
90%<br />
<strong>Campus</strong> District State<br />
All <strong>Student</strong>s 2010-11 97.5 n/a 95.5<br />
2011-12 97.8 n/a 95.7<br />
American Indian/Alaskan Native 2010-11 - n/a 95.0<br />
2011-12 - n/a 95.2<br />
Asian 2010-11 97.6 n/a 97.5<br />
2011-12 98.0 n/a 97.7<br />
Native Hawaiian/Pacific Islander 2010-11 - n/a 95.5<br />
2011-12 - n/a 95.9<br />
African American 2010-11 97.9 n/a 95.1<br />
2011-12 98.0 n/a 95.4<br />
Hispanic 2010-11 97.9 n/a 95.3<br />
2011-12 97.3 n/a 95.6<br />
White 2010-11 96.8 n/a 95.6<br />
2011-12 97.3 n/a 95.9<br />
Two or More Races 2010-11 98.2 n/a 95.7<br />
(Continued)<br />
2011-12 97.4 n/a 95.9<br />
Portions of the <strong>NCLB</strong> <strong>Report</strong> <strong>Card</strong> (<strong>Part</strong> I, <strong>Part</strong> II, etc. or prior year information) may not appear when data are not reported.<br />
* Asian, Pacific Islander and Two or More Races are not available for indicators that use the former race/ethnicity definitions. See the<br />
<strong>Texas</strong> <strong>NCLB</strong> Glossary for details.<br />
<strong>Student</strong> Achievement results are rounded to the nearest whole percent. Additional Academic Indicators (Graduation and Attendance<br />
Rate) are rounded to the nearest one-tenth of a percent (one decimal place).<br />
Special formats ('*', >99%,
<strong>Texas</strong> <strong>2012</strong> <strong>NCLB</strong> <strong>Report</strong> <strong>Card</strong> 32<br />
<strong>Part</strong> II a. - <strong>Campus</strong> <strong>Level</strong>: Comparison Between <strong>Student</strong> Achievement and the State Academic Expectations as<br />
Measured by Adequate Yearly Progress (AYP)*<br />
February 1, 2013<br />
For SCHELL EL (043910148) PLANO ISD<br />
<strong>Student</strong> Group Year<br />
Additional Academic Indicators<br />
Attendance<br />
Rate<br />
Target:<br />
90%<br />
Attendance<br />
Rate<br />
Target:<br />
90%<br />
Attendance<br />
Rate<br />
Target:<br />
90%<br />
<strong>Campus</strong> District State<br />
Female 2010-11 97.5 n/a 95.5<br />
2011-12 97.9 n/a 95.7<br />
Male 2010-11 97.5 n/a 95.5<br />
2011-12 97.6 n/a 95.7<br />
Special Education 2010-11 97.0 n/a 94.0<br />
2011-12 96.8 n/a 94.3<br />
Limited English Proficient 2010-11 97.5 n/a 96.3<br />
2011-12 97.7 n/a 96.6<br />
Economically Disadvantaged 2010-11 97.5 n/a 95.2<br />
2011-12 97.6 n/a 95.4<br />
Migrant 2010-11 - n/a 93.9<br />
2011-12 - n/a 93.9<br />
Portions of the <strong>NCLB</strong> <strong>Report</strong> <strong>Card</strong> (<strong>Part</strong> I, <strong>Part</strong> II, etc. or prior year information) may not appear when data are not reported.<br />
* Asian, Pacific Islander and Two or More Races are not available for indicators that use the former race/ethnicity definitions. See the<br />
<strong>Texas</strong> <strong>NCLB</strong> Glossary for details.<br />
<strong>Student</strong> Achievement results are rounded to the nearest whole percent. Additional Academic Indicators (Graduation and Attendance<br />
Rate) are rounded to the nearest one-tenth of a percent (one decimal place).<br />
Special formats ('*', >99%,
<strong>Texas</strong> <strong>2012</strong> <strong>NCLB</strong> <strong>Report</strong> <strong>Card</strong> 33<br />
<strong>Part</strong> III - <strong>Campus</strong> <strong>Level</strong>: Information on Adequate Yearly Progress (AYP) and School Improvement Program<br />
(SIP) for Districts and <strong>Campus</strong>es Receiving Title I, <strong>Part</strong> A funds<br />
February 1, 2013<br />
For SCHELL EL (043910148) PLANO ISD<br />
Year<br />
Met AYP<br />
SIP<br />
(for the<br />
subsequent<br />
school<br />
year)<br />
2010-11 Meets AYP n/a<br />
2011-12 Meets AYP n/a<br />
Portions of the <strong>NCLB</strong> <strong>Report</strong> <strong>Card</strong> (<strong>Part</strong> I, <strong>Part</strong> II, etc. or prior year information) may not appear when data are not reported.<br />
'n/a' indicates the district or school does not receive Title I, <strong>Part</strong> A funds.<br />
Questions regarding <strong>Part</strong> III of the <strong>NCLB</strong> <strong>Report</strong> <strong>Card</strong> should be directed to the Division of Performance <strong>Report</strong>ing. Contact us at<br />
(512) 463-9704 or performance.reporting@tea.state.tx.us.
<strong>Texas</strong> <strong>2012</strong> <strong>NCLB</strong> <strong>Report</strong> <strong>Card</strong> 34<br />
<strong>Part</strong> IV a. - <strong>Campus</strong> <strong>Level</strong>: Professional Qualifications of All Public Elementary and Secondary Teachers, As<br />
Defined by the State (Teacher Degree)<br />
February 1, 2013<br />
For SCHELL EL (043910148) PLANO ISD<br />
Year<br />
Bachelors Masters Doctorate<br />
2010-11 67.4 30.4 0.0<br />
2011-12 64.4 35.6 0.0<br />
Portions of the <strong>NCLB</strong> <strong>Report</strong> <strong>Card</strong> (<strong>Part</strong> I, <strong>Part</strong> II, etc. or prior year information) may not appear when data are not reported.<br />
Percent of Teachers are rounded to the nearest one-tenth of a percent (one decimal place).<br />
Percentages reported by Teacher Degree may not sum to 100% either due to rounding or because the category 'teachers with no degree'<br />
is not reported.<br />
A dash (-) indicates data are not reported; 'n/a' indicates that the data are not available or applicable.<br />
Questions regarding <strong>Part</strong> IV a. of the <strong>NCLB</strong> <strong>Report</strong> <strong>Card</strong> should be directed to the Division of Educator Standards & Certification,<br />
Fingerprinting. Contact us at (512) 936-9831 or espi@tea.state.tx.us.
<strong>Texas</strong> <strong>2012</strong> <strong>NCLB</strong> <strong>Report</strong> <strong>Card</strong> 35<br />
<strong>Part</strong> IV b. - <strong>Campus</strong> <strong>Level</strong>: Percent of Public Elementary and Secondary Teachers With Emergency/Provisional<br />
Credentials<br />
February 1, 2013<br />
For SCHELL EL (043910148) PLANO ISD<br />
Year<br />
%<br />
2010-11 0.00<br />
2011-12 0.00<br />
Portions of the <strong>NCLB</strong> <strong>Report</strong> <strong>Card</strong> (<strong>Part</strong> I, <strong>Part</strong> II, etc. or prior year information) may not appear when data are not reported.<br />
Percent of Teachers are rounded to the nearest one-hundredth of a percent (two decimal places).<br />
A dash (-) indicates data are not reported; 'n/a' indicates that the data are not available or applicable.<br />
Questions regarding <strong>Part</strong> IV b. of the <strong>NCLB</strong> <strong>Report</strong> <strong>Card</strong> should be directed to the Division of Educator Standards & Certification,<br />
Fingerprinting. Contact us at (512) 936-9831 or espi@tea.state.tx.us.
<strong>Texas</strong> <strong>2012</strong> <strong>NCLB</strong> <strong>Report</strong> <strong>Card</strong> 36<br />
<strong>Part</strong> IV c. - <strong>Campus</strong> <strong>Level</strong>: Percent of Classes Not Taught by Highly Qualified Teachers<br />
February 1, 2013<br />
For SCHELL EL (043910148) PLANO ISD<br />
Year<br />
%<br />
2010-11 0.00<br />
2011-12 0.00<br />
Portions of the <strong>NCLB</strong> <strong>Report</strong> <strong>Card</strong> (<strong>Part</strong> I, <strong>Part</strong> II, etc. or prior year information) may not appear when data are not reported.<br />
Percent of Classes are rounded to the nearest one-hundredth of a percent (two decimal places).<br />
A dash (-) indicates data are not reported; 'n/a' indicates that the data are not available or applicable.<br />
Questions regarding <strong>Part</strong> IV c. of the <strong>NCLB</strong> <strong>Report</strong> <strong>Card</strong> should be directed to the Division of Educator Standards & Certification,<br />
Fingerprinting. Contact us at (512) 936-9831 or espi@tea.state.tx.us.