ASSESSMENT OF RESIDUAL LIFE OF GIRDERS OF BRIDGE No
ASSESSMENT OF RESIDUAL LIFE OF GIRDERS OF BRIDGE No
ASSESSMENT OF RESIDUAL LIFE OF GIRDERS OF BRIDGE No

You also want an ePaper? Increase the reach of your titles
YUMPU automatically turns print PDFs into web optimized ePapers that Google loves.
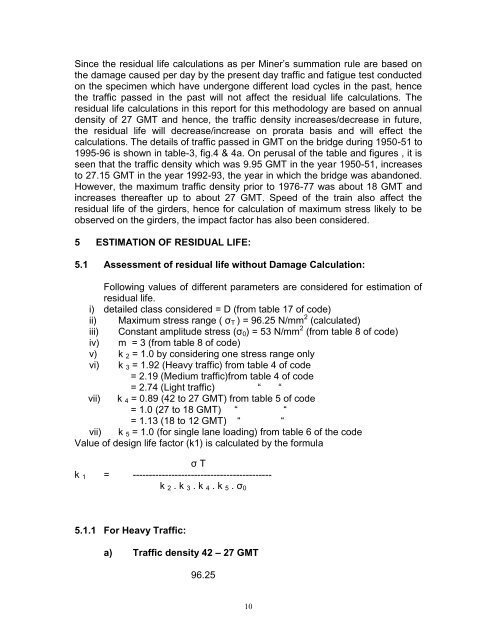
Since the residual life calculations as per Miner’s summation rule are based on<br />
the damage caused per day by the present day traffic and fatigue test conducted<br />
on the specimen which have undergone different load cycles in the past, hence<br />
the traffic passed in the past will not affect the residual life calculations. The<br />
residual life calculations in this report for this methodology are based on annual<br />
density of 27 GMT and hence, the traffic density increases/decrease in future,<br />
the residual life will decrease/increase on prorata basis and will effect the<br />
calculations. The details of traffic passed in GMT on the bridge during 1950-51 to<br />
1995-96 is shown in table-3, fig.4 & 4a. On perusal of the table and figures , it is<br />
seen that the traffic density which was 9.95 GMT in the year 1950-51, increases<br />
to 27.15 GMT in the year 1992-93, the year in which the bridge was abandoned.<br />
However, the maximum traffic density prior to 1976-77 was about 18 GMT and<br />
increases thereafter up to about 27 GMT. Speed of the train also affect the<br />
residual life of the girders, hence for calculation of maximum stress likely to be<br />
observed on the girders, the impact factor has also been considered.<br />
5 ESTIMATION <strong>OF</strong> <strong>RESIDUAL</strong> <strong>LIFE</strong>:<br />
5.1 Assessment of residual life without Damage Calculation:<br />
Following values of different parameters are considered for estimation of<br />
residual life.<br />
i) detailed class considered = D (from table 17 of code)<br />
ii) Maximum stress range ( σT ) = 96.25 N/mm 2 (calculated)<br />
iii) Constant amplitude stress (σ0) = 53 N/mm 2 (from table 8 of code)<br />
iv) m = 3 (from table 8 of code)<br />
v) k 2 = 1.0 by considering one stress range only<br />
vi) k 3 = 1.92 (Heavy traffic) from table 4 of code<br />
= 2.19 (Medium traffic)from table 4 of code<br />
= 2.74 (Light traffic) “ “<br />
vii) k 4 = 0.89 (42 to 27 GMT) from table 5 of code<br />
= 1.0 (27 to 18 GMT) “ “<br />
= 1.13 (18 to 12 GMT) “ “<br />
vii) k 5 = 1.0 (for single lane loading) from table 6 of the code<br />
Value of design life factor (k1) is calculated by the formula<br />
σ T<br />
k 1 = -------------------------------------------<br />
k 2 . k 3 . k 4 . k 5 . σ0<br />
5.1.1 For Heavy Traffic:<br />
a) Traffic density 42 – 27 GMT<br />
96.25<br />
10
![Hkkjrljdkj] jsy ea= ky; vuql a/ kkuvfHkdYivkSj ekudlax Bu y ... - rdso](https://img.yumpu.com/21978459/1/184x260/hkkjrljdkj-jsy-ea-ky-vuql-a-kkuvfhkdyivksj-ekudlax-bu-y-rdso.jpg?quality=85)