TCC News No. 30
TCC News No. 30
TCC News No. 30

You also want an ePaper? Increase the reach of your titles
YUMPU automatically turns print PDFs into web optimized ePapers that Google loves.
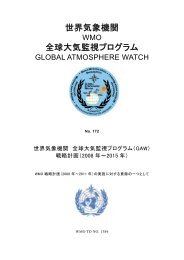
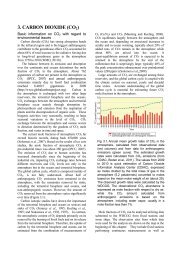
3. Sea surface temperatures around northern Japan<br />
Sea surface temperatures (SSTs) around northern Japan were significantly<br />
higher than normal (i.e., the 1981 – 2010 average) from late August to<br />
mid-September 2012 (Figure 31). The value of 10-day mean SSTs averaged<br />
for the area around Hokkaido (the white rectangle in Figure 31) for<br />
mid-September 2012 was 22.5˚C (preliminary), which was 4.6˚C above<br />
normal (Table 4) and exceeded the previous record of 21.4˚C set in late August<br />
2010 for all 10-day periods of the year since 1985. In the normal, SSTs<br />
in the area reach annual maximum levels in August and September. The<br />
values of area-averaged SSTs for the two consecutive 10-day periods of early<br />
and mid-September 2012 were the highest on record for the respective<br />
periods of the year since 1985 (Table 4; Figure 32).<br />
In the seas around Hokkaido, surface seawater was warmer than normal<br />
due to predominant sunny conditions (i.e., above-normal amounts of solar<br />
radiation) associated with the enhanced <strong>No</strong>rth Pacific High that caused record-breaking<br />
high temperatures in northern Japan. In addition, near-surface<br />
seawater was less mixed with cold seawater below it by surface winds, and<br />
ocean heat accumulated between the surface and just above 10 m in depth<br />
due to calm conditions associated with the enhanced Pacific High (Figure<br />
33). The record-high SSTs observed around Hokkaido can be attributed to<br />
these factors relating to the enhanced <strong>No</strong>rth Pacific High east of Japan.<br />
(1-2: Shotaro Tanaka, Climate Prediction Division,<br />
3: Satoshi Matsumoto: Office of Marine Prediction)<br />
References<br />
Enomoto, T., B. J. Hoskins, and Y. Matsuda, 2003: The formation mechanism of the<br />
Bonin high in August, Quart J. Roy. Meteor. Soc., 587, 157-178.<br />
Enomoto, T., 2004: Interannual variability of the Bonin high associated with the<br />
propagation of Rossby waves along the Asian jet. J. Meteor. Soc. Japan, 82,<br />
1019-1034.<br />
Hoskins, B., M. E. McIntyre, and A. W. Robertson, 1985: On the use and significance<br />
of isentropic potential vorticity maps, Quart J. Roy. Meteor. Soc., 111,<br />
877-946.<br />
Nitta, T., 1986: Long-term variations of cloud amount in the western Pacific region.<br />
J. Meteor. Soc. Japan, 64, 373-390.<br />
Nitta, T., 1987: Convective activities in the tropical western Pacific and their impact<br />
on the <strong>No</strong>rthern Hemisphere summer circulation. J. Meteor. Soc. Japan, 65,<br />
373-390.<br />
Takaya, K., and H. Nakamura, 2001: A formulation of a phase-independent<br />
wave-activity flux for stationary and migratory quasigeostrophic eddies on a zonally<br />
varying basic flow. J. Atom. Sci., 58, 608 – 627.<br />
Table 4 Record-high (preliminary) 10-day mean SSTs (unit: ˚C) averaged<br />
over the area around Hokkaido in northern Japan for early and mid-September<br />
The SST values for September 2012 are preliminary. Collection of statistical records<br />
began in 1985, since when SST statistics have been based on satellite observations in<br />
addition to ship observations. Anomalies are deviations from the 1981 – 2010 average.<br />
The area for the average is the white rectangle shown in Figure 31.<br />
Seas around<br />
Hokkaido<br />
Area-averaged<br />
SSTs<br />
Anomalies<br />
Previous record<br />
high<br />
1 – 10 September 21.8 +3.3 21.1 (2010)<br />
11 – 20 September 22.5 +4.6 20.1 (1999)<br />
Figure 32 Interannual variability of 10-day mean SSTs averaged<br />
over the area around Hokkaido (white rectangle shown<br />
in Figure 31) for late August (green line), early September<br />
(blue line) and mid-September (red line) from 1985 to 2012<br />
Figure 31 10-day mean SSTs (left) and anomalies<br />
(right) for late August (top), early September<br />
(middle) and mid-September 2012 (bottom)<br />
Anomalies are deviations from the 1981 – 2010<br />
average, and the unit for SSTs and anomalies is ˚C.<br />
The white rectangle indicates the target area around<br />
Hokkaido.<br />
Figure 33 Temperature profile for seawater<br />
between the surface and a depth of 50 m averaged<br />
over the area around Hokkaido (white rectangle<br />
shown in Figure 31) for mid-September of 2012<br />
(red line) and the 1985 – 2010 average (black line)<br />
Deviations from the 1985 – 2010 average were significant<br />
between the surface and just above 10 m in<br />
depth, and were small at 50 m in depth.<br />
<strong>TCC</strong> <strong>News</strong> 12 <strong>No</strong>. <strong>30</strong> | Autumn 2012