TCC News No. 30
TCC News No. 30
TCC News No. 30

You also want an ePaper? Increase the reach of your titles
YUMPU automatically turns print PDFs into web optimized ePapers that Google loves.
Mongolia and in northern Pakistan (Figure 11).<br />
It was reported that heavy rains caused more than 1<strong>30</strong> fatalities<br />
in Bangladesh and more than 120 fatalities in northern<br />
India’s Assam region in June. It was also reported that<br />
heavy rains caused at least 100 fatalities in the Philippines<br />
due to typhoons and enhanced convective activity associated<br />
with monsoon in August. It was further reported that heavy<br />
rains from late August to September caused more than 450<br />
fatalities in Pakistan.<br />
2. Tropical cyclones<br />
During the monsoon season, 16 tropical cyclones (TCs) of<br />
tropical storm (TS) intensity or higher formed over the western<br />
<strong>No</strong>rth Pacific (Table 1). The number of formations was<br />
the same as the 1981 – 2010 average of 16.0. A total of 8<br />
among these 16 passed around the East China Sea and approached<br />
or hit China, the Korean Peninsula or Japan, while<br />
five approached or hit southern China or Viet Nam via the<br />
South China Sea. Two TCs hit the main islands of Japan.<br />
Typhoon Saola caused more than 70 fatalities throughout<br />
China and the Philippines, and Typhoon Kai-tak caused more<br />
than 35 fatalities throughout the Philippines and Viet Nam.<br />
<strong>No</strong>te: Disaster information is based on reports by governmental<br />
organizations (Bangladesh, China, India, Pakistan,<br />
the Philippines and Viet Nam).<br />
3. Monsoon activity and atmospheric circulation<br />
Convective activity (inferred from outgoing longwave radiation<br />
(OLR)) averaged for June – September 2012 was<br />
enhanced over the western Indian Ocean, Pakistan, northern<br />
India, the Bay of Bengal, the South China Sea and the tropical<br />
western Pacific, and was suppressed over western/southern<br />
India and the eastern Indian Ocean (Figure 12).<br />
According to the OLR indices (Table 2), convective activity<br />
averaged over the Bay of Bengal and in the vicinity of the<br />
Philippines (both core areas of monsoon-related active convection)<br />
was enhanced in the summer monsoon season except<br />
in August, and in particular, enhanced convective activity<br />
from the South China Sea to the area east of the Philippines<br />
persisted throughout the season (Figure 13). The<br />
large-scale active convection area of the monsoon showed a<br />
tendency to be shifted north and east of its normal position.<br />
The areas of active convection that were originally enhanced<br />
around the equatorial western Indian Ocean in the middle of<br />
August moved northward around India and reached Pakistan<br />
in early September (Figure 14 (a)).<br />
Table 1 Tropical cyclones forming over the western<br />
<strong>No</strong>rth Pacific from June to September 2012<br />
Number<br />
ID<br />
<strong>TCC</strong> <strong>News</strong> 6 <strong>No</strong>. <strong>30</strong> | Autumn 2012<br />
Name<br />
Date<br />
(UTC)<br />
Category 1)<br />
Maximum<br />
wind 2)<br />
(knots)<br />
T1203 MAWAR 6/1 – 6/6 TY 75<br />
T1204 GUCHOL 6/13 – 6/19 TY 100<br />
T1205 TALIM 6/17 – 6/20 STS 50<br />
T1206 DOKSURI 6/26 – 6/29 TS 40<br />
T1207 KHANUN 7/16 – 7/18 STS 50<br />
T1208 VICENTE 7/21 – 7/24 TY 80<br />
T1209 SAOLA 7/28 – 8/3 TY 70<br />
T1210 DAMREY 7/28 – 8/3 TY 70<br />
T1211 HAIKUI 8/3 – 8/9 TY 65<br />
T1212 KIROGI 8/6 – 8/10 STS 50<br />
T1213 KAI-TAK 8/13 – 8/18 TY 65<br />
T1214 TEMBIN 8/19 – 8/<strong>30</strong> TY 80<br />
T1215 BOLAVEN 8/20 – 8/29 TY 100<br />
T1216 SANBA 9/11 – 9/17 TY 110<br />
T1217 JELAWAT 9/20 – 10/1 TY 110<br />
T1218 EWINIAR 9/24 – 9/29 STS 50<br />
<strong>No</strong>te: Based on information from the RSMC Tokyo-Typhoon<br />
Center.<br />
1) Intensity classification for tropical cyclones<br />
TS: Tropical storm, STS: Severe tropical storm, TY: Typhoon<br />
2) Estimated maximum 10-minute mean wind<br />
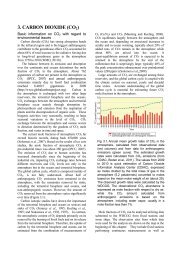
Figure 12 Four-month mean outgoing longwave radiation<br />
(OLR) and its anomaly for June – September 2012<br />
The contours indicate OLR at intervals of 10 W/m 2 , and the<br />
color shading denotes OLR anomalies from the normal (i.e., the<br />
1981 – 2010 average). Negative (cold color) and positive (warm<br />
color) OLR anomalies show enhanced and suppressed convection<br />
compared to the normal, respectively. Original data provided<br />
by NOAA.<br />
Table 2 Summer Asian Monsoon OLR Index (SAMOI) from May to October 2012<br />
Asian summer monsoon OLR indices (SAMOI) are derived from OLR anomalies from May to October. SAMOI (A), (N) and<br />
(W) indicate the overall activity of the Asian summer monsoon, its northward shift and its westward shift, respectively. SAMOI<br />
definitions are as follows: SAMOI (A) = (–1) × (W + E); SAMOI (N) = S – N; SAMOI (W) = E – W. W, E, N and S indicate<br />
area-averaged OLR anomalies for the respective regions shown in the figure on the right normalized by their standard deviations.<br />
Summer Asian Monsoon OLR Index (SAMOI)<br />
SAMOI (A):<br />
Activity<br />
SAMOI (N):<br />
<strong>No</strong>rthward-shift<br />
SAMOI (W):<br />
Westward-shift<br />
May 2012 0.7 -0.9 -0.8<br />
Jun. 2012 0.7 1.2 -1.5<br />
Jul. 2012 1.0 0.3 -1.4<br />
Aug. 2012 -0.1 1.5 -1.0<br />
Sep. 2012 1.6 0.2 0.2<br />
Oct. 2012 -0.7 -1.2 -1.2