- Page 1 and 2: NUECES COUNTY, TEXAS COMMISSIONERS
- Page 3 and 4: 2. PUBLIC COMMENT: This section pro
- Page 5 and 6: C. SHERIFF 1. Discuss and consider
- Page 7 and 8: Commissioners Court - Regular 1. D.
- Page 9 and 10: Nueces County Commissioners Court A
- Page 11 and 12: Table of Contents I. Introduction .
- Page 13 and 14: I. Introduction The 81 st Legislatu
- Page 15 and 16: Procedures for preserving, restorin
- Page 17: Figure 3: Mustang Island Packery Ch
- Page 21 and 22: width of approximately 200 feet. Fi
- Page 23 and 24: II.D.3. Exhibits 10 thru 12: Except
- Page 25 and 26: Figure 11: Bob Hall Pier Sea Level
- Page 27 and 28: photos have been used to delineate
- Page 29 and 30: III.D.2. Pre-existing Permits, Cert
- Page 31 and 32: IV.B.4. Periodic Beach Width Assess
- Page 33 and 34: V.E. Funding for Dune Mitigation Pr
- Page 35 and 36: Figure 13: Beach Access Road 2 on M
- Page 37 and 38: Figure 16: Beach Access Road 3, Mus
- Page 39 and 40: VI.C.5 Zahn Road Figure 18: Zahn Ro
- Page 41 and 42: Figure 21: Beach Access Road 3A, Se
- Page 43 and 44: Figure 24: Whitecap Boulevard, Seaw
- Page 45 and 46: the exaggerated speed hump and some
- Page 47 and 48: VI.C.12 Beach Access Road 6 Beach A
- Page 49 and 50: VI.D.1 Zahn Road Improvements Zahn
- Page 51 and 52: Currently there is a 7.3 mile dista
- Page 53 and 54: Appendix 1: Packery Channel Develop
- Page 55 and 56: Appendix 3: Beach Access Assessment
- Page 57 and 58: ORDINANCE DRAFT FOR TGLO REVIEW ERP
- Page 59 and 60: DRAFT FOR TGLO REVIEW ERP ordinance
- Page 61 and 62: "Sec. 10-116. Review and processing
- Page 63 and 64: DRAFT FOR TGLO REVIEW ERP ordinance
- Page 65 and 66: "Article XII. Requirements for Eros
- Page 67 and 68: DRAFT FOR TGLO REVIEW ERP ordinance
- Page 69 and 70:
DRAFT FOR TGLO REVIEW ERP ordinance
- Page 71 and 72:
"(2) The following construction req
- Page 73 and 74:
DRAFT FOR TGLO REVIEW ERP ordinance
- Page 75 and 76:
DRAFT FOR TGLO REVIEW ERP ordinance
- Page 77 and 78:
"(3) Mitigation. DRAFT FOR TGLO REV
- Page 79 and 80:
"4. The applicant has notified FEMA
- Page 81 and 82:
DRAFT FOR TGLO REVIEW ERP ordinance
- Page 83 and 84:
DRAFT FOR TGLO REVIEW ERP ordinance
- Page 85 and 86:
µ 0 -0.2 National Seashore Park 1
- Page 87 and 88:
µ -1.21 0 -1.28 National Seashore
- Page 89 and 90:
µ -3.48 -3.41 National Seashore Pa
- Page 91 and 92:
µ -2.13 -2.13 National Seashore Pa
- Page 93 and 94:
µ g -5.58 252 -5.61 National Seash
- Page 95 and 96:
µ -3.08 -3.22 g National Seashore
- Page 97 and 98:
µ -4 -4.2 National Seashore Park 1
- Page 99 and 100:
µ -0.3 -0.3 National Seashore Park
- Page 101 and 102:
µ -0.2 -0.23 National Seashore Par
- Page 103 and 104:
µ -0.16 -0.16 National Seashore Pa
- Page 105 and 106:
MEMORANDUM TO: Judge Loyd Neal, Nue
- Page 107 and 108:
I, Diana T. Barrera, County Clerk o
- Page 109 and 110:
E. Adopt the following Resolution(s
- Page 111 and 112:
G. AuthorizelExecute a contract wit
- Page 113 and 114:
Motion by: Judge Neal, Second by: C
- Page 115 and 116:
Motion by: Judge Neal, Second by: C
- Page 117 and 118:
Commissioners Court - Regular 1. F.
- Page 119 and 120:
Commissioners Court - Regular 1. F.
- Page 121 and 122:
Commissioners Court - Regular 1. G.
- Page 124 and 125:
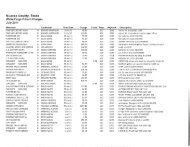
CONSOLIDATED CHECK RE Nueces County
- Page 127:
Commissioners Court - Regular 3. B.
- Page 131:
Nueces County Consolidated Check Re
- Page 138:
User ID: Rebecca Nueces CounU Conso
- Page 142 and 143:
Nueces Count! Consolidated Check Re
- Page 144:
User ID: Rebecca Report Name: AP_CC
- Page 147 and 148:
Nueces Count): Consolidated Check R
- Page 156 and 157:
Nueces County Consolidated Check Re
- Page 158 and 159:
User ID: Rebecca Nueces County Cons
- Page 161 and 162:
Nueces County Consolidated Check Re
- Page 166:
Nueces Countr Consolidated Check Re
- Page 169 and 170:
User ID; Rebecca Report Name: AP_CC
- Page 171:
User ID: Rebecca Nueces Count! Cons
- Page 179 and 180:
Nueces County Consolidated Check Re
- Page 181:
User ID: Rebecca Nueces County Cons
- Page 185 and 186:
User ID: Rebecca Nueces Count): Con
- Page 187 and 188:
Nueces County Consolidated Check Re
- Page 191 and 192:
N ueces County Consolidated Check R
- Page 197:
User ID: Rebecca Report Name: AP_CC
- Page 204:
N ueces County Consolidated Check R
- Page 210 and 211:
Nueces County Consolidated Check Re
- Page 214 and 215:
User ID: Rebecca N ueces County Con
- Page 216 and 217:
Nueces County Boon-Chapman Check Re
- Page 218 and 219:
Nueces County Boon-Chapman Check Re
- Page 220 and 221:
Nueces County Boon-Chapman Check Re
- Page 222 and 223:
Nueces County Boon-Chapman Check Re
- Page 224 and 225:
Nueces County Boon-Chapman Check Re
- Page 226 and 227:
Nueces County Boon-Chapman Check Re
- Page 228 and 229:
Nueces County, Texas Wells-Fargo P-
- Page 230 and 231:
Merchant Cardholder Tran Date Charg
- Page 232 and 233:
Merchant Cardholder Tran Date Charg
- Page 234 and 235:
Merchant Cardholder Tran Date Charg
- Page 236 and 237:
Merchant Cardholder Tran Date Charg
- Page 238 and 239:
Merchant Cardholder Tran Date Charg
- Page 240 and 241:
Merchant Cardholder Tran Date Charg
- Page 242 and 243:
Merchant Cardholder Tran Date Charg
- Page 244 and 245:
Merchant Cardholder Tran Date Charg
- Page 246 and 247:
Merchant Cardholder Tran Date Charg
- Page 248 and 249:
Merchant Cardholder Tran Date Charg
- Page 250:
Merchant Cardholder Tran Date Charg
- Page 253:
Special Motions Commissioners Court
- Page 260:
Nueces County Civil Service Rules U
- Page 299:
Commissioners Court - Regular 3. F.
- Page 302:
Commissioners Court - Regular 3. G.
- Page 314 and 315:
CONTRACT (NUECES COUNTY / COASTAL B
- Page 316 and 317:
CBAF terminates its activities rela
- Page 318 and 319:
Pier, the Port Aransas ferry and ot
- Page 320 and 321:
and, WHEREAS, the Commissioners Cou
- Page 322 and 323:
agreement. WITNESS our hands on thi
- Page 324 and 325:
private corporation such as the Cha
- Page 326 and 327:
ATTEST: BY:________________________
- Page 328 and 329:
and, WHEREAS, the Commissioners Cou
- Page 330 and 331:
y the Chamber of Commerce to conduc
- Page 332 and 333:
CONTRACT (NUECES COUNTY; DOWNTOWN M
- Page 334 and 335:
Christi and surrounding areas withi
- Page 336 and 337:
CONTRACT (NUECES COUNTY/HAMMONS EDU
- Page 338 and 339:
shall be returned to the County in
- Page 340 and 341:
III. HWNT, will raise awareness abo
- Page 342 and 343:
WHEREAS, the Commissioners Court is
- Page 344 and 345:
BY:________________________ BY:____
- Page 346 and 347:
WHEREAS, the Commissioners Court fi
- Page 348 and 349:
the County in the same proportion t
- Page 350 and 351:
I. STSARS will provide education, c
- Page 352 and 353:
CONTRACT (NUECES COUNTY/SPAULDING F
- Page 354 and 355:
V. SPAULDING will cause this fundin
- Page 356 and 357:
NOW, THEREFORE, for and in consider
- Page 358 and 359:
BY:________________________ Laura G
- Page 360 and 361:
MIKE PUSLEY County Commissioner Pre
- Page 362 and 363:
Commissioners Court - Regular 3. J.
- Page 364:
STATE OF TEXAS § § COUNTY OF NUEC
- Page 367:
Commissioners Court - Regular 4. A.
- Page 378 and 379:
STATE OF TEXAS COUNTY OF NUECES Pag
- Page 380 and 381:
work. Upon request by the County, t
- Page 382 and 383:
delivered to the County upon comple
- Page 384 and 385:
day notice period shall not exceed
- Page 386 and 387:
Page | 9 ARTICLE 24 SEVERABILITY In
- Page 388 and 389:
Page | 11 Attachment A Services to
- Page 390 and 391:
Phase 4: Page | 13 e. Design and de
- Page 392 and 393:
Commissioners Court - Regular 4. A.
- Page 394 and 395:
Commissioners Court - Regular 4. A.
- Page 396 and 397:
Commissioners Court - Regular 4. A.
- Page 398 and 399:
Commissioners Court - Regular 4. A.
- Page 400 and 401:
Commissioners Court - Regular 4. A.
- Page 402 and 403:
Commissioners Court - Regular 4. A.
- Page 404 and 405:
(Schedule 1) Investment Summary Sof
- Page 406 and 407:
the delivery and installation of th
- Page 408 and 409:
nonetheless is legally compelled to
- Page 410 and 411:
19.10. Relationship of Parties. The
- Page 412 and 413:
3. TYLER RESPONSIBILITIES - SUPPORT
- Page 414 and 415:
egistered mail, postage prepaid, re
- Page 416 and 417:
Tyler Proj Breakdown
- Page 418 and 419:
1. Services. Tyler shall perform th
- Page 420 and 421:
Commissioners Court - Regular 4. B.
- Page 422 and 423:
(c) Maintenance of Confidential Inf
- Page 424 and 425:
5/14/2012 Section 2.03 Mission Obje
- Page 426 and 427:
5/14/2012 (2) The document entitled
- Page 428 and 429:
5/14/2012 Director of Public Health
- Page 430 and 431:
5/14/2012 Section 2.13 Federal Fund
- Page 432 and 433:
5/14/2012 CONTRACTOR must comply wi
- Page 434 and 435:
5/14/2012 funds and (2) the percent
- Page 436 and 437:
5/14/2012 (b) HHSC is also responsi
- Page 438 and 439:
5/14/2012 CONTRACTOR must disclose
- Page 440 and 441:
5/14/2012 (b) If HHSC disputes paym
- Page 442 and 443:
5/14/2012 (C) The method of approva
- Page 444 and 445:
5/14/2012 Exhibit B CONTRACTOR’s
- Page 446 and 447:
5/14/2012 Exhibit D Uniform Grant M
- Page 448 and 449:
5/14/2012 Exhibit F Reporting Requi
- Page 450 and 451:
5/14/2012 Expectation: Documentati
- Page 452 and 453:
Form Number: CPP0434 INSTRUCTIONS P
- Page 454 and 455:
State of Texas Health & Human Servi
- Page 456 and 457:
Covered Contracts/Subcontract. CERT
- Page 458 and 459:
HHSC Contract No. _________________
- Page 460 and 461:
HHSC Contract No. _________________
- Page 462 and 463:
HHSC Contract No. _________________
- Page 464 and 465:
HHSC Contract No. _________________
- Page 466 and 467:
HHSC Contract No.: ________________
- Page 468 and 469:
HHSC Contract No.: ________________
- Page 470 and 471:
HHSC Contract No.: ________________
- Page 472 and 473:
HHSC Contract No.: ________________
- Page 474 and 475:
HHSC Contract No.: ________________
- Page 476 and 477:
HHSC Contract No.: ________________
- Page 478 and 479:
HHSC Contract No.: ________________
- Page 480 and 481:
HHSC Contract No.: ________________
- Page 482 and 483:
HHSC Contract No. : _______________
- Page 484 and 485:
HHSC Contract No. : _______________
- Page 486 and 487:
Form 74-176 (Back)(Rev.9-10/9) Inst
- Page 488 and 489:
Commissioners Court - Regular 4. C.
- Page 490 and 491:
Page | 2 cooperation and to create
- Page 492 and 493:
Page | 4 Supervisors. Staffing issu
- Page 494 and 495:
Page | 6 4. Each Participating Agen
- Page 496 and 497:
IX. RECORDS, REPORTS AND INFORMATIO
- Page 498 and 499:
Page | 10 C. For official inventory
- Page 500 and 501:
XXI. LIABILITY The Participating Ag
- Page 502 and 503:
Page | 14 employee detailed to the
- Page 504 and 505:
COST REIMBURSEMENT AGREEMENT BETWEE
- Page 506 and 507:
Commissioners Court - Regular 4. D.
- Page 508 and 509:
Date of Award May 14, 2012 Texas De
- Page 510 and 511:
Date of Award May 14, 2012 Texas De
- Page 512 and 513:
Date of Award May 14, 2012 Texas De
- Page 514 and 515:
Date of Award May 14, 2012 Texas De
- Page 516 and 517:
Date of Award May 14, 2012 Texas De
- Page 518 and 519:
Date of Award May 14, 2012 Texas De
- Page 520 and 521:
Date of Award May 14, 2012 Texas De
- Page 522 and 523:
Date of Award May 14, 2012 Texas De
- Page 524 and 525:
Date of Award May 14, 2012 Texas De
- Page 527 and 528:
Juvenile Justice Center Chiller Rep
- Page 529:
NUECES COUNTY CONSTRUCTION CONTRACT
- Page 532:
Change Order #3 5th Floor Newly Ope
- Page 536 and 537:
QUOTE# 00A1A CONTRACT PRICING WORKS
- Page 538 and 539:
901 LEOPARD, ROOM 206 NUECES COUNTY
- Page 540 and 541:
End User: NUECES COUNTY Philpott Re
- Page 542 and 543:
County Roads and Bridges Engineerin
- Page 544 and 545:
802 Cantwell Lane Corpus Christi, T
- Page 546 and 547:
Commissioners Court - Regular 4. F.
- Page 548 and 549:
Commissioners Court - Regular 4. F.
- Page 550 and 551:
Commissioners Court - Regular 4. G.
- Page 552:
Inland Parks Fund 0170 Inland Parks
- Page 556:
Nueces County Production Budget to
- Page 564:
Ledger: GL Fiscal Year: 2011 As Of:
- Page 568:
Nueces County Production Budget to
- Page 572:
.. Nueces County Production Budget
- Page 575:
Justice of the Peace, Pct. 3 P. O.
- Page 589:
3 4 5 6 8 9 FROZEN POSITIONS #018 a
- Page 593 and 594:
PERSONNEL CHANGE REPORT PAGE COMMIS
- Page 595 and 596:
Personnel Changes Summary For May N
- Page 597 and 598:
PERSONNEL CHANGE REPORT PAGE 2 COMM
- Page 599 and 600:
PERSONNEL CHANGE REPORT PAGE 4 COMM
- Page 601 and 602:
Z:IJobdescriptiol1$\Public Health L
- Page 603 and 604:
Z:\Jobdescriptions\Public Health La
- Page 605 and 606:
NUECES COUNTY EMPLOYEE HEALTH BENEF
- Page 607 and 608:
OUT-OF-AREA PLAN - SCHEDULE OF BENE
- Page 609 and 610:
The Plan will pay eligible expenses
- Page 611 and 612:
The Plan will pay eligible expenses
- Page 613 and 614:
NUECES COUNTY RURAL RAIL TRANSPORTA
- Page 615:
• COUNTY OF NUECES APPLICATION FO
- Page 619:
COUNTY OF NUECES APPLICATION FOR AP
- Page 622 and 623:
Cristopher B. Gwinn Corpus Christi,
- Page 625:
Robert Flournoy Harrold RESUME Pres