MANAGEMENT DISCUSSION AND ANALYSIS - Alibaba
MANAGEMENT DISCUSSION AND ANALYSIS - Alibaba
MANAGEMENT DISCUSSION AND ANALYSIS - Alibaba

You also want an ePaper? Increase the reach of your titles
YUMPU automatically turns print PDFs into web optimized ePapers that Google loves.
BUSINESS OVERVIEW<br />
Since early 2011, we have reiterated our focus on our long-term<br />
strategies of 1) building a trustworthy e-commerce platform<br />
by enhancing user quality and user experience, as well as<br />
strengthening the depth and the breadth of user information<br />
captured on our platforms; and 2) evolving our business model<br />
by developing performance-based and transaction-based services.<br />
Although we are faced with a complex economic environment,<br />
we remain focused on the execution of our strategies to build<br />
a scalable and sustainable business model, driving long-term<br />
growth by increasing online activities between buyers and sellers.<br />
We have made significant progress in enhancing user quality<br />
in 2011. During the year, we stepped up our efforts to combat<br />
fraud, strengthen the authenticity of user information and<br />
improve trust and safety measures. Although our efforts resulted<br />
in a decrease in paying members, as expected, we saw material<br />
improvement in increased traffic and reduced disputes on<br />
both our international and China marketplaces. In 2011, we<br />
added 14.5 million registered users and more than 1.4 million<br />
storefronts in these two marketplaces. As of December 31, 2011,<br />
we had a total of 76.3 million registered users, 10.0 million<br />
storefronts and 765,363 paying members in both marketplaces.<br />
In addition, we mobilized more resources to develop<br />
performance-based and transaction-based services in order to<br />
expedite our business model upgrade. We also streamlined our<br />
International marketplace operational data<br />
<strong>Alibaba</strong>.com Limited Annual Report 2011<br />
service offering and made our value proposition clearer to our<br />
users. Although new business lines associated with these initiatives<br />
are still in early stage and require continued investment, we are<br />
pleased with their growth momentum.<br />
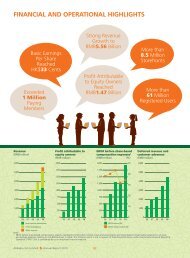
In 2011, we saw solid revenue growth despite a decline in<br />
membership base. Our total GAAP revenue grew by 15.5%<br />
year-over-year to RMB6.4 billion. Profit attributable to equity owners<br />
grew 16.1% year-over-year to RMB1.7 billion. We strongly believe<br />
that attracting higher-quality traffic will drive usage of performancedriven<br />
value-added services (VAS) and online transactions, resulting<br />
in a more balanced revenue mix in the long run.<br />
International marketplace<br />
In 2011, the number of registered users on our international<br />
marketplace increased by 41.6% year-over-year, reaching 25.5<br />
million as of December 31, 2011. The number of storefronts grew<br />
by 31.7% to 2.2 million. It is encouraging to see that our strategy<br />
to improve the quality of suppliers on our platforms is paying<br />
off. For example, the number of complaints lodged against our<br />
paying members in December was down by about 70% yearover-year<br />
compared with December 2010. The increased user<br />
base contributed to increasing user traffic and buyer activities. In<br />
December, our overseas daily average traffic in terms of unique<br />
visitors saw a year-on-year growth of 58%.<br />
As of December 31<br />
2007 2008 2009 2010 2011<br />
Registered users 4,405,557 7,914,630 11,578,247 18,024,993 25,517,089<br />
Storefronts 697,563 965,747 1,400,326 1,696,905 2,235,416<br />
Paying members (1) 39,536 59,164 113,896 131,708 106,563<br />
China Gold Supplier 27,384 43,028 96,110 121,274 99,005<br />
Global Gold Supplier 12,152 16,136 17,786 10,434 7,558<br />
(1) Includes paying members with active storefront listings, as well as paying members who have paid membership package subscription fees but whose storefronts have not been<br />
activated.<br />
International marketplace – Geographical distribution of registered users (other than China) as of December 31, 2011<br />
Country or region Number of registered % of total registered users<br />
users in country or region on our international marketplace<br />
1. United States 4,251,910 16.7%<br />
2. European Union (1) 2,773,748 10.9%<br />
3. India 2,573,350 10.1%<br />
4. United Kingdom 1,306,708 5.1%<br />
5. Australia 754,526 3.0%<br />
(1) Excludes the United Kingdom<br />
17