MANAGEMENT DISCUSSION AND ANALYSIS - Alibaba
MANAGEMENT DISCUSSION AND ANALYSIS - Alibaba
MANAGEMENT DISCUSSION AND ANALYSIS - Alibaba

Create successful ePaper yourself
Turn your PDF publications into a flip-book with our unique Google optimized e-Paper software.
Revenue from our China marketplace was RMB2,217.4 million in<br />
2011, representing a 17.1% increase from RMB1,893.9 million<br />
in 2010. The growth was largely attributable to the increase in<br />
revenue from Ali-ADvance and Premium Placement. The total<br />
number of paying members declined to 658,800 as of December<br />
31, 2011, compared to 677,654 as of December 31, 2010.<br />
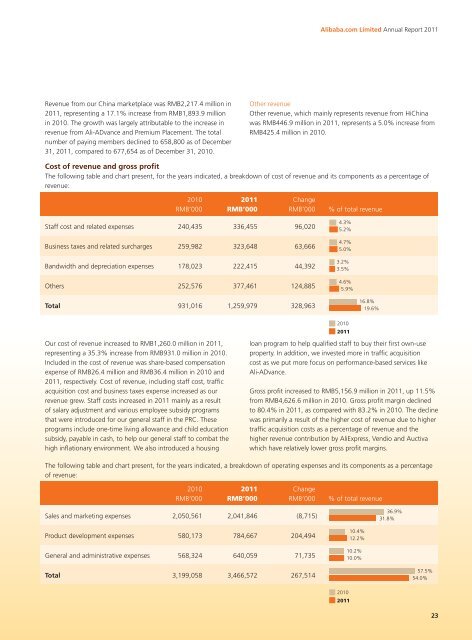
Cost of revenue and gross profit<br />
The following table and chart present, for the years indicated, a breakdown of cost of revenue and its components as a percentage of<br />
revenue:<br />
Our cost of revenue increased to RMB1,260.0 million in 2011,<br />
representing a 35.3% increase from RMB931.0 million in 2010.<br />
Included in the cost of revenue was share-based compensation<br />
expense of RMB26.4 million and RMB36.4 million in 2010 and<br />
2011, respectively. Cost of revenue, including staff cost, traffic<br />
acquisition cost and business taxes expense increased as our<br />
revenue grew. Staff costs increased in 2011 mainly as a result<br />
of salary adjustment and various employee subsidy programs<br />
that were introduced for our general staff in the PRC. These<br />
programs include one-time living allowance and child education<br />
subsidy, payable in cash, to help our general staff to combat the<br />
high inflationary environment. We also introduced a housing<br />
<strong>Alibaba</strong>.com Limited Annual Report 2011<br />
2010 2011 Change<br />
RMB’000 RMB’000 RMB’000 % of total revenue<br />
Staff cost and related expenses 240,435 336,455 96,020<br />
Business taxes and related surcharges 259,982 323,648 63,666<br />
Bandwidth and depreciation expenses 178,023 222,415 44,392<br />
Others 252,576 377,461 124,885<br />
Total 931,016 1,259,979 328,963<br />
4.3%<br />
5.2%<br />
4.7%<br />
5.0%<br />
3.2%<br />
3.5%<br />
4.6%<br />
5.9%<br />
2010<br />
2011<br />
16.8%<br />
19.6%<br />
loan program to help qualified staff to buy their first own-use<br />
property. In addition, we invested more in traffic acquisition<br />
cost as we put more focus on performance-based services like<br />
Ali-ADvance.<br />
Gross profit increased to RMB5,156.9 million in 2011, up 11.5%<br />
from RMB4,626.6 million in 2010. Gross profit margin declined<br />
to 80.4% in 2011, as compared with 83.2% in 2010. The decline<br />
was primarily a result of the higher cost of revenue due to higher<br />
traffic acquisition costs as a percentage of revenue and the<br />
higher revenue contribution by AliExpress, Vendio and Auctiva<br />
which have relatively lower gross profit margins.<br />
2010 2011 Change<br />
RMB’000 RMB’000 RMB’000 % of total revenue<br />
Sales and marketing expenses 2,050,561 2,041,846 (8,715)<br />
Product development expenses 580,173 784,667 204,494<br />
General and administrative expenses 568,324 640,059 71,735<br />
Total 3,199,058 3,466,572 267,514<br />
Other revenue<br />
Other revenue, which mainly represents revenue from HiChina<br />
was RMB446.9 million in 2011, represents a 5.0% increase from<br />
RMB425.4 million in 2010.<br />
The following table and chart present, for the years indicated, a breakdown of operating expenses and its components as a percentage<br />
of revenue:<br />
2010<br />
2011<br />
10.4%<br />
12.2%<br />
10.2%<br />
10.0%<br />
36.9%<br />
31.8%<br />
57.5%<br />
54.0%<br />
23