MANAGEMENT DISCUSSION AND ANALYSIS - Alibaba
MANAGEMENT DISCUSSION AND ANALYSIS - Alibaba
MANAGEMENT DISCUSSION AND ANALYSIS - Alibaba

You also want an ePaper? Increase the reach of your titles
YUMPU automatically turns print PDFs into web optimized ePapers that Google loves.
<strong>Alibaba</strong>.com Limited Annual Report 2011<br />
<strong>MANAGEMENT</strong> <strong>DISCUSSION</strong><br />
<strong>AND</strong> <strong>ANALYSIS</strong><br />
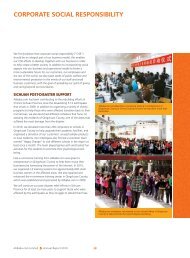
BUSINESS ENVIRONMENT<br />
The global economy was sluggish in 2011 due to lackluster<br />
economic conditions in the major developed markets. Downside<br />
risks have been increasing as the Euro zone crisis unfolds without<br />
solution and the U.S. recovery falters. Cautious sentiment is<br />
restraining consumption in developed economies, which is<br />
negatively impacting emerging economies and developing<br />
nations. China is unlikely to prove immune to the global<br />
slowdown. China’s economic performance was hurt by a greaterthan-expected<br />
dampening of export growth, which declined<br />
from 31% in 2010 to 20% in 2011. In addition to falling global<br />
demand, small businesses struggled with surging production<br />
costs, high labor costs and a stronger Chinese currency. A<br />
credit squeeze caused by China’s tightened monetary policy<br />
also added pressures to small businesses. Nevertheless, many<br />
16<br />
WE ARE CONFIDENT THAT THE<br />
SHIFT AWAY FROM AGGRESSIVE<br />
MEMBERSHIP ACQUISITION TO FOCUS<br />
ON STRENGTHENING BUYER’S TRUST<br />
ON ALIBABA.COM WILL BENEFIT OUR<br />
CUSTOMERS <strong>AND</strong> OUR LONG-TERM<br />
BUSINESS GROWTH.<br />
small businesses have remained competitive by tapping China’s<br />
fast-growing domestic market and other regions through<br />
geographical expansion, thus diversifying their customer base.<br />
More businesses also appear to be leveraging e-commerce to<br />
become more flexible, efficient and competitive.<br />
Another phenomenon that we have observed is the increasing<br />
demand by small businesses for online sales and marketing<br />
services. Small businesses usually prefer variable, performancebased<br />
services as they aim to maximize their return on investment<br />
for the marketing dollars they spent. This trend supports our view<br />
that e-commerce is becoming indispensable for small businesses.<br />
Going forward, we will continue to serve our customers by<br />
developing additional performance-driven and online transactionbased<br />
services.
BUSINESS OVERVIEW<br />
Since early 2011, we have reiterated our focus on our long-term<br />
strategies of 1) building a trustworthy e-commerce platform<br />
by enhancing user quality and user experience, as well as<br />
strengthening the depth and the breadth of user information<br />
captured on our platforms; and 2) evolving our business model<br />
by developing performance-based and transaction-based services.<br />
Although we are faced with a complex economic environment,<br />
we remain focused on the execution of our strategies to build<br />
a scalable and sustainable business model, driving long-term<br />
growth by increasing online activities between buyers and sellers.<br />
We have made significant progress in enhancing user quality<br />
in 2011. During the year, we stepped up our efforts to combat<br />
fraud, strengthen the authenticity of user information and<br />
improve trust and safety measures. Although our efforts resulted<br />
in a decrease in paying members, as expected, we saw material<br />
improvement in increased traffic and reduced disputes on<br />
both our international and China marketplaces. In 2011, we<br />
added 14.5 million registered users and more than 1.4 million<br />
storefronts in these two marketplaces. As of December 31, 2011,<br />
we had a total of 76.3 million registered users, 10.0 million<br />
storefronts and 765,363 paying members in both marketplaces.<br />
In addition, we mobilized more resources to develop<br />
performance-based and transaction-based services in order to<br />
expedite our business model upgrade. We also streamlined our<br />
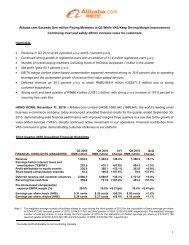
International marketplace operational data<br />
<strong>Alibaba</strong>.com Limited Annual Report 2011<br />
service offering and made our value proposition clearer to our<br />
users. Although new business lines associated with these initiatives<br />
are still in early stage and require continued investment, we are<br />
pleased with their growth momentum.<br />
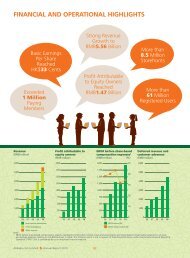
In 2011, we saw solid revenue growth despite a decline in<br />
membership base. Our total GAAP revenue grew by 15.5%<br />
year-over-year to RMB6.4 billion. Profit attributable to equity owners<br />
grew 16.1% year-over-year to RMB1.7 billion. We strongly believe<br />
that attracting higher-quality traffic will drive usage of performancedriven<br />
value-added services (VAS) and online transactions, resulting<br />
in a more balanced revenue mix in the long run.<br />
International marketplace<br />
In 2011, the number of registered users on our international<br />
marketplace increased by 41.6% year-over-year, reaching 25.5<br />
million as of December 31, 2011. The number of storefronts grew<br />
by 31.7% to 2.2 million. It is encouraging to see that our strategy<br />
to improve the quality of suppliers on our platforms is paying<br />
off. For example, the number of complaints lodged against our<br />
paying members in December was down by about 70% yearover-year<br />
compared with December 2010. The increased user<br />
base contributed to increasing user traffic and buyer activities. In<br />
December, our overseas daily average traffic in terms of unique<br />
visitors saw a year-on-year growth of 58%.<br />
As of December 31<br />
2007 2008 2009 2010 2011<br />
Registered users 4,405,557 7,914,630 11,578,247 18,024,993 25,517,089<br />
Storefronts 697,563 965,747 1,400,326 1,696,905 2,235,416<br />
Paying members (1) 39,536 59,164 113,896 131,708 106,563<br />
China Gold Supplier 27,384 43,028 96,110 121,274 99,005<br />
Global Gold Supplier 12,152 16,136 17,786 10,434 7,558<br />
(1) Includes paying members with active storefront listings, as well as paying members who have paid membership package subscription fees but whose storefronts have not been<br />
activated.<br />
International marketplace – Geographical distribution of registered users (other than China) as of December 31, 2011<br />
Country or region Number of registered % of total registered users<br />
users in country or region on our international marketplace<br />
1. United States 4,251,910 16.7%<br />
2. European Union (1) 2,773,748 10.9%<br />
3. India 2,573,350 10.1%<br />
4. United Kingdom 1,306,708 5.1%<br />
5. Australia 754,526 3.0%<br />
(1) Excludes the United Kingdom<br />
17
<strong>Alibaba</strong>.com Limited Annual Report 2011<br />
<strong>MANAGEMENT</strong> <strong>DISCUSSION</strong><br />
<strong>AND</strong> <strong>ANALYSIS</strong><br />
Gold Supplier<br />
In 2011, we intentionally slowed down the pace of membership<br />
acquisition while we boosted the quality of suppliers. As of<br />
December 31, 2011, we had 99,005 China Gold Supplier<br />
members, representing an 18.4% reduction in the membership<br />
base from 2010. In the fourth quarter, we continued to see<br />
a sequential decline in China Gold Supplier membership.<br />
This decline was expected as our strategy shifted away from<br />
aggressive customer acquisition. It was also partially due to<br />
our ongoing tight quality control of suppliers and the higher<br />
membership fee of RMB29,800 which applied to all renewing<br />
members beginning in the fourth quarter of 2011. The renewal<br />
rate in the fourth quarter was slightly lower compared with<br />
previous quarters.<br />
As of December 31, 2011, we had 7,558 Global Gold Supplier<br />
members. During the year, we continued to stay focused on a<br />
few countries including India, Japan, South Korea and Turkey.<br />
In addition, we reviewed our overall strategy and operation for<br />
overseas markets as well as the business model so as to prepare<br />
ourselves to further tap the extensive supplier base outside the<br />
Greater China region in a more cost-effective manner going<br />
forward.<br />
From supplier’s perspective, we initiated rigorous measures<br />
to enhance the level of trust and safety of the Gold Supplier<br />
program. In early 2011, we set up a special task force to examine<br />
the nature of buyers’ complaints and our internal quality systems<br />
to address the systemic nature of fraud issues that were reported<br />
in February 2011. The following steps were taken, among others:<br />
1) prevented risk-prone suppliers from joining; 2) strengthened<br />
predictive methodologies through data monitoring to detect and<br />
track high-risk accounts; 3) strengthened enforcement of takedown<br />
policies; 4) revamped our internal sales-incentive scheme<br />
and the structure of our sales force. In October 2011, we started<br />
to roll out the “Onsite Check” program. This physical verification<br />
process conducted by <strong>Alibaba</strong>.com personnel represents a<br />
second level of verification that members are in valid existence in<br />
addition to the basic third-party authentication and verification<br />
that occurs when a supplier joins <strong>Alibaba</strong>.com or renews as a<br />
paying member. This program has received a positive response<br />
from our suppliers; some paying members requested onsite<br />
inspections before their memberships were due for renewal to<br />
highlight their credibility, as the “Onsite Check” logo is clearly<br />
shown on product search results and storefronts of verified<br />
suppliers. Similarly, a paid service for in-depth verification, Factory<br />
Audit, also gained traction.<br />
18<br />
From buyer’s perspective, since the second quarter of 2011, we<br />
have been collecting more user feedback, helping us to better<br />
monitor customer satisfaction and enhance user experience. To<br />
provide more protection for overseas buyers, we beta-launched<br />
a platform-wide escrow service and introduced an online service<br />
allowing buyers to hire third-party inspectors to ensure orders<br />
are filled correctly before being shipped from China. To facilitate<br />
online sourcing, we added a multi-lingual system to present<br />
product information in several languages, and added multiplelocation<br />
search that allows buyers to more easily find products<br />
and suppliers in targeted locations around the world. All in all,<br />
these features helped to attract more buyers and overseas traffic<br />
to our international marketplace as indicated by its buoyant<br />
growth in registered users and overseas unique visitors.<br />
Our ongoing development of VAS remained on track in 2011. We<br />
continued to see growth in VAS revenue contribution and VAS<br />
penetration. VAS revenue contributed around 30% of China Gold<br />
Supplier revenue in 2011. Among our VAS offerings, marketingrelated<br />
VAS, including keyword and Product Showcase, were still<br />
the major drivers of VAS revenue. While retaining our fixed-fee<br />
keyword model, in the first quarter of 2011 we introduced Ali-<br />
ADvance, which is a “pay-for-performance” model for keyword<br />
search. During the year, the adoption and usage of Ali-ADvance<br />
gained steadily.<br />
Going forward, we remain focused on strengthening trust<br />
and safety, growing overseas traffic and enhancing the user<br />
experience.<br />
AliExpress<br />
Overall, the growth momentum of AliExpress remained strong<br />
in 2011. We achieved significant progress in AliExpress on all<br />
fronts including supplier base, buyer traffic, user experience<br />
and transaction volume. According to Alexa.com, as of the end<br />
of December, AliExpress continued to rank highest among all<br />
international business online transaction platforms. Although<br />
there was a temporary impact on gross merchandise value (GMV)<br />
growth in the third quarter due to the August termination of<br />
Paypal as a payment option on AliExpress, the impact was much<br />
smaller than expected and the friction was removed in the fourth<br />
quarter.
During the year, we spent most of our effort on fundamentals:<br />
ensuring supplier and product quality, strengthening transaction<br />
security, improving logistics and enhancing online payment<br />
convenience. We launched a fulfillment service to reduce the<br />
cost of international shipment. We also strengthened the trust<br />
and safety level of AliExpress by tightening control of counterfeit<br />
products and enhanced buyer protection by providing payment<br />
protection and a refund program. In addition, we continued to<br />
streamline the online payment process. These efforts started to<br />
bear fruit as the number of disputes over product quality and<br />
supplier quality trended down while the payment success rate<br />
was satisfactory in 2011.<br />
In the third quarter, we launched the Assurance Plus program,<br />
not only making the buying experience on AliExpress safe and<br />
easy but also raising our sellers’ trustworthiness. Assurance Plus<br />
status is available only to qualified suppliers who are able to<br />
meet our requirements for rapid order dispatch, accurate product<br />
descriptions and free return shipping in cases where buyers are<br />
dissatisfied with product quality. The “Assurance Plus” logo is<br />
clearly shown on storefronts of qualified suppliers.<br />
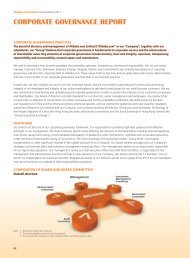
China marketplace operational data<br />
<strong>Alibaba</strong>.com Limited Annual Report 2011<br />
In 2012, we will focus on attracting more quality suppliers,<br />
expanding the range of products, streamlining the online<br />
payment process and optimizing logistics. For suppliers, we look<br />
to shorten the payment collection period in order to reduce their<br />
working capital requirements and to encourage the completion<br />
of more transactions entirely online.<br />
China marketplace<br />
Anticipating that China’s export markets would become<br />
increasingly challenging and volatile over time, in recent<br />
years, we have allocated more resources to grow our China<br />
marketplace. Today our 1688.com platform offers compelling<br />
advantages to suppliers and buyers who focus on China’s<br />
domestic trade, and it is poised to play a major role in China’s<br />
growing domestic market.<br />
Our China marketplace maintained steady growth in 2011. As<br />
of December 31, 2011, we had 50.8 million registered users<br />
and 7.8 million storefronts, representing growth of 16.1% and<br />
13.7%, respectively from the previous year. Our small businesses<br />
customer base is by far the largest in China, providing a strong<br />
foundation for long-term growth as well as a wellspring of<br />
market information and buying behavior that we believe are<br />
important resources for further development.<br />
As of December 31<br />
2007 2008 2009 2010 2011<br />
Registered users 23,194,402 30,160,705 36,154,669 43,776,288 50,815,074<br />
Storefronts 2,259,283 3,648,503 5,419,658 6,847,639 7,788,416<br />
Paying members (1) 266,009 372,867 501,316 677,654 658,800<br />
(1) Includes paying members with active storefront listings, as well as paying members who have paid membership package subscription fees but whose storefronts have not been<br />
activated.<br />
China TrustPass<br />
By the end of 2011, we had 658,800 China TrustPass members.<br />
The number of members declined from the end of 2010 and<br />
also sequentially from the third quarter of 2011. The reduction in<br />
members was mainly due to the slower membership acquisition<br />
following our decision not to sell the China TrustPass individual<br />
edition in the second quarter of 2011. The renewal rate has been<br />
steady.<br />
In 2011, most of the improvements we made to the China<br />
marketplace were fundamental yet crucial. We focused on<br />
areas such as enhancing user quality and authenticity; growing<br />
buyer traffic; and improving user experience. To enhance user<br />
authenticity on 1688.com and create a more extensive user<br />
database, we required all China marketplace users to register<br />
in their real names since September 2011. We are also building<br />
a dynamic rating and feedback system not only to develop a<br />
“trust profile” for users but also to facilitate more online activities<br />
between buyers and sellers as the trust issue can be addressed<br />
through this proven mechanism. In December 2011, we kickstarted<br />
a third-party onsite check program. We designed this<br />
additional check as a new VAS for Chinese domestic suppliers<br />
to further enhance their authenticity on 1688.com. Although<br />
it is voluntary, we believe onsite check program will attract<br />
reasonable user interest as the business environment becomes<br />
more competitive and individual suppliers seek ways to highlight<br />
their credibility and quality.<br />
19
<strong>Alibaba</strong>.com Limited Annual Report 2011<br />
<strong>MANAGEMENT</strong> <strong>DISCUSSION</strong><br />
<strong>AND</strong> <strong>ANALYSIS</strong><br />
On the VAS front, growth was gradual and modest over 2011.<br />
VAS revenue contributed around 25% of our China TrustPass<br />
revenue in 2011. Marketing-related VAS such as Ali-ADvance and<br />
Premium Placement continued to be the main sources of our VAS<br />
revenue.<br />
1688.com<br />
To enhance user experience, we overhauled the website structure<br />
and layout of 1688.com and added more transaction features<br />
in order to make it more buyer-oriented and user-friendly. For<br />
some sectors like apparel, home decorations and small consumer<br />
items, we provided exclusive channels with transaction features.<br />
In the third quarter, we added features targeted at bringing<br />
large wholesale transactions online. This helped to reinforce<br />
1688.com’s positioning as an online wholesale platform for<br />
Chinese domestic suppliers and buyers. The GMV of online<br />
transactions on 1688.com gathered pace throughout 2011.<br />
We will continue to enhance user experience by improving<br />
website navigation, design and search mechanisms as well as<br />
customizing the process of placing orders and paying online. In<br />
2012, we will gradually introduce more third-party applications<br />
and services to further address our users’ needs and increase<br />
stickiness of our platform.<br />
Liang Wu Xian<br />
In January 2011, we embarked on a new initiative, Wu Ming<br />
Liang Pin which was initially designed as a B2C transaction<br />
platform. Since the launch, we reviewed and modified the<br />
business model and its value proposition. In August, we renamed<br />
the service as Liang Wu Xian, and repositioned it as a supply<br />
chain service for Chinese manufacturers that involves four key<br />
areas including 1) quality control of manufacturers and products,<br />
2) product quality certification, 3) logistics and inventory<br />
management and 4) distribution channels management. Along<br />
this supply chain, we partner with independent experts and<br />
operators in different areas to leverage their skills and knowledge<br />
and aim to create the greatest supply chain efficiency.<br />
The value proposition of Liang Wu Xian has advanced beyond<br />
that of a pure transaction platform. Instead, this is an Internetenabled<br />
supply chain service. With our strong capability in<br />
e-commerce and understanding of the needs of small businesses<br />
we are able to operate the supply chain service in efficient<br />
and cost-saving ways. In 2012, we will focus on developing<br />
and investing in the aforementioned four areas rather than<br />
on monetization. We started trial monetization in 2011 and<br />
will explore the monetization model that best fits our service.<br />
As more well-established manufacturers turn to the domestic<br />
consumer market, they will need assistance in managing regional<br />
supply chains. We believe Liang Wu Xian is uniquely positioned to<br />
meet the rising demand for supply chain services.<br />
20<br />
HiChina<br />
In 2011, HiChina’s membership and revenue steadily grew<br />
year-on-year. HiChina’s core businesses such as domain-name<br />
services remained strong in 2011. New cloud-related services<br />
such as cloud hosting and cloud email also progressed well. The<br />
revenue contributions from these cloud-related services increased<br />
significantly in 2011.<br />
In September 2011, we announced the proposed spin-off and<br />
separate listing of HiChina. Further announcement will be made<br />
when we have more information to share.<br />
In 2012, HiChina’s focus on driving the growth of core businesses<br />
and new cloud-related services will remain unchanged.<br />
Sales and customer service<br />
In 2011, we had about 3,480 China Gold Supplier field sales<br />
staff and about 2,160 telephone sales representatives for China<br />
TrustPass and Global Gold Supplier. In addition to our sales team,<br />
we also had about 840 people in our customer service team, who<br />
are dedicated to handling customer inquiries.<br />
Employees<br />
As of December 31, 2011, <strong>Alibaba</strong>.com had 12,878 employees<br />
(13,674 employees as of December 31, 2010), including<br />
employees of the companies we acquired. Out of the total,<br />
about 2,284 employees were dedicated to product development.<br />
Related staff costs, including directors’ emoluments, were<br />
RMB2,835.0 million (2010: RMB2,371.7 million) for 2011. We<br />
review our employees’ performance on a quarterly basis and<br />
adjust compensation annually based on performance and with<br />
reference to market rates.<br />
FINANCIAL REVIEW<br />
Despite the challenges in global economy, we continued to report<br />
solid financial performance in 2011. As of December 31, 2011,<br />
we had 765,363 paying members in our international and China<br />
marketplaces, representing a 5.4% decrease year-on-year. This<br />
decrease was due to tightened requirements for membership<br />
acquisition and renewal, a proactive measure that we undertook<br />
during the year to enhance trust and safety on our platforms.<br />
Despite the decrease in the number of paying members, total<br />
revenue increased 15.5% from RMB5,557.6 million in 2010<br />
to RMB6,416.9 million in 2011 due to the increase in revenue<br />
generated from the sale of value-added services in both<br />
marketplaces as well as higher revenue from AliExpress and<br />
HiChina. As a result of the increase in revenue, profit attributable<br />
to equity owners increased 16.6% from RMB1,469.5 million<br />
in 2010 to RMB1,712.7 million in 2011. Basic earnings per<br />
share increased 22.8% from 33.4 Hong Kong cents in 2010 to<br />
41.0 Hong Kong cents in 2011.
Financial performance summary<br />
<strong>Alibaba</strong>.com Limited Annual Report 2011<br />
Year ended December 31<br />
2010 2011 Variance<br />
RMB’000 RMB’000 RMB’000 %<br />
Revenue 5,557,586 6,416,894 859,308 +15.5%<br />
Cost of revenue (931,016) (1,259,979) (328,963) +35.3%<br />
Operating expenses (3,199,058) (3,466,572) (267,514) +8.4%<br />
Other operating income, net 109,026 126,543 17,517 +16.1%<br />
Profit from operations 1,536,538 1,816,886 280,348 +18.2%<br />
Finance income, net 176,398 319,118 142,720 +80.9%<br />
Share of (losses)/profits of associated companies and<br />
jointly controlled entities, net of tax (6,479) 730 7,209 -111.3%<br />
Income tax charges (236,445) (427,896) (191,451) +81.0%<br />
Profit for the year 1,470,012 1,708,838 238,826 +16.2%<br />
Profit for the year attributable to equity owners 1,469,464 1,712,673 243,209 +16.6%<br />
Earnings per share, basic (RMB) 29.1 cents 34.0 cents 4.9 cents +16.8%<br />
Earnings per share, diluted (RMB) 28.9 cents 33.8 cents 4.9 cents +17.0%<br />
Earnings per share, basic (HK$) 33.4 cents 41.0 cents 7.6 cents +22.8%<br />
Earnings per share, diluted (HK$) 33.2 cents 40.7 cents 7.5 cents +22.6%<br />
Other non-GAAP metrics<br />
Profit attributable to equity owners before share-based<br />
compensation expense 1,810,435 2,048,810 238,375 +13.2%<br />
EBITA before share-based compensation expense 1,928,314 2,271,516 343,202 +17.8%<br />
Diluted earnings per share before share-based<br />
compensation expense (HK$) 40.9 cents 48.7 cents 7.8 cents +19.1%<br />
21
<strong>Alibaba</strong>.com Limited Annual Report 2011<br />
<strong>MANAGEMENT</strong> <strong>DISCUSSION</strong><br />
<strong>AND</strong> <strong>ANALYSIS</strong><br />
Revenue<br />
The following table and chart present, for the years indicated, a breakdown of revenue and its components as a percentage of revenue:<br />
International marketplace<br />
We generate revenue primarily by selling membership packages<br />
and value-added services to paying members on our international<br />
and China marketplaces. In addition, we also generate revenue<br />
from fees collected via transaction services as well as from other<br />
comprehensive Internet based services such as domain name<br />
registration, website hosting and solutions, email hosting and<br />
technology related consulting services.<br />
International marketplace<br />
Revenue from our international marketplace primarily consists of:<br />
• Membership fees from the sale of China Gold Supplier and<br />
Global Gold Supplier membership packages;<br />
• Revenue from the sale of value-added services, such as<br />
keywords, Ali-ADvance and Product Showcase to our paying<br />
members;<br />
• Transaction fees earned from buyers and sellers; and<br />
• Revenue from the provision of other comprehensive exportrelated<br />
services, which include sourcing, customs clearance,<br />
logistics and cargo insurance to our members.<br />
Revenue from our international marketplace was<br />
RMB3,752.6 million in 2011, representing a 15.9% increase<br />
from RMB3,238.2 million in 2010, primarily due to the increase<br />
22<br />
2010 2011 Change<br />
RMB’000 RMB’000 RMB’000 % of total revenue<br />
China Gold Supplier 3,148,498 3,641,321 492,823<br />
Global Gold Supplier 89,745 111,295 21,550<br />
Sub-total 3,238,243 3,752,616 514,373<br />
China marketplace<br />
China TrustPass 1,812,991 2,013,301 200,310<br />
Other revenue 80,908 204,100 123,192<br />
Sub-total 1,893,899 2,217,401 323,502<br />
Others 425,444 446,877 21,433<br />
Total 5,557,586 6,416,894 859,308<br />
1.5%<br />
1.7%<br />
1.5%<br />
3.2%<br />
7.7%<br />
7.0%<br />
2010<br />
2011<br />
32.6%<br />
31.3%<br />
34.1%<br />
34.5%<br />
56.7%<br />
56.8%<br />
58.2%<br />
58.5%<br />
in revenue from sales of value-added services like Product<br />
Showcase and Ali-ADvance. In addition, revenue from AliExpress<br />
also increased significantly because 2011 was the first-full year<br />
operation of the platform and the transaction volume also<br />
continued to gain traction. Furthermore, contribution from<br />
Vendio and Auctiva increased as 2011 was the first full-year<br />
consolidation of these two subsidiaries. The total number of<br />
paying members declined to 106,563 as of December 31, 2011,<br />
compared with 131,708 as of December 31, 2010.<br />
China marketplace<br />
Revenue from our China marketplace primarily consists of:<br />
• Membership fees from the sale of China TrustPass packages;<br />
• Revenue from the sale of value-added services comprising<br />
Ali-ADvance and Premium Placement to paying members;<br />
• Online branded advertisements on our China marketplace;<br />
and<br />
• Revenue from Liang Wu Xian, a supply chain service for<br />
Chinese manufacturers, which provides manufacturing<br />
control, product quality certification, logistics and inventory<br />
management and distribution channels management<br />
services.
Revenue from our China marketplace was RMB2,217.4 million in<br />
2011, representing a 17.1% increase from RMB1,893.9 million<br />
in 2010. The growth was largely attributable to the increase in<br />
revenue from Ali-ADvance and Premium Placement. The total<br />
number of paying members declined to 658,800 as of December<br />
31, 2011, compared to 677,654 as of December 31, 2010.<br />
Cost of revenue and gross profit<br />
The following table and chart present, for the years indicated, a breakdown of cost of revenue and its components as a percentage of<br />
revenue:<br />
Our cost of revenue increased to RMB1,260.0 million in 2011,<br />
representing a 35.3% increase from RMB931.0 million in 2010.<br />
Included in the cost of revenue was share-based compensation<br />
expense of RMB26.4 million and RMB36.4 million in 2010 and<br />
2011, respectively. Cost of revenue, including staff cost, traffic<br />
acquisition cost and business taxes expense increased as our<br />
revenue grew. Staff costs increased in 2011 mainly as a result<br />
of salary adjustment and various employee subsidy programs<br />
that were introduced for our general staff in the PRC. These<br />
programs include one-time living allowance and child education<br />
subsidy, payable in cash, to help our general staff to combat the<br />
high inflationary environment. We also introduced a housing<br />
<strong>Alibaba</strong>.com Limited Annual Report 2011<br />
2010 2011 Change<br />
RMB’000 RMB’000 RMB’000 % of total revenue<br />
Staff cost and related expenses 240,435 336,455 96,020<br />
Business taxes and related surcharges 259,982 323,648 63,666<br />
Bandwidth and depreciation expenses 178,023 222,415 44,392<br />
Others 252,576 377,461 124,885<br />
Total 931,016 1,259,979 328,963<br />
4.3%<br />
5.2%<br />
4.7%<br />
5.0%<br />
3.2%<br />
3.5%<br />
4.6%<br />
5.9%<br />
2010<br />
2011<br />
16.8%<br />
19.6%<br />
loan program to help qualified staff to buy their first own-use<br />
property. In addition, we invested more in traffic acquisition<br />
cost as we put more focus on performance-based services like<br />
Ali-ADvance.<br />
Gross profit increased to RMB5,156.9 million in 2011, up 11.5%<br />
from RMB4,626.6 million in 2010. Gross profit margin declined<br />
to 80.4% in 2011, as compared with 83.2% in 2010. The decline<br />
was primarily a result of the higher cost of revenue due to higher<br />
traffic acquisition costs as a percentage of revenue and the<br />
higher revenue contribution by AliExpress, Vendio and Auctiva<br />
which have relatively lower gross profit margins.<br />
2010 2011 Change<br />
RMB’000 RMB’000 RMB’000 % of total revenue<br />
Sales and marketing expenses 2,050,561 2,041,846 (8,715)<br />
Product development expenses 580,173 784,667 204,494<br />
General and administrative expenses 568,324 640,059 71,735<br />
Total 3,199,058 3,466,572 267,514<br />
Other revenue<br />
Other revenue, which mainly represents revenue from HiChina<br />
was RMB446.9 million in 2011, represents a 5.0% increase from<br />
RMB425.4 million in 2010.<br />
The following table and chart present, for the years indicated, a breakdown of operating expenses and its components as a percentage<br />
of revenue:<br />
2010<br />
2011<br />
10.4%<br />
12.2%<br />
10.2%<br />
10.0%<br />
36.9%<br />
31.8%<br />
57.5%<br />
54.0%<br />
23
<strong>Alibaba</strong>.com Limited Annual Report 2011<br />
<strong>MANAGEMENT</strong> <strong>DISCUSSION</strong><br />
<strong>AND</strong> <strong>ANALYSIS</strong><br />
Sales and marketing expenses<br />
Our sales and marketing expenses were RMB2,041.8 million<br />
in 2011, flat from RMB2,050.6 million in 2010. Included in<br />
sales and marketing expenses was share-based compensation<br />
expense of RMB95.1 million and RMB93.3 million in 2010 and<br />
2011 respectively. Our sales and marketing expenses remained<br />
flat in 2011 because of lower marketing costs partially offset<br />
by the increase in staff costs. In 2011, we invested more on<br />
traffic acquisition cost (included in cost of revenue) to help our<br />
performance-based transactions while in 2010 we spent more<br />
on advertising and promotion to build the brand awareness of<br />
our China marketplace. The increase in staff costs was mainly<br />
due to a change in the compensation structure of our sales team<br />
which increased the basic salary as well as employee subsidy<br />
programs as mentioned under “cost of revenue and gross profit”<br />
introduced to general staff during the year. As a result of the<br />
foregoing, sales and marketing expenses as a percentage of<br />
revenue decreased to 31.8% in 2011, as compared to 36.9% in<br />
2010.<br />
Product development expenses<br />
Our product development expenses were RMB784.7 million in<br />
2011, representing a 35.2% increase from RMB580.2 million<br />
in 2010. Included in product development expenses was<br />
share-based compensation expense of RMB71.5 million and<br />
RMB85.7 million in 2010 and 2011 respectively. Our product<br />
development expenses increased mainly because of increased<br />
staff costs as we hired more engineers to enhance our platform<br />
performance and to develop new initiatives to improve user<br />
experience and trust and safety measures. The salary adjustment<br />
and the staff subsidy program also contributed to the increase<br />
in staff cost. Consequently, product development expenses, as a<br />
percentage of revenue, increased to 12.2% in 2011, as compared<br />
with 10.4% in 2010.<br />
General and administrative expenses<br />
Our general and administrative expenses were RMB640.1 million<br />
in 2011, representing a 12.6% increase from RMB568.3 million<br />
in 2010. Included in general and administrative expenses was<br />
share-based compensation expense of RMB148.0 million and<br />
RMB120.7 million in 2010 and 2011 respectively. Our general<br />
and administrative expenses increased year-on-year mainly due to<br />
increased staff costs, which was attributable to salary adjustment<br />
and the subsidy program introduced during the year. General and<br />
administrative expenses as a percentage of revenue remained flat<br />
at 10.0% in 2011, compared with 10.2% in 2010.<br />
24<br />
Finance income, net<br />
Finance income, which consists of interest income and foreign<br />
currency exchange differences, was RMB319.1 million in 2011,<br />
representing an 80.9% increase from RMB176.4 million in 2010.<br />
The increase was principally due to a higher interest income<br />
from higher average cash balance and effective interest rate and<br />
increased exchange gains during the year.<br />
Income tax charges<br />
Current income tax charges primarily represented the provision<br />
for PRC Enterprise Income Tax for subsidiaries operating in the<br />
PRC. These subsidiaries are subject to PRC Enterprise Income Tax<br />
on their taxable income as reported in their respective statutory<br />
financial statements adjusted in accordance with the relevant tax<br />
laws and regulations in the PRC.<br />
Under the PRC Enterprise Income Tax Law, the standard corporate<br />
income tax rate for domestic enterprises and foreign invested<br />
enterprises is 25%. In addition, the PRC Enterprise Income Tax<br />
Law provides for, among other things, a preferential tax rate<br />
of 15% for enterprises qualified as High and New Technology<br />
Enterprises. <strong>Alibaba</strong> China, our principal operating entity, has<br />
been designated as a High and New Technology Enterprise in<br />
2011. As a result, our Group has used 15% to calculate <strong>Alibaba</strong><br />
China’s PRC Enterprise income Tax for 2011.<br />
Pursuant to Caishui [2008] No.1 under the PRC Enterprise Income<br />
Tax Law, a duly recognized Key Software Enterprise within China’s<br />
National Plan can enjoy a preferential PRC Enterprise Income Tax<br />
rate of 10%. <strong>Alibaba</strong> China was recognized in 2010 as a Key<br />
Software Enterprise by four ministries including the National<br />
Development and Reform Commission, the Ministry of Industry<br />
and Information Technology, the Ministry of Commerce and the<br />
State Administration for Taxation. As a result, our Group has<br />
used 10% to calculate <strong>Alibaba</strong> China’s PRC Enterprise Income Tax<br />
for 2010.<br />
Further, <strong>Alibaba</strong> China Software Co., Ltd. (“<strong>Alibaba</strong> Software”),<br />
another major PRC operating subsidiary of our Group, was<br />
recognized as a Software Enterprise in 2008, entitling it to full<br />
exemption from PRC Enterprise Income Tax for the first two years<br />
and 50% reduction in subsequent three years, starting from the<br />
company’s first profit-making year. Since 2008 was its first profitmaking<br />
year, <strong>Alibaba</strong> Software was subject to PRC Enterprise<br />
Income Tax at 12.5% for 2011 (2010: 12.5%).
Most of our remaining PRC entities are subject to the standard<br />
PRC Enterprise Income Tax at 25% for 2011 (2010: 25%).<br />
Income tax charges were RMB427.9 million in 2011, representing<br />
an 81.0% increase from RMB236.4 million in 2010. Our effective<br />
tax rate was 20.0% in 2011, which was higher than 13.9%<br />
<strong>Alibaba</strong>.com Limited Annual Report 2011<br />
in 2010. It is mainly because the relevant authorities have not<br />
started accepting applications for Key Software Enterprise status<br />
in 2011, and therefore, our Group has used 15% to calculate<br />
<strong>Alibaba</strong> China’s PRC Enterprise Income Tax for 2011, comparing<br />
with 10% in 2010. In addition, our Group has recorded<br />
withholding tax provision on the undistributed earnings retained<br />
by PRC subsidiaries in 2011.<br />
Share-based compensation expense<br />
The following table and chart present, for the years indicated, the allocation of share-based compensation expense and such expense as<br />
a percentage of revenue:<br />
2010 2011 Change<br />
RMB’000 RMB’000 RMB’000 % of total revenue<br />
Cost of revenue 26,365 36,383 10,018<br />
Sales and marketing expenses 95,096 93,372 (1,724)<br />
Product development expenses 71,476 85,686 14,210<br />
General and administrative expenses 148,034 120,696 (27,338)<br />
Total 340,971 336,137 (4,834)<br />
We seek to structure our employee compensation packages to<br />
allow our employees to share in the success of our business.<br />
Therefore, a large number of our employees have been granted<br />
share-based awards. <strong>Alibaba</strong> Group also operates share-based<br />
incentive schemes pursuant to which some of our employees<br />
and employees of <strong>Alibaba</strong> Group and its subsidiaries have been<br />
granted options to purchase shares of <strong>Alibaba</strong> Group or our<br />
shares (as held by <strong>Alibaba</strong> Group). In our consolidated financial<br />
statements, share-based compensation expense arising from<br />
the grant of share-based awards by us and <strong>Alibaba</strong> Group<br />
to our employees is allocated to and included as part of our<br />
expenses. In 2011, total share-based compensation expense<br />
was RMB336.1 million, a slight decrease of 1.4% compared<br />
with RMB341.0 million in 2010. As a result, share-based<br />
compensation expense as percentage of revenue also decreased<br />
to 5.2% in 2011, compared with 6.1% in 2010.<br />
Earnings before interest, taxes and amortization<br />
(“EBITA”)<br />
Our earnings before interest, taxes and amortization (“EBITA”)<br />
(non-GAAP) was RMB1,935.4 million for the year, an increase<br />
0.5%<br />
0.6%<br />
2010<br />
2011<br />
1.7%<br />
1.5%<br />
1.3%<br />
1.3%<br />
2.6%<br />
1.8%<br />
6.1%<br />
5.2%<br />
from RMB1,587.3 million in 2010. Despite a lower gross profit<br />
margin, EBITA margin before share-based compensation expense<br />
(non-GAAP) slightly increased to 35.4% in 2011 as we enjoyed<br />
a higher exchange gain and lower operating expense as a<br />
percentage of revenue in 2011.<br />
Profit attributable to equity owners<br />
We recorded a profit attributable to equity owners of<br />
RMB1,712.7 million in 2011, representing a 16.6% increase from<br />
RMB1,469.5 million in 2010. The increase was a result of the<br />
growth in our revenue driven by increased sales of value-added<br />
services and contributions from our new businesses.<br />
Earnings per share<br />
Earnings per share, basic and diluted, were 41.0 Hong Kong<br />
cents and 40.7 Hong Kong cents, respectively, in 2011, compared<br />
with 33.4 Hong Kong cents and 33.2 Hong Kong cents, for basic<br />
and diluted, respectively, in 2010. Diluted earnings per share<br />
before share-based compensation expense (non-GAAP), was<br />
48.7 Hong Kong cents in 2011, compared with 40.9 Hong Kong<br />
cents in 2010.<br />
25
<strong>Alibaba</strong>.com Limited Annual Report 2011<br />
<strong>MANAGEMENT</strong> <strong>DISCUSSION</strong><br />
<strong>AND</strong> <strong>ANALYSIS</strong><br />
LIQUIDITY <strong>AND</strong> CAPITAL RESOURCES<br />
Treasury management<br />
Our Treasury department, which reports to our Chief Financial<br />
Officer, monitors our current and expected liquidity requirements<br />
in accordance with policies and procedures approved by our<br />
Board. We have adopted prudent treasury management<br />
objectives, which include maintaining sufficient liquidity to<br />
meet our various funding requirements in accordance with our<br />
strategic plans while aiming to achieve a better return on our<br />
cash and hedging against foreign currency exchange risk. It is not<br />
our policy to invest our cash in financial products with significant<br />
underlying leverage or derivative exposure.<br />
Foreign currency exchange exposure<br />
Currency risk arises from future commercial transactions,<br />
recognized assets and liabilities and net investments in foreign<br />
operations. Although we operate businesses in different<br />
countries, substantially all of our revenue-generating and<br />
expense-related transactions are denominated in Renminbi,<br />
which is the functional currency of our key operating subsidiaries.<br />
Renminbi is not freely convertible into other foreign currencies.<br />
All foreign currency exchange transactions in the PRC must be<br />
effected through the State Administration of Foreign Exchange.<br />
As of December 31, 2011, 98.2% of our cash and bank balances<br />
were denominated in Renminbi.<br />
26<br />
Interest rate exposure<br />
Our exposure to changes in interest rates is mainly attributable to<br />
our interest-bearing assets and liabilities, including all cash and<br />
cash equivalents, term deposits with original maturities of over<br />
three months and short-term bank borrowings obtained and<br />
shown on our consolidated balance sheet.<br />
Credit risk exposure<br />
We consider our credit risk to be minimal as a substantial part of<br />
our income is prepaid by a diversified group of customers. The<br />
extent of our credit risk exposure is represented by the aggregate<br />
of cash and other investments we hold at banks and at other<br />
financial institutions. All of our cash and other investments are<br />
placed with financial institutions of sound credit quality and<br />
most of which bears maximum original maturities of less than<br />
12 months.<br />
Capital structure<br />
We continue to maintain a strong financial position as<br />
demonstrated by our solid recurring free cash flow from<br />
operations. We have been cautiously managing our cash<br />
to maintain a favorable return and to minimize any foreign<br />
exchange risk. As of December 31, 2011, we had cash and bank<br />
balances of RMB11,651.6 million, which was RMB2,068.1 million<br />
or 21.6% higher than that as of December 31, 2010. As of<br />
December 31, 2011, 98.2% of our cash and bank balances were<br />
in Renminbi (2010: 98.6%). The weighted average annual return<br />
on our cash and bank balances was 2.6% in 2011 (2010: 2.0%).
We further strengthened our balance sheet during the<br />
year. As of December 31, 2011, our total assets were<br />
RMB15,295.5 million (2010: RMB12,705.1 million), which<br />
were financed by shareholders’ funds of RMB7,520.2 million<br />
(2010: RMB5,803.0 million), current liabilities of<br />
RMB6,961.1 million (2010: RMB6,384.6 million) and<br />
non-current liabilities of RMB814.2 million (2010:<br />
RMB517.5 million). Of the total liabilities, RMB1,286.5 million<br />
(2010: RMB92.7 million) was funded from short-term<br />
bank borrowings. The increase in short-term bank borrowings<br />
was mainly used to fund various corporate actions carried out<br />
during the year. As of December 31, 2011, 78.3% of our<br />
short-term bank borrowings were at floating interest rate at an<br />
average annual cost of 0.9%. The remaining short-term bank<br />
borrowings which bear interest at fixed rates at 3.38% to 6.57%<br />
were added by One-Touch to finance its import and export services.<br />
As of December 31, 2011, our deferred revenue and customer<br />
advances amounted to RMB4,423.1 million, which was flat from<br />
that as of December 31, 2010. These upfront payments are<br />
reflected as liabilities until we provide services to earn the related<br />
revenue. Therefore, these liabilities do not represent actual<br />
obligations to pay customers but instead they provide an assured<br />
base for our future reported revenue.<br />
As of December 31, 2011, our reserves available for<br />
distribution, calculated in accordance with the Companies<br />
Law of the Cayman Islands, amounted to RMB3,132.5 million<br />
(2010: RMB3,340.1 million).<br />
<strong>Alibaba</strong>.com Limited Annual Report 2011<br />
Cash flow<br />
Net cash generated from operating activities<br />
Net cash generated from operating activities was<br />
RMB2,182.0 million in 2011, representing a 28.2% decrease<br />
from RMB3,039.4 million in 2010. The decrease in net cash<br />
generated from operating activities was principally because of<br />
the decrease in upfront collection of membership fee (reflected<br />
in “deferred revenue and customer advances” in our balance<br />
sheet) as a result of the slowdown in member acquisition. In<br />
addition, payment for income tax also increased along with our<br />
revenue growth for the year and there was a one-off tax refund<br />
of RMB76.8 million in 2010.<br />
Net cash used in investing activities<br />
Net cash used in investing activities was RMB1,585.5 million<br />
in 2011 compared with RMB2,747.0 million in 2010. Net cash<br />
used in investing activities during the year primarily represented<br />
placement of cash in time deposits with original maturities<br />
of over three months of RMB1,721.3 million and capital<br />
expenditures of RMB172.1 million.<br />
In 2011, our capital expenditures decreased by 41.6% to<br />
RMB172.1 million (2010: RMB294.5 million). The decrease in<br />
capital expenditures was primarily due to the increased usage of<br />
server capacity held by our sister company AliCloud and therefore<br />
we reduced our fixed asset spending on computer hardware.<br />
27
<strong>Alibaba</strong>.com Limited Annual Report 2011<br />
<strong>MANAGEMENT</strong> <strong>DISCUSSION</strong><br />
<strong>AND</strong> <strong>ANALYSIS</strong><br />
Net cash generated from financing activities<br />
Net cash used in financing activities was RMB244.3 million in<br />
2011, compared with cash inflow of RMB51.3 million in 2010.<br />
The cash outflow in 2011 mainly represented payment of special<br />
dividends declared in December 2010 of RMB947.7 million and<br />
the payments for repurchase of issued ordinary shares in the<br />
latter half of the year as part of our continuing share buy-back<br />
program amounting to RMB416.3 million, partially offset by a<br />
RMB1,146.6 million drawdown on bank facilities.<br />
Recurring free cash flow<br />
Recurring free cash flow (non-GAAP), which represents net<br />
cash flow generated from operating activities as presented in<br />
our consolidated cash flow statement less purchase of property<br />
and equipment and excludes non-recurring capital expenditure<br />
such as payment for the construction of our Binjiang campus<br />
and other one-off items, was RMB1,981.1 million in 2011,<br />
representing a 30.3% decrease from RMB2,840.8 million in<br />
2010. The decrease in recurring free cash flow was mainly due to<br />
the decrease in the cash flow generated from operating activities<br />
due to the decrease in paid membership.<br />
DIVIDEND<br />
Our Board did not recommend the payment of a final dividend<br />
for the year ended December 31, 2011 (2010: nil).<br />
28<br />
OFF-BALANCE SHEET ARRANGEMENTS<br />
As of December 31, 2011, we did not have any material offbalance<br />
sheet arrangements.<br />
PLEDGE OF ASSETS <strong>AND</strong> CONTINGENT LIABILITIES<br />
As of December 31, 2011, restricted cash amounting to<br />
RMB135 million of one of our subsidiaries was pledged to secure<br />
its short-term bank borrowings. Except for such charge, none<br />
of our assets were pledged and we did not have any material<br />
contingent liabilities or guarantees.<br />
MATERIAL ACQUISITIONS <strong>AND</strong> DISPOSAL OF<br />
ASSETS<br />
During 2011, our Group completed the acquisition of a 65%<br />
equity interest in One-Touch. One-Touch, a company based in<br />
the PRC, is a provider of one-stop import and export services<br />
to small and medium enterprises in the PRC. The acquisition<br />
was completed in January 2011 and the first installment of<br />
the purchase consideration in cash was paid. The remaining<br />
consideration balance will be paid in 2014 and the amounts may<br />
be adjusted based on the operating and financial performance of<br />
One-Touch in 2013.
OUTLOOK<br />
Looking ahead, we remain cautious on the global economic<br />
environment. Uncertainties in the global economy are expected<br />
to elevate in 2012. The Euro zone’s lingering sovereign debt<br />
crisis may dent economic growth. A mild recession in Europe and<br />
further deleveraging in the U.S. loom large this year and impose<br />
further downside risks on China’s exports. In China, we expect<br />
core inflation pressures will remain subdued while economic<br />
growth may slip alongside the slowdown in international trade<br />
and the cooling off of the real estate market. Under current<br />
complex macro conditions, we believe that challenges to<br />
worldwide and domestic China economy will remain.<br />
Despite the challenging background we foresee in 2012, we<br />
will continue to implement our strategies we set forth for the<br />
company’s evolution and investment. We will stay focused<br />
on upgrading our business model and building quality and<br />
trustworthy e-commerce platforms. In particular, we continue<br />
to invest in new businesses such as AliExpress, Liang Wu Xian<br />
and performance-based services where we expect to see the<br />
upside potential in the future. It is worth reiterating that we<br />
will continue to enhance the quality of users and e-commerce<br />
platforms. Going forward, we will uphold our high standards for<br />
trust and safety and user experience. We have set clear goals and<br />
priorities for 2012: 1) true and credible information quality on<br />
the platform, 2) better buyer and seller experience, and 3) more<br />
<strong>Alibaba</strong>.com Limited Annual Report 2011<br />
transactions online. All these initiatives will contribute to growth<br />
in website traffic and online activities. We envisage a more<br />
balanced, multi-revenue stream model in the long run. In the<br />
near term, we will depend less on membership growth.<br />
We will concentrate on developing the quality of our platforms<br />
and new businesses associated with business model upgrades,<br />
which will take time and require continuous investment.<br />
Although these may adversely affect our membership growth<br />
and financial performance and limit earnings visibility in the<br />
near term, we are confident that the shift away from aggressive<br />
membership acquisition to focus on strengthening buyer’s trust<br />
on <strong>Alibaba</strong>.com will benefit our customers and our long-term<br />
business growth.<br />
29
GLOBAL<br />
REACH<br />
BRIDGING BUYERS <strong>AND</strong><br />
SUPPLIERS FROM ALL OVER<br />
THE WORLD<br />
Thanks to website optimization and enhanced<br />
trust and safety measures, we have seen a healthy<br />
growth in our global buyer base and overseas<br />
traffic in 2011, representing more opportunities<br />
for us to connect buyers and suppliers worldwide
INTERACTION<br />
ENCOURAGING COMMUNICATION<br />
AMONG USERS<br />
We are building a dynamic rating and feedback<br />
system on our China marketplace in a bid to<br />
develop a “trust profile” for every user as well as<br />
facilitate more online activities between buyers and<br />
sellers