Equivalent temperature - Climate Science: Roger Pielke Sr.
Equivalent temperature - Climate Science: Roger Pielke Sr.
Equivalent temperature - Climate Science: Roger Pielke Sr.

Create successful ePaper yourself
Turn your PDF publications into a flip-book with our unique Google optimized e-Paper software.
the autoregressive error model and has been used here.<br />
To obtain a best estimate for the actual trend β, first,<br />
an ordinary least squares estimate of β is found. Next,<br />
the autoregressive parameter vector is estimated, also<br />
providing an initial estimate of the variance. This cycle<br />
then repeats itself as necessary until a best estimate of β is<br />
obtained. Once this best estimate is obtained, a t-ratio<br />
(Eq. (5)) is then computed for the trend estimate to determine<br />
whether or not this estimate is significantly different<br />
from zero.<br />
The SAS/ETS® software package was used to compute<br />
the T and TE trend estimates. Trend estimates were<br />
C.A. Davey et al. / Global and Planetary Change 54 (2006) 19–32<br />
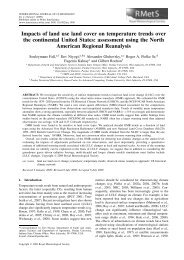
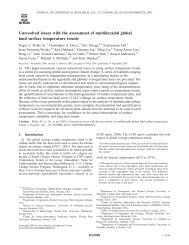
Fig. 4. Same as in Fig. 3, but for individual trends that are at least 90% significant (a) and individual trends that are at least 95% significant (b). All<br />
stations in these computations are weighted equally.<br />
computed for only those time series having at least 10<br />
available data points (years) and the trend estimates<br />
accounted for autocorrelations covering up to four time<br />
intervals (i.e. lag-4), which means that any autocorrelations<br />
out to 4 years were corrected for in this analysis.<br />
This choice for the maximum lag interval was intended<br />
to remove most influences from interannual correlations.<br />
Once the T and TE trend estimates were computed,<br />
summary statistics were computed for the entire surface<br />
dataset for both T and T E. These summary statistics were<br />
then compared with each other using null hypothesis<br />
significance testing (NHST; Devore, 1995) todetermine<br />
23