Equivalent temperature - Climate Science: Roger Pielke Sr.
Equivalent temperature - Climate Science: Roger Pielke Sr.
Equivalent temperature - Climate Science: Roger Pielke Sr.

Create successful ePaper yourself
Turn your PDF publications into a flip-book with our unique Google optimized e-Paper software.
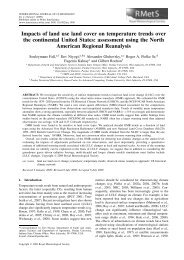
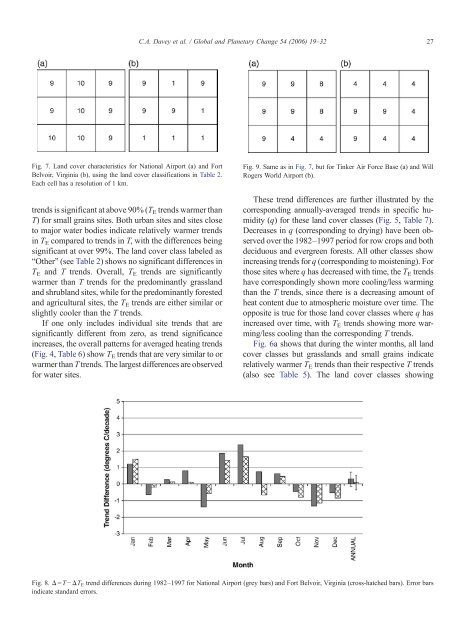
Fig. 7. Land cover characteristics for National Airport (a) and Fort<br />
Belvoir, Virginia (b), using the land cover classifications in Table 2.<br />
Each cell has a resolution of 1 km.<br />
trends is significant at above 90% (TE trends warmer than<br />
T) for small grains sites. Both urban sites and sites close<br />
to major water bodies indicate relatively warmer trends<br />
in T E compared to trends in T, with the differences being<br />
significant at over 99%. The land cover class labeled as<br />
“Other” (see Table 2) shows no significant differences in<br />
TE and T trends. Overall, TE trends are significantly<br />
warmer than T trends for the predominantly grassland<br />
and shrubland sites, while for the predominantly forested<br />
and agricultural sites, the TE trends are either similar or<br />
slightly cooler than the T trends.<br />
If one only includes individual site trends that are<br />
significantly different from zero, as trend significance<br />
increases, the overall patterns for averaged heating trends<br />
(Fig. 4, Table 6)showTE trends that are very similar to or<br />
warmer than T trends. The largest differences are observed<br />
for water sites.<br />
C.A. Davey et al. / Global and Planetary Change 54 (2006) 19–32<br />
Fig. 9. Same as in Fig. 7, but for Tinker Air Force Base (a) and Will<br />
<strong>Roger</strong>s World Airport (b).<br />
These trend differences are further illustrated by the<br />
corresponding annually-averaged trends in specific humidity<br />
(q) for these land cover classes (Fig. 5, Table 7).<br />
Decreases in q (corresponding to drying) have been observed<br />
over the 1982–1997 period for row crops and both<br />
deciduous and evergreen forests. All other classes show<br />
increasing trends for q (corresponding to moistening). For<br />
those sites where q has decreased with time, the TE trends<br />
have correspondingly shown more cooling/less warming<br />
than the T trends, since there is a decreasing amount of<br />
heat content due to atmospheric moisture over time. The<br />
opposite is true for those land cover classes where q has<br />
increased over time, with T E trends showing more warming/less<br />
cooling than the corresponding T trends.<br />
Fig. 6a shows that during the winter months, all land<br />
cover classes but grasslands and small grains indicate<br />
relatively warmer TE trends than their respective T trends<br />
(also see Table 5). The land cover classes showing<br />
Fig. 8. Δ=T−ΔT E trend differences during 1982–1997 for National Airport (grey bars) and Fort Belvoir, Virginia (cross-hatched bars). Error bars<br />
indicate standard errors.<br />
27