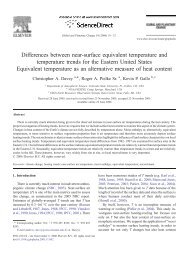
How to evaluate vulnerability in changing environmental conditions
How to evaluate vulnerability in changing environmental conditions
How to evaluate vulnerability in changing environmental conditions

Create successful ePaper yourself
Turn your PDF publications into a flip-book with our unique Google optimized e-Paper software.
494<br />
CHAPTER E.3 .Contrast between Predictive and Vulnerability Approaches<br />
There does exist some question as <strong>to</strong> whether compar<strong>in</strong>g<br />
the two sets of f<strong>in</strong>d<strong>in</strong>gs is appropriate. Karl and<br />
Knight (1998b) note that "As yet, there does not appear<br />
<strong>to</strong> be a good phys-ical explanation as <strong>to</strong> how peak flows<br />
could show no change (other than a sampl<strong>in</strong>g bias), given<br />
that there has been an across-the-board <strong>in</strong>crease <strong>in</strong> extreme<br />
precipitation for 1- <strong>to</strong> 7-day extreme and heavy<br />
precipitation events, mean streamflows, and <strong>to</strong>tal and<br />
annual precipitation. "<br />
Karl et al. (1995) document that the <strong>in</strong>crease <strong>in</strong> precipitation<br />
occurs mostly <strong>in</strong> spr<strong>in</strong>g, summer, and autumn,<br />
but not <strong>in</strong> w<strong>in</strong>ter. H. L<strong>in</strong>s (1999, pers. comn.) notes that<br />
peak streamflow is closely connected <strong>to</strong> w<strong>in</strong>ter precipitation<br />
and that "precipitation <strong>in</strong>creases <strong>in</strong> summer and<br />
autumn provide runoff <strong>to</strong> rivers and streams at the very<br />
time of year when they are most able <strong>to</strong> carry the water<br />
with<strong>in</strong> their banks. Thus, we see <strong>in</strong>creases <strong>in</strong> the lower<br />
half of the streamflow distribution. "<br />
Karl's reference <strong>to</strong> a sampl<strong>in</strong>g bias arises because of Furthermore,McCabe and Wolock (1997) suggest that<br />
the differences <strong>in</strong> the areal coverage of the L<strong>in</strong>s and Slack detection of trends <strong>in</strong> runoff, a determ<strong>in</strong><strong>in</strong>g fac<strong>to</strong>r <strong>in</strong><br />
study and those led by Karl. L<strong>in</strong>s and Slack (1999) focus streamflow, are more difficult <strong>to</strong> observe than trends <strong>in</strong><br />
on streamflow <strong>in</strong> bas<strong>in</strong>s that are "climate sensitive" (Slack precipitation: "the probability of detect<strong>in</strong>g trends <strong>in</strong><br />
and Landwehr 1992). Karl suggests that these bas<strong>in</strong>s are measured runoff (i.e. streamflow) may be very low, even<br />
not uniformly distributed over the United States, lead<strong>in</strong>g<br />
<strong>to</strong> questions of the validity of the L<strong>in</strong>s and Slack f<strong>in</strong>d-<br />
if there are real underly<strong>in</strong>g trends <strong>in</strong> the data such as<br />
trends caused by climate change. " McCabe and Wolock<br />
<strong>in</strong>gs on a national scale (T. Karl 1999, pers. comn.). While focus on detection of trends <strong>in</strong> mean runoff! streamflow,<br />
further research is clearly needed <strong>to</strong> understand the con- so there is some question as <strong>to</strong> its applicability <strong>to</strong> peak<br />
nections between precipitation and streamflow, a study flows. If the fmd<strong>in</strong>gs do hold at the higher levels of run-<br />
by Pielke and Down<strong>to</strong>n (2000) on the relationship of preoff-streamflow, then this would provide another reason<br />
cipitation and flood damages suggests that the relation- why the work of L<strong>in</strong>s and Slack is not <strong>in</strong>consistent with<br />
ship between precipitation and flood damages provides that of Karl et al., as it would be physically possible that<br />
<strong>in</strong>formation that is useful <strong>in</strong> develop<strong>in</strong>g relevant hypoth- the two sets of analyses are complementary.<br />
eses and plac<strong>in</strong>g the precipitation-streamflow debate <strong>in</strong><strong>to</strong> In any case, an analysis of the damage record shows<br />
a broader policy context (cf. Changnon 1998).<br />
that at a national level any trends <strong>in</strong> extreme hydrologi-<br />
Pielke and Down<strong>to</strong>n (2000) offer an analysis that cal floods are not large <strong>in</strong> comparison <strong>to</strong> the growth <strong>in</strong><br />
helps <strong>to</strong> address the apparent paradox. They relate trends societal <strong>vulnerability</strong>. Even so, there is a documented<br />
<strong>in</strong> various measures of precipitation with trends <strong>in</strong> flood relationship between precipitation and flood damages,<br />
damage <strong>in</strong> the United States. The study f<strong>in</strong>ds that the <strong>in</strong>dependent of growth <strong>in</strong> national population: as pre-<br />
<strong>in</strong>crease <strong>in</strong> precipitation (however measured) is <strong>in</strong>sufcipitation <strong>in</strong>creases, so does flood damage.<br />
ficient <strong>to</strong> expla<strong>in</strong> <strong>in</strong>creas<strong>in</strong>g flood damages or variabil- From these results it is possible <strong>to</strong> argue that <strong>in</strong>terity<br />
<strong>in</strong> flood damages. The study strongly suggests that pretations <strong>in</strong> the policy debate of the various recent stud-<br />
societal fac<strong>to</strong>rs -growth <strong>in</strong> population and wealth -are ies of precipitation and streamflow have been mislead-<br />
partly responsible for the observed trend <strong>in</strong> flood dam<strong>in</strong>g. On the one hand, <strong>in</strong>creas<strong>in</strong>g "extreme" precipitaages.<br />
The analysis shows that a relatively small fraction tion has not been the most important fac<strong>to</strong>r <strong>in</strong> docu-<br />
of the <strong>in</strong>crease <strong>in</strong> damages can be associated with the mented <strong>in</strong>creases <strong>in</strong> flood damage. On the other hand,<br />
small <strong>in</strong>creas<strong>in</strong>g trends <strong>in</strong> precipitation. Indeed, after evidence of a lack of trends <strong>in</strong> peak flows does not mean<br />
adjust<strong>in</strong>g damages for the change <strong>in</strong> national wealth, that policy-makers need not worry about <strong>in</strong>creas<strong>in</strong>g pre-<br />
there is no significant trend <strong>in</strong> damages. This would tend cipitation or future floods. Advocates push<strong>in</strong>g either l<strong>in</strong>e<br />
<strong>to</strong> support the assertion by L<strong>in</strong>s and Slack (1999) that of argument <strong>in</strong> the policy arena risk misus<strong>in</strong>g what the<br />
<strong>in</strong>creas<strong>in</strong>g precipitation is not <strong>in</strong>consistent with an ab- scientific record actually shows. What has thus far been<br />
sence of upward trends <strong>in</strong> extreme streamflow. In other largely missed <strong>in</strong> the debate is that the solutions <strong>to</strong> the<br />
words, there is no paradox. As they write, "We suspect flood problems <strong>in</strong> the USA lie not only <strong>in</strong> a better un-<br />
that our streamflow f<strong>in</strong>d<strong>in</strong>gs are consistent with the prederstand<strong>in</strong>g of the hydrological and atmospheric ascipitation<br />
f<strong>in</strong>d<strong>in</strong>gs of Karl and his collabora<strong>to</strong>rs (1995, pects of flood<strong>in</strong>g, but also <strong>in</strong> a better understand<strong>in</strong>g of<br />
1998). The reported <strong>in</strong>creases <strong>in</strong> precipitation are mod- the societal aspects of flood damage (see Pielke and<br />
est, although concentrated <strong>in</strong> the higher quantiles.<br />
Moreover, the trends described for the extreme precipitation<br />
category (> 50.4 mm d-l) are not necessarily suf-<br />
Down<strong>to</strong>n 2000, for further discussion).<br />
ficient <strong>to</strong> generate an <strong>in</strong>crease <strong>in</strong> flood<strong>in</strong>g. It would be E.3.2 Quantify<strong>in</strong>g Uncerta<strong>in</strong>ty Us<strong>in</strong>g a<br />
useful <strong>to</strong> know if there are trends <strong>in</strong> 24-hour precipitation<br />
<strong>in</strong> the> 100 mm and larger categories. The term<br />
Bayesian Approach<br />
"extreme", <strong>in</strong> the context of these thresholds, may have As new <strong>in</strong>formation on <strong>vulnerability</strong> and changes <strong>in</strong><br />
more mean<strong>in</strong>g with respect <strong>to</strong> changes <strong>in</strong> flood hydrol- the probability distribution of extreme values become<br />
ogy."<br />
better known, risk estimates should be updated. We