How to evaluate vulnerability in changing environmental conditions
How to evaluate vulnerability in changing environmental conditions
How to evaluate vulnerability in changing environmental conditions

Create successful ePaper yourself
Turn your PDF publications into a flip-book with our unique Google optimized e-Paper software.
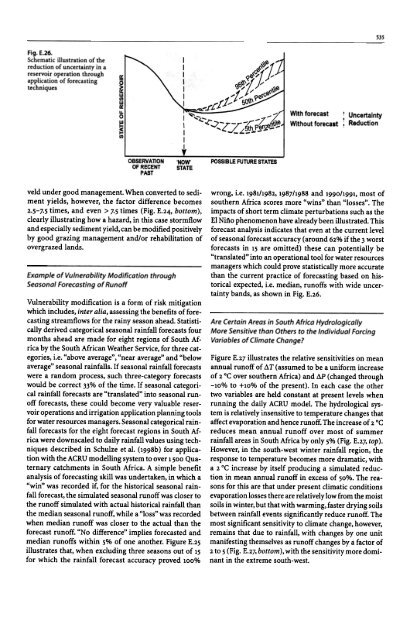
Fig. E.26.<br />
Schematic illustration of the<br />
reduction of uncerta<strong>in</strong>ty <strong>in</strong> a<br />
reservoir operation through<br />
application of forecast<strong>in</strong>g<br />
techniques<br />
535<br />
With forecast! Uncerta<strong>in</strong>ty<br />
Without forecast: Reduction<br />
veld under good management. When converted <strong>to</strong> sedi- wrong, i.e. 1981/1982, 1987/1988 and 1990/1991, most of<br />
ment yields, however, the fac<strong>to</strong>r difference becomes southern Africa scores more "w<strong>in</strong>s" than "losses". The<br />
2.5-7.5 times, and even> 7.5 times (Fig. E.24, bot<strong>to</strong>m), impacts of short term climate perturbations such as the<br />
clearly illustrat<strong>in</strong>g how a hazard, <strong>in</strong> this case s<strong>to</strong>rmflow EI N<strong>in</strong>o phenomenon have already been illustrated. This<br />
and especially sediment yield, can be modified positively forecast analysis <strong>in</strong>dicates that even at the current level<br />
by good graz<strong>in</strong>g management and/or rehabilitation of of seasonal forecast accuracy (around 62% if the 3 worst<br />
overgrazed lands.<br />
forecasts <strong>in</strong> 15 are omitted) these can potentially be<br />
"translated" <strong>in</strong><strong>to</strong> an operational <strong>to</strong>ol for water resources<br />
managers which could prove statistically more accurate<br />
Example of Vulnerability Modification through<br />
than the current practice of forecast<strong>in</strong>g based on his-<br />
Seasonal Forecast<strong>in</strong>g of Runoff<br />
Vulnerability modification is a form of risk mitigation<br />
which <strong>in</strong>cludes, <strong>in</strong>ter alia, assess<strong>in</strong>g the benefits of fore<strong>to</strong>rical<br />
expected, i.e. median, runoffs with wide uncerta<strong>in</strong>ty<br />
bands, as shown <strong>in</strong> Fig. E.26.<br />
cast<strong>in</strong>g streamflows for the ra<strong>in</strong>y season ahead. Statisti- Are Certa<strong>in</strong> Areas <strong>in</strong> South Africa Hydrologically<br />
cally derived categorical seasonal ra<strong>in</strong>fall forecasts four More Sensitive than Others <strong>to</strong> the Individual Forc<strong>in</strong>g<br />
months ahead are made for eight regions of South Africa<br />
by the South African Weather Service, for three cat-<br />
Variables of Climate Change?<br />
egories, i.e. "above average", "near average" and "below Figure E.2? illustrates the relative sensitivities on mean<br />
average" seasonal ra<strong>in</strong>falls. If seasonal ra<strong>in</strong>fall forecasts annual runoff of dT (assumed <strong>to</strong> be a uniform <strong>in</strong>crease<br />
were a random process, such three-category forecasts of 2 °C over southern Africa) and M (changed through<br />
would be correct 33% of the time. If seasonal categori- -10% <strong>to</strong> +10% of the present). In each case the other<br />
cal ra<strong>in</strong>fall forecasts are "translated" <strong>in</strong><strong>to</strong> seasonal run- two variables are held constant at present levels when<br />
off forecasts, these could become very valuable reser- runn<strong>in</strong>g the daily ACRU model. The hydrological sysvoir<br />
operations and irrigation application plann<strong>in</strong>g <strong>to</strong>ols tem is relatively <strong>in</strong>sensitive <strong>to</strong> temperature changes that<br />
for water resources managers. Seasonal categorical ra<strong>in</strong>- affect evaporation and hence runoff. The <strong>in</strong>crease of 2 °C<br />
fall forecasts for the eight forecast regions <strong>in</strong> South Af- reduces mean annual runoff over most of summer<br />
rica were downscaled <strong>to</strong> daily ra<strong>in</strong>fall values us<strong>in</strong>g tech- ra<strong>in</strong>fall areas <strong>in</strong> South Africa by only 5% (Fig. E.2], <strong>to</strong>p).<br />
niques described <strong>in</strong> Schulze et al. (1998b) for applica- <strong>How</strong>ever, <strong>in</strong> the south-west w<strong>in</strong>ter ra<strong>in</strong>fall region, the<br />
tion with the ACRU modell<strong>in</strong>g system <strong>to</strong> over 1500 Qua- response <strong>to</strong> temperature becomes more dramatic, with<br />
ternary catchments <strong>in</strong> South Africa. A simple benefit a 2 °C <strong>in</strong>crease by itself produc<strong>in</strong>g a simulated reduc-<br />
analysis of forecast<strong>in</strong>g skill was undertaken, <strong>in</strong> which a tion <strong>in</strong> mean annual runoff <strong>in</strong> excess of 50%. The rea-<br />
"w<strong>in</strong>" was recorded if, for the his<strong>to</strong>rical seasonal ra<strong>in</strong>sons for this are that under present climatic <strong>conditions</strong><br />
fall forecast, the simulated seasonal runoff was closer <strong>to</strong> evaporation losses there are relatively low from the moist<br />
the runoff simulated with actual his<strong>to</strong>rical ra<strong>in</strong>fall than soils <strong>in</strong> w<strong>in</strong>ter, but that with warm<strong>in</strong>g, faster dry<strong>in</strong>g soils<br />
the median seasonal runoff, while a "loss" was recorded between ra<strong>in</strong>fall events significantly reduce runoff. The<br />
when median runoff was closer <strong>to</strong> the actual than the most significant sensitivity <strong>to</strong> climate change, however,<br />
forecast runoff. "No difference" implies forecasted and rema<strong>in</strong>s that due <strong>to</strong> ra<strong>in</strong>fall, with changes by one unit<br />
median runoffs with<strong>in</strong> 5% of one another. Figure E.25 manifest<strong>in</strong>g themselves as runoff changes by a fac<strong>to</strong>r of<br />
illustrates that, when exclud<strong>in</strong>g three seasons out of 15 2 <strong>to</strong> 5 (Fig. E.2?, bot<strong>to</strong>m), with the sensitivity more domi-<br />
for which the ra<strong>in</strong>fall forecast accuracy proved 100% nant <strong>in</strong> the extreme south-west.