How to evaluate vulnerability in changing environmental conditions
How to evaluate vulnerability in changing environmental conditions
How to evaluate vulnerability in changing environmental conditions

Create successful ePaper yourself
Turn your PDF publications into a flip-book with our unique Google optimized e-Paper software.
--~ ~<br />
which met strict selection criteria <strong>in</strong> terms of record<br />
length and consistency with neighbour<strong>in</strong>g gaug<strong>in</strong>g stations,<br />
were selected from the GRDC archive for use <strong>in</strong><br />
develop<strong>in</strong>g the database. These stations were co-registered<br />
<strong>to</strong> a 30-m<strong>in</strong>ute Simulated Topological Network<br />
(STN-30; V6rosmarty et al. 2000).<br />
The Center for International Earth Science Information<br />
Network has produced a global population database<br />
us<strong>in</strong>g census data for 120 000 adm<strong>in</strong>istrative units<br />
(CIESIN 2000). We compare <strong>conditions</strong> between 1995<br />
and the year 2025, start<strong>in</strong>g with a gridded dataset at 2.5m<strong>in</strong>ute<br />
(4 km) grid <strong>in</strong>crements. The 1995 cell counts were<br />
extrapolated exponentially <strong>to</strong> 2025 and then capped us<strong>in</strong>g<br />
the low growth projection for each country (United<br />
Nations Population Division 1998). The cell population<br />
counts were then aggregated <strong>to</strong> 30-m<strong>in</strong>ute grid <strong>in</strong>crements<br />
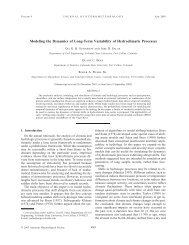
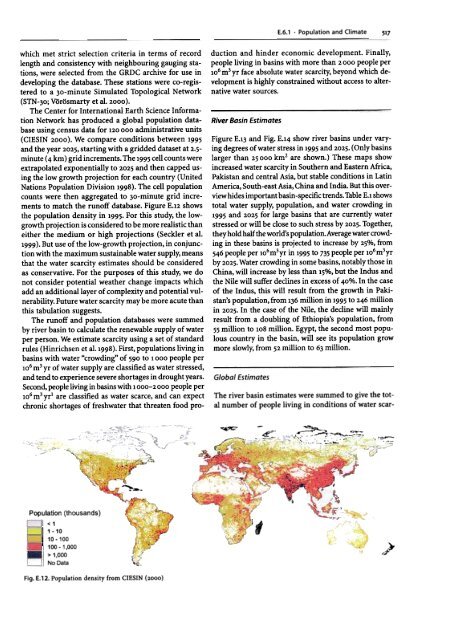
<strong>to</strong> match the runoff database. Figure E.12 shows<br />
the population density <strong>in</strong> 1995. For this study, the lowgrowth<br />
projection is considered <strong>to</strong> be more realistic than<br />
either the medium or high projections (Seckler et al.<br />
1999). But use of the low-growth projection, <strong>in</strong> conjunction<br />
with the maximum susta<strong>in</strong>able water supply, means<br />
that the water scarcity estimates should be considered<br />
as conservative. For the purpose~ of this study, we do<br />
not consider potential weather change impacts which<br />
add an additional layer of complexity and potential <strong>vulnerability</strong>.<br />
Future water scarcity may be more acute than<br />
this tabulation suggests.<br />
The runoff and population databases were summed<br />
by river bas<strong>in</strong> <strong>to</strong> calculate the renewable supply of water<br />
per person. We estimate scarcity us<strong>in</strong>g a set of standard<br />
rules (H<strong>in</strong>richsen et al.1998). First, populations liv<strong>in</strong>g <strong>in</strong><br />
bas<strong>in</strong>s with water "crowd<strong>in</strong>g" of 590 <strong>to</strong> 1 000 people per<br />
106 m3 yr of water supply are classified as water stressed,<br />
and tend <strong>to</strong> experience severe shortages <strong>in</strong> drought years.<br />
Second, people liv<strong>in</strong>g <strong>in</strong> bas<strong>in</strong>s with 1000-2000 people per<br />
106 m3 yr are classified as water scarce, and can expect<br />
chronic shortages of freshwater that threaten food pro-<br />
Population (thousands)<br />
I < 1<br />
11-10<br />
110-100,<br />
100-1,000<br />
I > 1,000<br />
No Data<br />
~--<br />
Fig. E.12. Population density from CIESIN (2000)<br />
Global Estimates<br />
E.6.1 .Population and Climate 517<br />
duction and h<strong>in</strong>der economic development. F<strong>in</strong>ally,<br />
people liv<strong>in</strong>g <strong>in</strong> bas<strong>in</strong>s with more than 2000 people per<br />
106 m3 yr face absolute water scarcity, beyond which development<br />
is highly constra<strong>in</strong>ed without access <strong>to</strong> alternative<br />
water sources.<br />
River Bas<strong>in</strong> Estimates<br />
Figure E.13 and Fig. E.14 show river bas<strong>in</strong>s under vary<strong>in</strong>g<br />
degrees of water stress <strong>in</strong> 1995 and 2025. (Only bas<strong>in</strong>s<br />
larger than 25000 km2 are shown.) These maps show<br />
<strong>in</strong>creased water scarcity <strong>in</strong> Southern and Eastern Africa,<br />
Pakistan and central Asia, but stable <strong>conditions</strong> <strong>in</strong> Lat<strong>in</strong><br />
America, South-east Asia, Ch<strong>in</strong>a and India. But this overview<br />
hides important bas<strong>in</strong>-specific trends. Table E.l shows<br />
<strong>to</strong>tal water supply, population, and water crowd<strong>in</strong>g <strong>in</strong><br />
1995 and 2025 for large bas<strong>in</strong>s that are currently water<br />
stressed or will be close <strong>to</strong> such stress by 2025. Together,<br />
they hold half the world's population. Average water crowd<strong>in</strong>g<br />
<strong>in</strong> these bas<strong>in</strong>s is projected <strong>to</strong> <strong>in</strong>crease by 25%, from<br />
546 people per 106m3yr <strong>in</strong> 1995 <strong>to</strong> 735 people per 106m3yr<br />
by 2025. Water crowd<strong>in</strong>g <strong>in</strong> some bas<strong>in</strong>s, notably those <strong>in</strong><br />
Ch<strong>in</strong>a, will <strong>in</strong>crease by less than 15%, but the Indus and<br />
the Nile will suffer decl<strong>in</strong>es <strong>in</strong> excess of 40%. In the case<br />
of the Indus, this will result from the growth <strong>in</strong> Pakistan's<br />
population, from 136 million <strong>in</strong> 1995 <strong>to</strong> 246 million<br />
<strong>in</strong> 2025. In the case of the Nile, the decl<strong>in</strong>e will ma<strong>in</strong>ly<br />
result from a doubl<strong>in</strong>g of Ethiopia's population, from<br />
55 million <strong>to</strong> 108 million. Egypt, the second most populous<br />
country <strong>in</strong> the bas<strong>in</strong>, will see its population grow<br />
more slowly, from 52 million <strong>to</strong> 63 million.<br />
The river bas<strong>in</strong> estimates were summed <strong>to</strong> give the <strong>to</strong>tal<br />
number of people liv<strong>in</strong>g <strong>in</strong> <strong>conditions</strong> of water scar-<br />
~<br />
It<br />
~ :-' ~:--~'-'~':'.-.::c~':":"'" ..,..----,<br />
,/