Lead Human Exposure and Health Risk Assessments for Selected ...
Lead Human Exposure and Health Risk Assessments for Selected ...
Lead Human Exposure and Health Risk Assessments for Selected ...
Create successful ePaper yourself
Turn your PDF publications into a flip-book with our unique Google optimized e-Paper software.
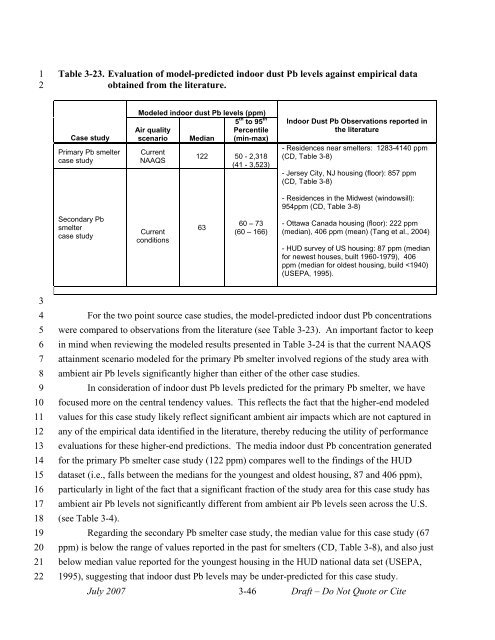
1 Table 3-23. Evaluation of model-predicted indoor dust Pb levels against empirical data<br />
2 obtained from the literature.<br />
Case study<br />
Primary Pb smelter<br />
case study<br />
Secondary Pb<br />
smelter<br />
case study<br />
Modeled indoor dust Pb levels (ppm)<br />
Air quality<br />
scenario Median<br />
Current<br />
NAAQS<br />
Current<br />
conditions<br />
5 th to 95 th<br />
Percentile<br />
(min-max)<br />
122 50 - 2,318<br />
(41 - 3,523)<br />
63<br />
60 – 73<br />
(60 – 166)<br />
Indoor Dust Pb Observations reported in<br />
the literature<br />
- Residences near smelters: 1283-4140 ppm<br />
(CD, Table 3-8)<br />
- Jersey City, NJ housing (floor): 857 ppm<br />
(CD, Table 3-8)<br />
- Residences in the Midwest (windowsill):<br />
954ppm (CD, Table 3-8)<br />
- Ottawa Canada housing (floor): 222 ppm<br />
(median), 406 ppm (mean) (Tang et al., 2004)<br />
- HUD survey of US housing: 87 ppm (median<br />
<strong>for</strong> newest houses, built 1960-1979), 406<br />
ppm (median <strong>for</strong> oldest housing, build


