Lead Human Exposure and Health Risk Assessments for Selected ...
Lead Human Exposure and Health Risk Assessments for Selected ...
Lead Human Exposure and Health Risk Assessments for Selected ...

You also want an ePaper? Increase the reach of your titles
YUMPU automatically turns print PDFs into web optimized ePapers that Google loves.
1<br />
2<br />
3<br />
4<br />
5<br />
6<br />
7<br />
8<br />
9<br />
10<br />
11<br />
12<br />
13<br />
14<br />
15<br />
16<br />
17<br />
18<br />
19<br />
20<br />
21<br />
22<br />
23<br />
24<br />
25<br />
26<br />
27<br />
28<br />
29<br />
30<br />
31<br />
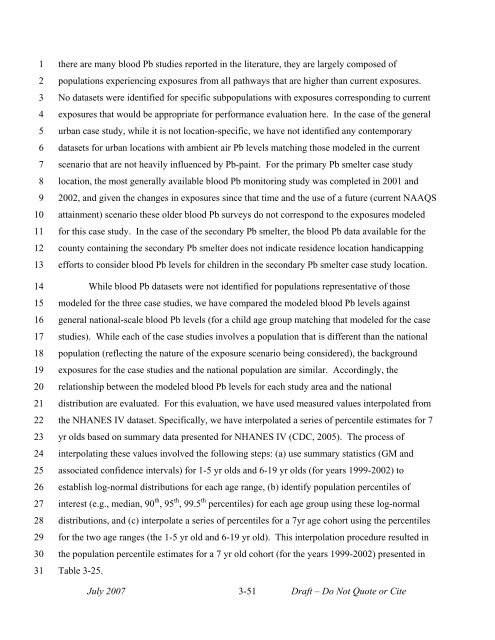
there are many blood Pb studies reported in the literature, they are largely composed of<br />
populations experiencing exposures from all pathways that are higher than current exposures.<br />
No datasets were identified <strong>for</strong> specific subpopulations with exposures corresponding to current<br />
exposures that would be appropriate <strong>for</strong> per<strong>for</strong>mance evaluation here. In the case of the general<br />
urban case study, while it is not location-specific, we have not identified any contemporary<br />
datasets <strong>for</strong> urban locations with ambient air Pb levels matching those modeled in the current<br />
scenario that are not heavily influenced by Pb-paint. For the primary Pb smelter case study<br />
location, the most generally available blood Pb monitoring study was completed in 2001 <strong>and</strong><br />
2002, <strong>and</strong> given the changes in exposures since that time <strong>and</strong> the use of a future (current NAAQS<br />
attainment) scenario these older blood Pb surveys do not correspond to the exposures modeled<br />
<strong>for</strong> this case study. In the case of the secondary Pb smelter, the blood Pb data available <strong>for</strong> the<br />
county containing the secondary Pb smelter does not indicate residence location h<strong>and</strong>icapping<br />
ef<strong>for</strong>ts to consider blood Pb levels <strong>for</strong> children in the secondary Pb smelter case study location.<br />
While blood Pb datasets were not identified <strong>for</strong> populations representative of those<br />
modeled <strong>for</strong> the three case studies, we have compared the modeled blood Pb levels against<br />
general national-scale blood Pb levels (<strong>for</strong> a child age group matching that modeled <strong>for</strong> the case<br />
studies). While each of the case studies involves a population that is different than the national<br />
population (reflecting the nature of the exposure scenario being considered), the background<br />
exposures <strong>for</strong> the case studies <strong>and</strong> the national population are similar. Accordingly, the<br />
relationship between the modeled blood Pb levels <strong>for</strong> each study area <strong>and</strong> the national<br />
distribution are evaluated. For this evaluation, we have used measured values interpolated from<br />
the NHANES IV dataset. Specifically, we have interpolated a series of percentile estimates <strong>for</strong> 7<br />
yr olds based on summary data presented <strong>for</strong> NHANES IV (CDC, 2005). The process of<br />
interpolating these values involved the following steps: (a) use summary statistics (GM <strong>and</strong><br />
associated confidence intervals) <strong>for</strong> 1-5 yr olds <strong>and</strong> 6-19 yr olds (<strong>for</strong> years 1999-2002) to<br />
establish log-normal distributions <strong>for</strong> each age range, (b) identify population percentiles of<br />
interest (e.g., median, 90 th , 95 th , 99.5 th percentiles) <strong>for</strong> each age group using these log-normal<br />
distributions, <strong>and</strong> (c) interpolate a series of percentiles <strong>for</strong> a 7yr age cohort using the percentiles<br />
<strong>for</strong> the two age ranges (the 1-5 yr old <strong>and</strong> 6-19 yr old). This interpolation procedure resulted in<br />
the population percentile estimates <strong>for</strong> a 7 yr old cohort (<strong>for</strong> the years 1999-2002) presented in<br />
Table 3-25.<br />
July 2007 3-51 Draft – Do Not Quote or Cite