Lead Human Exposure and Health Risk Assessments for Selected ...
Lead Human Exposure and Health Risk Assessments for Selected ...
Lead Human Exposure and Health Risk Assessments for Selected ...
Create successful ePaper yourself
Turn your PDF publications into a flip-book with our unique Google optimized e-Paper software.
1<br />
2<br />
3<br />
4<br />
5<br />
6<br />
7<br />
8<br />
9<br />
10<br />
11<br />
12<br />
13<br />
14<br />
15<br />
16<br />
17<br />
18<br />
19<br />
20<br />
21<br />
22<br />
23<br />
24<br />
25<br />
26<br />
27<br />
28<br />
29<br />
30<br />
31<br />
32<br />
33<br />
34<br />
35<br />
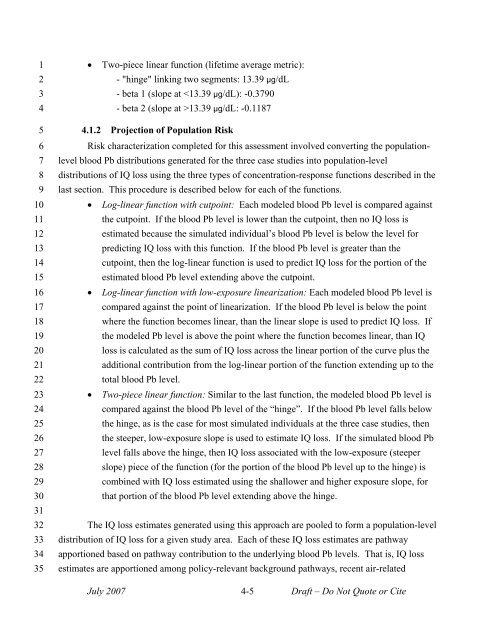
• Two-piece linear function (lifetime average metric):<br />
- "hinge" linking two segments: 13.39 µg/dL<br />
- beta 1 (slope at 13.39 µg/dL: -0.1187<br />
4.1.2 Projection of Population <strong>Risk</strong><br />
<strong>Risk</strong> characterization completed <strong>for</strong> this assessment involved converting the populationlevel<br />
blood Pb distributions generated <strong>for</strong> the three case studies into population-level<br />
distributions of IQ loss using the three types of concentration-response functions described in the<br />
last section. This procedure is described below <strong>for</strong> each of the functions.<br />
• Log-linear function with cutpoint: Each modeled blood Pb level is compared against<br />
the cutpoint. If the blood Pb level is lower than the cutpoint, then no IQ loss is<br />
estimated because the simulated individual’s blood Pb level is below the level <strong>for</strong><br />
predicting IQ loss with this function. If the blood Pb level is greater than the<br />
cutpoint, then the log-linear function is used to predict IQ loss <strong>for</strong> the portion of the<br />
estimated blood Pb level extending above the cutpoint.<br />
• Log-linear function with low-exposure linearization: Each modeled blood Pb level is<br />
compared against the point of linearization. If the blood Pb level is below the point<br />
where the function becomes linear, than the linear slope is used to predict IQ loss. If<br />
the modeled Pb level is above the point where the function becomes linear, than IQ<br />
loss is calculated as the sum of IQ loss across the linear portion of the curve plus the<br />
additional contribution from the log-linear portion of the function extending up to the<br />
total blood Pb level.<br />
• Two-piece linear function: Similar to the last function, the modeled blood Pb level is<br />
compared against the blood Pb level of the “hinge”. If the blood Pb level falls below<br />
the hinge, as is the case <strong>for</strong> most simulated individuals at the three case studies, then<br />
the steeper, low-exposure slope is used to estimate IQ loss. If the simulated blood Pb<br />
level falls above the hinge, then IQ loss associated with the low-exposure (steeper<br />
slope) piece of the function (<strong>for</strong> the portion of the blood Pb level up to the hinge) is<br />
combined with IQ loss estimated using the shallower <strong>and</strong> higher exposure slope, <strong>for</strong><br />
that portion of the blood Pb level extending above the hinge.<br />
The IQ loss estimates generated using this approach are pooled to <strong>for</strong>m a population-level<br />
distribution of IQ loss <strong>for</strong> a given study area. Each of these IQ loss estimates are pathway<br />
apportioned based on pathway contribution to the underlying blood Pb levels. That is, IQ loss<br />
estimates are apportioned among policy-relevant background pathways, recent air-related<br />
July 2007 4-5 Draft – Do Not Quote or Cite


