LICENTIATE THESIS - Luleå tekniska universitet
LICENTIATE THESIS - Luleå tekniska universitet
LICENTIATE THESIS - Luleå tekniska universitet

You also want an ePaper? Increase the reach of your titles
YUMPU automatically turns print PDFs into web optimized ePapers that Google loves.
Tensile strength [MPa]<br />
5<br />
4<br />
3<br />
2<br />
1<br />
0<br />
0 2 4 6 8<br />
Strain [‰]<br />
- 9 -<br />
Normailzed stress<br />
1<br />
0.8<br />
0.6<br />
0.4<br />
0.2<br />
0<br />
0 2 4 6 8<br />
Strain [‰]<br />
(a) (b)<br />
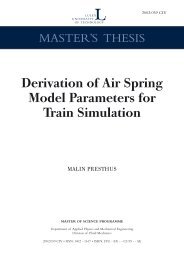
Figure 8 Results of the uniaxial tensile tests for series B. (a) Curves showing the<br />
strains of the COD-gauges that were exposed to the highest strain during each<br />
test. (b) The same curves as in (a) but with normalized stress in order to get a<br />
mean curve for the whole test series. The curve that has (+) is the mean curve<br />
used in Figure 10.<br />
Fatigue test<br />
In Figure 9 to Figure 13 some typical results from the fatigue tests are presented.<br />
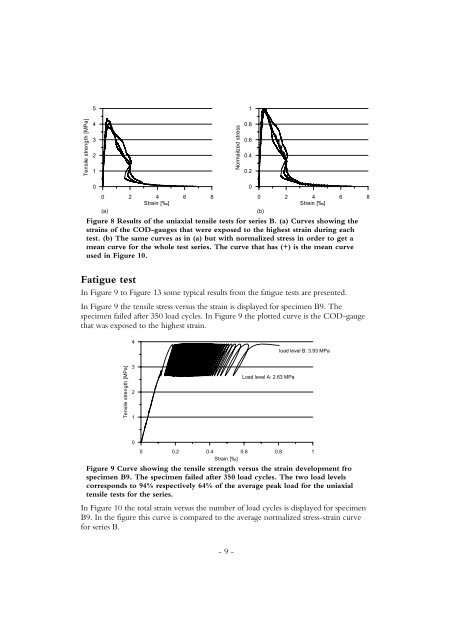
In Figure 9 the tensile stress versus the strain is displayed for specimen B9. The<br />
specimen failed after 350 load cycles. In Figure 9 the plotted curve is the COD-gauge<br />
that was exposed to the highest strain.<br />
Tensile strength [MPa]<br />
4<br />
3<br />
2<br />
1<br />
0<br />
Load level A: 2.63 MPa<br />
load level B: 3.93 MPa<br />
0 0.2 0.4 0.6 0.8 1<br />
Strain [‰]<br />
Figure 9 Curve showing the tensile strength versus the strain development fro<br />
specimen B9. The specimen failed after 350 load cycles. The two load levels<br />
corresponds to 94% respectively 64% of the average peak load for the uniaxial<br />
tensile tests for the series.<br />
In Figure 10 the total strain versus the number of load cycles is displayed for specimen<br />
B9. In the figure this curve is compared to the average normalized stress-strain curve<br />
for series B.