LICENTIATE THESIS - Luleå tekniska universitet
LICENTIATE THESIS - Luleå tekniska universitet
LICENTIATE THESIS - Luleå tekniska universitet

Create successful ePaper yourself
Turn your PDF publications into a flip-book with our unique Google optimized e-Paper software.
Sleeper No. 17 looks more like the yellow sleepers because only the ends had a lot of<br />
cracks. Sleeper No. 16 looks more like sleeper No. 7 due to the fact that it has long<br />
horizontal cracks. As mentioned above it does not have the vertical crack at the<br />
fastener.<br />
For sleepers No. 5, 7-16a and 17 the tests have been performed according to Figure 21,<br />
i.e. with a steel pad between the end of the sleeper and the vertical girder. For sleeper<br />
No. 16b and 18 the steel pad was removed to be able to see the influence of this steel<br />
pad. In Figure 20 it is shown that for a sleeper of class 2 or 3 (compare with sleeper<br />
No. 18) it does not influence the test. For a sleeper that is in class 1 (red sleepers) that<br />
have severe cracking the steel pad may influence the test, compare No. 16a and 16b.<br />
Steel pad Vertical girder<br />
Figure 21 Test set-up. Illustration showing the steel pad used in the tests.<br />
Material properties<br />
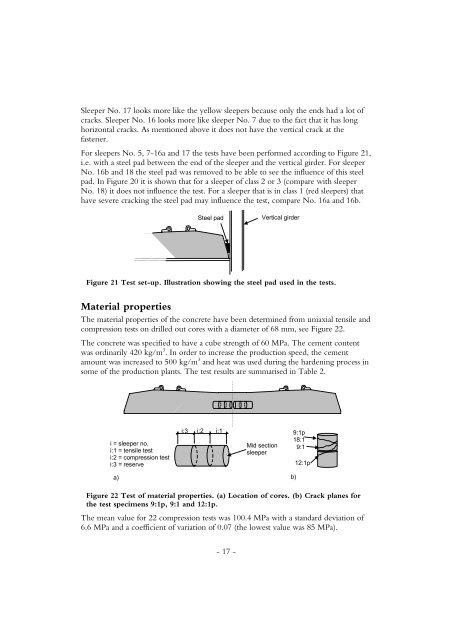
The material properties of the concrete have been determined from uniaxial tensile and<br />
compression tests on drilled out cores with a diameter of 68 mm, see Figure 22.<br />
The concrete was specified to have a cube strength of 60 MPa. The cement content<br />
was ordinarily 420 kg/m 3 . In order to increase the production speed, the cement<br />
amount was increased to 500 kg/m 3 and heat was used during the hardening process in<br />
some of the production plants. The test results are summarised in Table 2.<br />
i = sleeper no.<br />
i:1 = tensile test<br />
i:2 = compression test<br />
i:3 = reserve<br />
a)<br />
i:3<br />
i:2<br />
i:1<br />
- 17 -<br />
Mid section<br />
sleeper<br />
9:1p<br />
18:1<br />
9:1<br />
b)<br />
12:1p<br />
Figure 22 Test of material properties. (a) Location of cores. (b) Crack planes for<br />
the test specimens 9:1p, 9:1 and 12:1p.<br />
The mean value for 22 compression tests was 100.4 MPa with a standard deviation of<br />
6.6 MPa and a coefficient of variation of 0.07 (the lowest value was 85 MPa).