SOCIOLOGY EDUCATION - American Sociological Association
SOCIOLOGY EDUCATION - American Sociological Association
SOCIOLOGY EDUCATION - American Sociological Association

You also want an ePaper? Increase the reach of your titles
YUMPU automatically turns print PDFs into web optimized ePapers that Google loves.
Another Way Out 377<br />
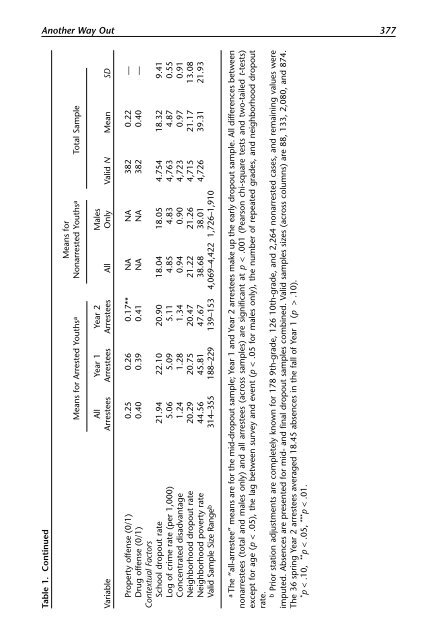
Table 1. Continued<br />
Means for<br />
Means for Arrested Youthsa Nonarrested Youthsa Total Sample<br />
All Year 1 Year 2 Males<br />
Variable Arrestees Arrestees Arrestees All Only Valid N Mean SD<br />
Property offense (0/1) 0.25 0.26 0.17** NA NA 382 0.22 —<br />
Drug offense (0/1) 0.40 0.39 0.41 NA NA 382 0.40 —<br />
Contextual Factors<br />
School dropout rate 21.94 22.10 20.90 18.04 18.05 4.754 18.32 9.41<br />
Log of crime rate (per 1,000) 5.06 5.09 5.11 4.85 4.83 4,763 4.87 0.55<br />
Concentrated disadvantage 1.24 1.28 1.34 0.94 0.90 4,723 0.97 0.91<br />
Neighborhood dropout rate 20.29 20.75 20.47 21.22 21.26 4,715 21.17 13.08<br />
Neighborhood poverty rate 44.56 45.81 47.67 38.68 38.01 4,726 39.31 21.93<br />
Valid Sample Size Rangeb 314–355 188–229 139–153 4,069–4,422 1,726–1,910<br />
a The “all-arrestee” means are for the mid-dropout sample; Year 1 and Year 2 arrestees make up the early dropout sample. All differences between<br />
nonarrestees (total and males only) and all arrestees (across samples) are significant at p < .001 (Pearson chi-square tests and two-tailed t-tests)<br />
except for age (p < .05), the lag between survey and event (p < .05 for males only), the number of repeated grades, and neighborhood dropout<br />
rate.<br />
b Prior station adjustments are completely known for 178 9th-grade, 126 10th-grade, and 2,264 nonarrested cases, and remaining values were<br />
imputed. Absences are presented for mid- and final dropout samples combined. Valid samples sizes (across columns) are 88, 133, 2,080, and 874.<br />
The 36 spring Year 2 arrestees averaged 18.45 absences in the fall of Year 1 (p > .10).<br />
*p < .10, **p < .05, ***p < .01.