SOCIOLOGY EDUCATION - American Sociological Association
SOCIOLOGY EDUCATION - American Sociological Association
SOCIOLOGY EDUCATION - American Sociological Association

You also want an ePaper? Increase the reach of your titles
YUMPU automatically turns print PDFs into web optimized ePapers that Google loves.
Another Way Out 385<br />
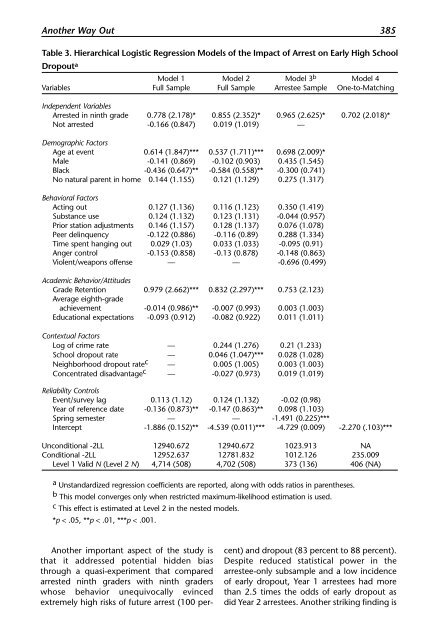
Table 3. Hierarchical Logistic Regression Models of the Impact of Arrest on Early High School<br />
Dropout a<br />
Model 1 Model 2 Model 3 b Model 4<br />
Variables Full Sample Full Sample Arrestee Sample One-to-Matching<br />
Independent Variables<br />
Arrested in ninth grade 0.778 (2.178)* 0.855 (2.352)* 0.965 (2.625)* 0.702 (2.018)*<br />
Not arrested -0.166 (0.847) 0.019 (1.019) —<br />
Demographic Factors<br />
Age at event 0.614 (1.847)*** 0.537 (1.711)*** 0.698 (2.009)*<br />
Male -0.141 (0.869) -0.102 (0.903) 0.435 (1.545)<br />
Black -0.436 (0.647)** -0.584 (0.558)** -0.300 (0.741)<br />
No natural parent in home 0.144 (1.155) 0.121 (1.129) 0.275 (1.317)<br />
Behavioral Factors<br />
Acting out 0.127 (1.136) 0.116 (1.123) 0.350 (1.419)<br />
Substance use 0.124 (1.132) 0.123 (1.131) -0.044 (0.957)<br />
Prior station adjustments 0.146 (1.157) 0.128 (1.137) 0.076 (1.078)<br />
Peer delinquency -0.122 (0.886) -0.116 (0.89) 0.288 (1.334)<br />
Time spent hanging out 0.029 (1.03) 0.033 (1.033) -0.095 (0.91)<br />
Anger control -0.153 (0.858) -0.13 (0.878) -0.148 (0.863)<br />
Violent/weapons offense — — -0.696 (0.499)<br />
Academic Behavior/Attitudes<br />
Grade Retention 0.979 (2.662)*** 0.832 (2.297)*** 0.753 (2.123)<br />
Average eighth-grade<br />
achievement -0.014 (0.986)** -0.007 (0.993) 0.003 (1.003)<br />
Educational expectations -0.093 (0.912) -0.082 (0.922) 0.011 (1.011)<br />
Contextual Factors<br />
Log of crime rate — 0.244 (1.276) 0.21 (1.233)<br />
School dropout rate — 0.046 (1.047)*** 0.028 (1.028)<br />
Neighborhood dropout rate c — 0.005 (1.005) 0.003 (1.003)<br />
Concentrated disadvantage c — -0.027 (0.973) 0.019 (1.019)<br />
Reliability Controls<br />
Event/survey lag 0.113 (1.12) 0.124 (1.132) -0.02 (0.98)<br />
Year of reference date -0.136 (0.873)** -0.147 (0.863)** 0.098 (1.103)<br />
Spring semester — — -1.491 (0.225)***<br />
Intercept -1.886 (0.152)** -4.539 (0.011)*** -4.729 (0.009) -2.270 (.103)***<br />
Unconditional -2LL 12940.672 12940.672 1023.913 NA<br />
Conditional -2LL 12952.637 12781.832 1012.126 235.009<br />
Level 1 Valid N (Level 2 N) 4,714 (508) 4,702 (508) 373 (136) 406 (NA)<br />
a Unstandardized regression coefficients are reported, along with odds ratios in parentheses.<br />
b This model converges only when restricted maximum-likelihood estimation is used.<br />
c This effect is estimated at Level 2 in the nested models.<br />
*p < .05, **p < .01, ***p < .001.<br />
Another important aspect of the study is<br />
that it addressed potential hidden bias<br />
through a quasi-experiment that compared<br />
arrested ninth graders with ninth graders<br />
whose behavior unequivocally evinced<br />
extremely high risks of future arrest (100 per-<br />
cent) and dropout (83 percent to 88 percent).<br />
Despite reduced statistical power in the<br />
arrestee-only subsample and a low incidence<br />
of early dropout, Year 1 arrestees had more<br />
than 2.5 times the odds of early dropout as<br />
did Year 2 arrestees. Another striking finding is