

329-2012: Dynamically Evolving Systems: Cluster Analysis ... - SAS
329-2012: Dynamically Evolving Systems: Cluster Analysis ... - SAS
329-2012: Dynamically Evolving Systems: Cluster Analysis ... - SAS

You also want an ePaper? Increase the reach of your titles
YUMPU automatically turns print PDFs into web optimized ePapers that Google loves.
<strong>SAS</strong> Global Forum <strong>2012</strong><br />
proc sort data=work.doe2;<br />
by week;<br />
run;<br />
proc means data=work.doe2 noprint;<br />
by week;<br />
var annualized_price_index weekly_pct_change supply supply_pct_change;<br />
output out=work.doe_week;<br />
run;<br />
data work.doe_week;<br />
set work.doe_week;<br />
by week;<br />
if _stat_ = 'mean';<br />
keep week annualized_price_index weekly_pct_change supply supply_pct_change;<br />
run;<br />
proc standard data=work.doe_week mean=0 std=1 out=work.doe_stan;<br />
var week annualized_price_index weekly_pct_change supply supply_pct_change;<br />
run;<br />
proc fastclus data=work.doe_stan maxc=6 maxiter=20 out=work.cluster1;<br />
var week annualized_price_index weekly_pct_change supply supply_pct_change;<br />
run;<br />
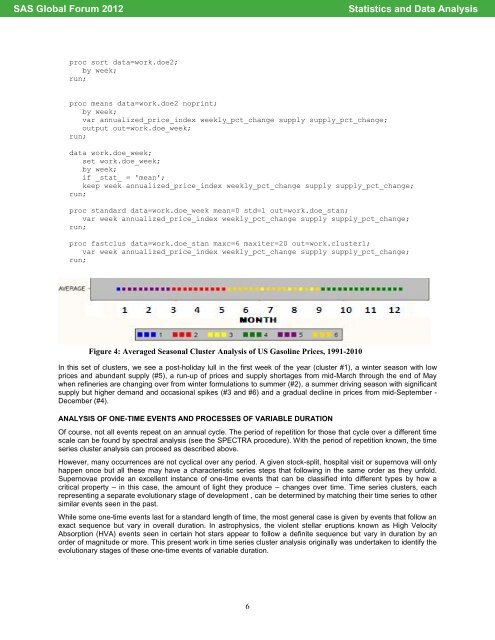
Figure 4: Averaged Seasonal <strong>Cluster</strong> <strong>Analysis</strong> of US Gasoline Prices, 1991-2010<br />
In this set of clusters, we see a post-holiday lull in the first week of the year (cluster #1), a winter season with low<br />
prices and abundant supply (#5), a run-up of prices and supply shortages from mid-March through the end of May<br />
when refineries are changing over from winter formulations to summer (#2), a summer driving season with significant<br />
supply but higher demand and occasional spikes (#3 and #6) and a gradual decline in prices from mid-September -<br />
December (#4).<br />
ANALYSIS OF ONE-TIME EVENTS AND PROCESSES OF VARIABLE DURATION<br />
Of course, not all events repeat on an annual cycle. The period of repetition for those that cycle over a different time<br />
scale can be found by spectral analysis (see the SPECTRA procedure). With the period of repetition known, the time<br />
series cluster analysis can proceed as described above.<br />
However, many occurrences are not cyclical over any period. A given stock-split, hospital visit or supernova will only<br />
happen once but all these may have a characteristic series steps that following in the same order as they unfold.<br />
Supernovae provide an excellent instance of one-time events that can be classified into different types by how a<br />
critical property – in this case, the amount of light they produce – changes over time. Time series clusters, each<br />
representing a separate evolutionary stage of development , can be determined by matching their time series to other<br />
similar events seen in the past.<br />
While some one-time events last for a standard length of time, the most general case is given by events that follow an<br />
exact sequence but vary in overall duration. In astrophysics, the violent stellar eruptions known as High Velocity<br />
Absorption (HVA) events seen in certain hot stars appear to follow a definite sequence but vary in duration by an<br />
order of magnitude or more. This present work in time series cluster analysis originally was undertaken to identify the<br />
evolutionary stages of these one-time events of variable duration.<br />
6<br />
Statistics and Data <strong>Analysis</strong>


