

329-2012: Dynamically Evolving Systems: Cluster Analysis ... - SAS
329-2012: Dynamically Evolving Systems: Cluster Analysis ... - SAS
329-2012: Dynamically Evolving Systems: Cluster Analysis ... - SAS

Create successful ePaper yourself
Turn your PDF publications into a flip-book with our unique Google optimized e-Paper software.
<strong>SAS</strong> Global Forum <strong>2012</strong><br />
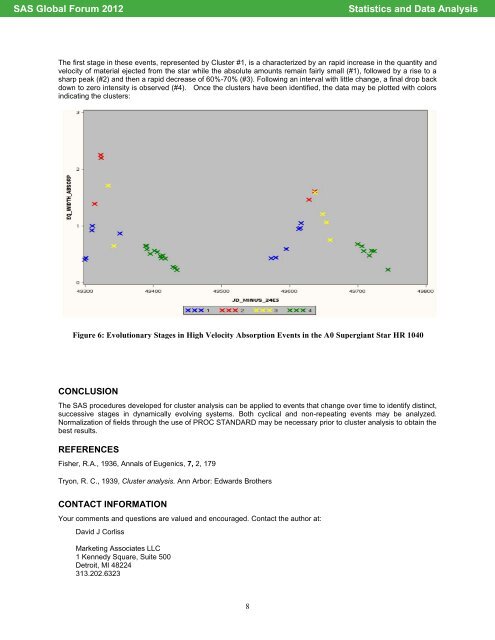
The first stage in these events, represented by <strong>Cluster</strong> #1, is a characterized by an rapid increase in the quantity and<br />
velocity of material ejected from the star while the absolute amounts remain fairly small (#1), followed by a rise to a<br />
sharp peak (#2) and then a rapid decrease of 60%-70% (#3). Following an interval with little change, a final drop back<br />
down to zero intensity is observed (#4). Once the clusters have been identified, the data may be plotted with colors<br />
indicating the clusters:<br />
Figure 6: Evolutionary Stages in High Velocity Absorption Events in the A0 Supergiant Star HR 1040<br />
CONCLUSION<br />
The <strong>SAS</strong> procedures developed for cluster analysis can be applied to events that change over time to identify distinct,<br />
successive stages in dynamically evolving systems. Both cyclical and non-repeating events may be analyzed.<br />
Normalization of fields through the use of PROC STANDARD may be necessary prior to cluster analysis to obtain the<br />
best results.<br />
REFERENCES<br />
Fisher, R.A., 1936, Annals of Eugenics, 7, 2, 179<br />
Tryon, R. C., 1939, <strong>Cluster</strong> analysis. Ann Arbor: Edwards Brothers<br />
CONTACT INFORMATION<br />
Your comments and questions are valued and encouraged. Contact the author at:<br />
David J Corliss<br />
Marketing Associates LLC<br />
1 Kennedy Square, Suite 500<br />
Detroit, MI 48224<br />
313.202.6323<br />
8<br />
Statistics and Data <strong>Analysis</strong>


