

423-2013: Computing Direct and Indirect Standardized Rates ... - SAS
423-2013: Computing Direct and Indirect Standardized Rates ... - SAS
423-2013: Computing Direct and Indirect Standardized Rates ... - SAS

You also want an ePaper? Increase the reach of your titles
YUMPU automatically turns print PDFs into web optimized ePapers that Google loves.
<strong>SAS</strong> Global Forum <strong>2013</strong><br />
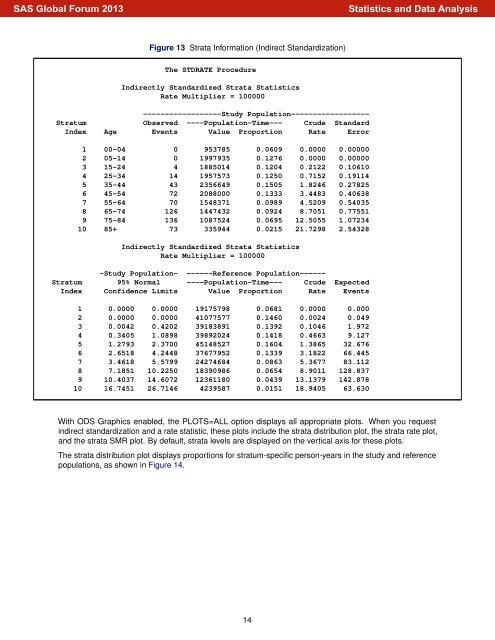
Figure 13 Strata Information (<strong>Indirect</strong> St<strong>and</strong>ardization)<br />
The STDRATE Procedure<br />
<strong>Indirect</strong>ly St<strong>and</strong>ardized Strata Statistics<br />
Rate Multiplier = 100000<br />
------------------Study Population------------------<br />
Stratum Observed ----Population-Time--- Crude St<strong>and</strong>ard<br />
Index Age Events Value Proportion Rate Error<br />
1 00-04 0 953785 0.0609 0.0000 0.00000<br />
2 05-14 0 1997935 0.1276 0.0000 0.00000<br />
3 15-24 4 1885014 0.1204 0.2122 0.10610<br />
4 25-34 14 1957573 0.1250 0.7152 0.19114<br />
5 35-44 43 2356649 0.1505 1.8246 0.27825<br />
6 45-54 72 2088000 0.1333 3.4483 0.40638<br />
7 55-64 70 1548371 0.0989 4.5209 0.54035<br />
8 65-74 126 1447432 0.0924 8.7051 0.77551<br />
9 75-84 136 1087524 0.0695 12.5055 1.07234<br />
10 85+ 73 335944 0.0215 21.7298 2.54328<br />
<strong>Indirect</strong>ly St<strong>and</strong>ardized Strata Statistics<br />
Rate Multiplier = 100000<br />
-Study Population- ------Reference Population------<br />
Stratum 95% Normal ----Population-Time--- Crude Expected<br />
Index Confidence Limits Value Proportion Rate Events<br />
1 0.0000 0.0000 19175798 0.0681 0.0000 0.000<br />
2 0.0000 0.0000 41077577 0.1460 0.0024 0.049<br />
3 0.0042 0.4202 39183891 0.1392 0.1046 1.972<br />
4 0.3405 1.0898 39892024 0.1418 0.4663 9.127<br />
5 1.2793 2.3700 45148527 0.1604 1.3865 32.676<br />
6 2.6518 4.2448 37677952 0.1339 3.1822 66.445<br />
7 3.4618 5.5799 24274684 0.0863 5.3677 83.112<br />
8 7.1851 10.2250 18390986 0.0654 8.9011 128.837<br />
9 10.4037 14.6072 12361180 0.0439 13.1379 142.878<br />
10 16.7451 26.7146 <strong>423</strong>9587 0.0151 18.9405 63.630<br />
With ODS Graphics enabled, the PLOTS=ALL option displays all appropriate plots. When you request<br />
indirect st<strong>and</strong>ardization <strong>and</strong> a rate statistic, these plots include the strata distribution plot, the strata rate plot,<br />
<strong>and</strong> the strata SMR plot. By default, strata levels are displayed on the vertical axis for these plots.<br />
The strata distribution plot displays proportions for stratum-specific person-years in the study <strong>and</strong> reference<br />
populations, as shown in Figure 14.<br />
14<br />
Statistics <strong>and</strong> Data Analysis


