

423-2013: Computing Direct and Indirect Standardized Rates ... - SAS
423-2013: Computing Direct and Indirect Standardized Rates ... - SAS
423-2013: Computing Direct and Indirect Standardized Rates ... - SAS

Create successful ePaper yourself
Turn your PDF publications into a flip-book with our unique Google optimized e-Paper software.
<strong>SAS</strong> Global Forum <strong>2013</strong><br />
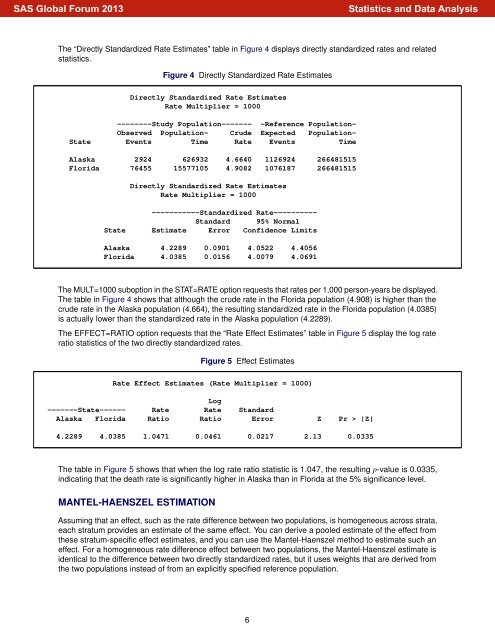
The “<strong>Direct</strong>ly St<strong>and</strong>ardized Rate Estimates” table in Figure 4 displays directly st<strong>and</strong>ardized rates <strong>and</strong> related<br />
statistics.<br />
Figure 4 <strong>Direct</strong>ly St<strong>and</strong>ardized Rate Estimates<br />
<strong>Direct</strong>ly St<strong>and</strong>ardized Rate Estimates<br />
Rate Multiplier = 1000<br />
--------Study Population------- -Reference Population-<br />
Observed Population- Crude Expected Population-<br />
State Events Time Rate Events Time<br />
Alaska 2924 626932 4.6640 1126924 266481515<br />
Florida 76455 15577105 4.9082 1076187 266481515<br />
<strong>Direct</strong>ly St<strong>and</strong>ardized Rate Estimates<br />
Rate Multiplier = 1000<br />
-----------St<strong>and</strong>ardized Rate----------<br />
St<strong>and</strong>ard 95% Normal<br />
State Estimate Error Confidence Limits<br />
Alaska 4.2289 0.0901 4.0522 4.4056<br />
Florida 4.0385 0.0156 4.0079 4.0691<br />
The MULT=1000 suboption in the STAT=RATE option requests that rates per 1,000 person-years be displayed.<br />
The table in Figure 4 shows that although the crude rate in the Florida population (4.908) is higher than the<br />
crude rate in the Alaska population (4.664), the resulting st<strong>and</strong>ardized rate in the Florida population (4.0385)<br />
is actually lower than the st<strong>and</strong>ardized rate in the Alaska population (4.2289).<br />
The EFFECT=RATIO option requests that the “Rate Effect Estimates” table in Figure 5 display the log rate<br />
ratio statistics of the two directly st<strong>and</strong>ardized rates.<br />
Figure 5 Effect Estimates<br />
Rate Effect Estimates (Rate Multiplier = 1000)<br />
Log<br />
-------State------ Rate Rate St<strong>and</strong>ard<br />
Alaska Florida Ratio Ratio Error Z Pr > |Z|<br />
4.2289 4.0385 1.0471 0.0461 0.0217 2.13 0.0335<br />
The table in Figure 5 shows that when the log rate ratio statistic is 1.047, the resulting p-value is 0.0335,<br />
indicating that the death rate is significantly higher in Alaska than in Florida at the 5% significance level.<br />
MANTEL-HAENSZEL ESTIMATION<br />
Assuming that an effect, such as the rate difference between two populations, is homogeneous across strata,<br />
each stratum provides an estimate of the same effect. You can derive a pooled estimate of the effect from<br />
these stratum-specific effect estimates, <strong>and</strong> you can use the Mantel-Haenszel method to estimate such an<br />
effect. For a homogeneous rate difference effect between two populations, the Mantel-Haenszel estimate is<br />
identical to the difference between two directly st<strong>and</strong>ardized rates, but it uses weights that are derived from<br />
the two populations instead of from an explicitly specified reference population.<br />
6<br />
Statistics <strong>and</strong> Data Analysis


