

423-2013: Computing Direct and Indirect Standardized Rates ... - SAS
423-2013: Computing Direct and Indirect Standardized Rates ... - SAS
423-2013: Computing Direct and Indirect Standardized Rates ... - SAS

You also want an ePaper? Increase the reach of your titles
YUMPU automatically turns print PDFs into web optimized ePapers that Google loves.
<strong>SAS</strong> Global Forum <strong>2013</strong><br />
The METHOD=MH option requests the Mantel-Haenszel estimation, <strong>and</strong> the STAT=RISK option specifies<br />
the risk statistic for st<strong>and</strong>ardization. When you specify the EFFECT=DIFF option, PROC STDRATE uses the<br />
default risk difference statistics to compute the risk effect between the study populations.<br />
The POPULATION statement specifies the options that are related to the study populations. The EVENT=<br />
option specifies the variable for the number of cases, the TOTAL= option specifies the number of students,<br />
<strong>and</strong> the GROUP=SMOKING option specifies the variable Smoking, which identifies the smoking groups in<br />
the DATA= data set.<br />
The STRATA statement names the variables, Pet <strong>and</strong> Grade, that form the strata in the st<strong>and</strong>ardization. The<br />
ORDER=DATA option sorts the strata by order of their appearance in the input data set, <strong>and</strong> the EFFECT<br />
option displays the strata effects.<br />
The “St<strong>and</strong>ardization Information” table in Figure 6 displays the st<strong>and</strong>ardization information.<br />
Figure 6 St<strong>and</strong>ardization Information<br />
The STDRATE Procedure<br />
St<strong>and</strong>ardization Information<br />
Data Set WORK.SCHOOL<br />
Group Variable Smoking<br />
Method Mantel-Haenszel<br />
Statistic Risk<br />
Number of Strata 6<br />
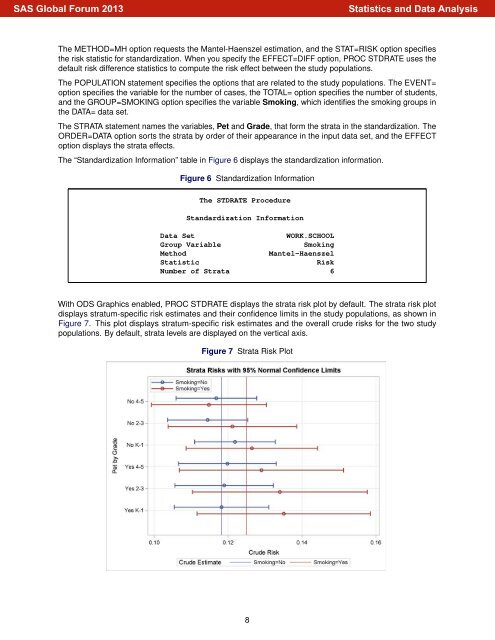
With ODS Graphics enabled, PROC STDRATE displays the strata risk plot by default. The strata risk plot<br />
displays stratum-specific risk estimates <strong>and</strong> their confidence limits in the study populations, as shown in<br />
Figure 7. This plot displays stratum-specific risk estimates <strong>and</strong> the overall crude risks for the two study<br />
populations. By default, strata levels are displayed on the vertical axis.<br />
Figure 7 Strata Risk Plot<br />
8<br />
Statistics <strong>and</strong> Data Analysis


