

Design, Monitoring, and Evaluation – Capacity Assessment
Design, Monitoring, and Evaluation – Capacity Assessment
Design, Monitoring, and Evaluation – Capacity Assessment

Create successful ePaper yourself
Turn your PDF publications into a flip-book with our unique Google optimized e-Paper software.
4.5<br />
4<br />
3.5<br />
3<br />
2.5<br />
2<br />
1.5<br />
1<br />
0.5<br />
0<br />
Bolivia<br />
Haiti<br />
Nicaragua<br />
Peru<br />
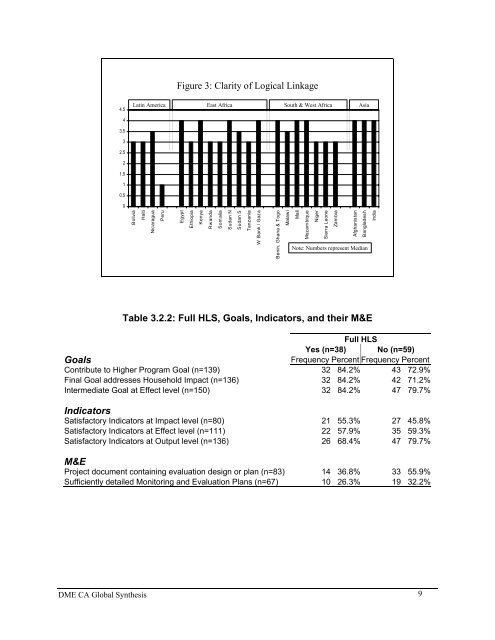
Figure 3: Clarity of Logical Linkage<br />
Latin America East Africa South & West Africa Asia<br />
Egypt<br />
Ethiopia<br />
Kenya<br />
Rw<strong>and</strong>a<br />
Somalia<br />
Sudan N<br />
Sudan S<br />
Tanzania<br />
W Bank / Gaza<br />
Benin, Ghana & Togo<br />
Malawi<br />
Mali<br />
Mozam bique<br />
Niger<br />
Sierra Leone<br />
Zam bia<br />
Afghanistan<br />
Bangladesh<br />
Note: Numbers represent Median<br />
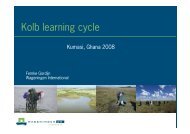
Table 3.2.2: Full HLS, Goals, Indicators, <strong>and</strong> their M&E<br />
Full HLS<br />
Yes (n=38) No (n=59)<br />
Goals Frequency Percent Frequency Percent<br />
Contribute to Higher Program Goal (n=139) 32 84.2% 43 72.9%<br />
Final Goal addresses Household Impact (n=136) 32 84.2% 42 71.2%<br />
Intermediate Goal at Effect level (n=150) 32 84.2% 47 79.7%<br />
Indicators<br />
Satisfactory Indicators at Impact level (n=80) 21 55.3% 27 45.8%<br />
Satisfactory Indicators at Effect level (n=111) 22 57.9% 35 59.3%<br />
Satisfactory Indicators at Output level (n=136) 26 68.4% 47 79.7%<br />
M&E<br />
Project document containing evaluation design or plan (n=83) 14 36.8% 33 55.9%<br />
Sufficiently detailed <strong>Monitoring</strong> <strong>and</strong> <strong>Evaluation</strong> Plans (n=67) 10 26.3% 19 32.2%<br />
DME CA Global Synthesis 9<br />
India


![CynefinFramework final [Read-Only]](https://img.yumpu.com/19017304/1/190x135/cynefinframework-final-read-only.jpg?quality=85)