assessment of changes in the phosphorus status of forest ...
assessment of changes in the phosphorus status of forest ...
assessment of changes in the phosphorus status of forest ...

Create successful ePaper yourself
Turn your PDF publications into a flip-book with our unique Google optimized e-Paper software.
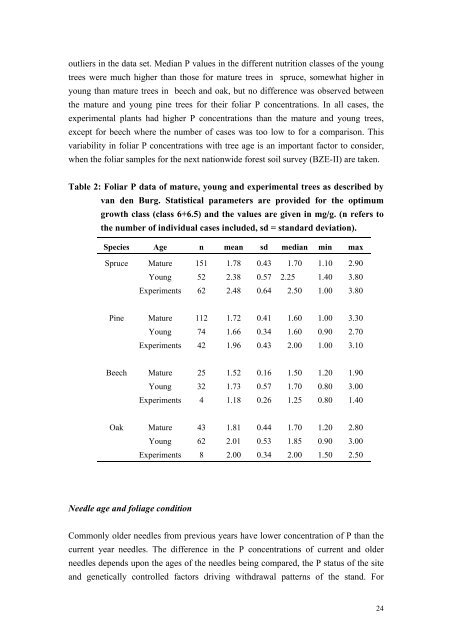
outliers <strong>in</strong> <strong>the</strong> data set. Median P values <strong>in</strong> <strong>the</strong> different nutrition classes <strong>of</strong> <strong>the</strong> young<br />
trees were much higher than those for mature trees <strong>in</strong> spruce, somewhat higher <strong>in</strong><br />
young than mature trees <strong>in</strong> beech and oak, but no difference was observed between<br />
<strong>the</strong> mature and young p<strong>in</strong>e trees for <strong>the</strong>ir foliar P concentrations. In all cases, <strong>the</strong><br />
experimental plants had higher P concentrations than <strong>the</strong> mature and young trees,<br />
except for beech where <strong>the</strong> number <strong>of</strong> cases was too low to for a comparison. This<br />
variability <strong>in</strong> foliar P concentrations with tree age is an important factor to consider,<br />
when <strong>the</strong> foliar samples for <strong>the</strong> next nationwide <strong>forest</strong> soil survey (BZE-II) are taken.<br />
Table 2: Foliar P data <strong>of</strong> mature, young and experimental trees as described by<br />
van den Burg. Statistical parameters are provided for <strong>the</strong> optimum<br />
growth class (class 6+6.5) and <strong>the</strong> values are given <strong>in</strong> mg/g. (n refers to<br />
<strong>the</strong> number <strong>of</strong> <strong>in</strong>dividual cases <strong>in</strong>cluded, sd = standard deviation).<br />
Species Age n mean sd median m<strong>in</strong> max<br />
Spruce Mature 151 1.78 0.43 1.70 1.10 2.90<br />
Young 52 2.38 0.57 2.25 1.40 3.80<br />
Experiments 62 2.48 0.64 2.50 1.00 3.80<br />
P<strong>in</strong>e Mature 112 1.72 0.41 1.60 1.00 3.30<br />
Young 74 1.66 0.34 1.60 0.90 2.70<br />
Experiments 42 1.96 0.43 2.00 1.00 3.10<br />
Beech Mature 25 1.52 0.16 1.50 1.20 1.90<br />
Young 32 1.73 0.57 1.70 0.80 3.00<br />
Experiments 4 1.18 0.26 1.25 0.80 1.40<br />
Oak Mature 43 1.81 0.44 1.70 1.20 2.80<br />
Young 62 2.01 0.53 1.85 0.90 3.00<br />
Experiments 8 2.00 0.34 2.00 1.50 2.50<br />
Needle age and foliage condition<br />
Commonly older needles from previous years have lower concentration <strong>of</strong> P than <strong>the</strong><br />
current year needles. The difference <strong>in</strong> <strong>the</strong> P concentrations <strong>of</strong> current and older<br />
needles depends upon <strong>the</strong> ages <strong>of</strong> <strong>the</strong> needles be<strong>in</strong>g compared, <strong>the</strong> P <strong>status</strong> <strong>of</strong> <strong>the</strong> site<br />
and genetically controlled factors driv<strong>in</strong>g withdrawal patterns <strong>of</strong> <strong>the</strong> stand. For<br />
24