A comparative discrete-dislocation/nonlocal crystal-plasticity
A comparative discrete-dislocation/nonlocal crystal-plasticity
A comparative discrete-dislocation/nonlocal crystal-plasticity

Create successful ePaper yourself
Turn your PDF publications into a flip-book with our unique Google optimized e-Paper software.
typeset2:/sco3/jobs1/ELSEVIER/msa/week.17/Pmsa15088y.001 Wed May 16 07:53:37 2001 Page Wed<br />
10<br />
D. Columbus, M. Grujicic / Materials Science and Engineering A000 (2001) 000–000<br />
K I/K I0=1.48, the crack extension is characterized by a<br />
high fracture resistance (i.e. K I/K I0 increases sharply<br />
with crack extension).<br />
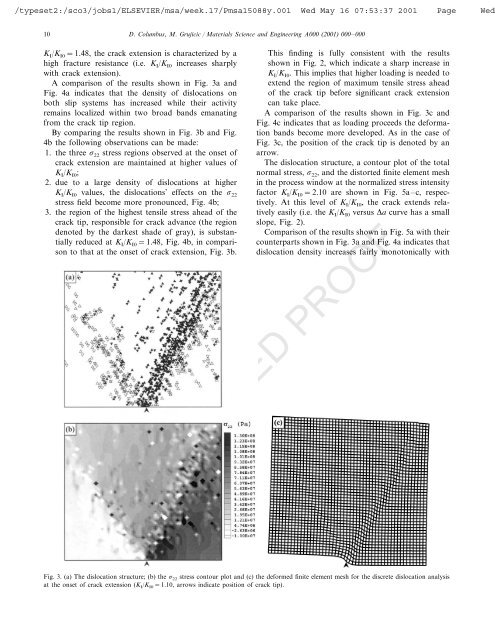
A comparison of the results shown in Fig. 3a and<br />
Fig. 4a indicates that the density of <strong>dislocation</strong>s on<br />
both slip systems has increased while their activity<br />
remains localized within two broad bands emanating<br />
from the crack tip region.<br />
By comparing the results shown in Fig. 3b and Fig.<br />
4b the following observations can be made:<br />
1. the three 22 stress regions observed at the onset of<br />
crack extension are maintained at higher values of<br />
K I/K I0;<br />
2. due to a large density of <strong>dislocation</strong>s at higher<br />
K I/K I0 values, the <strong>dislocation</strong>s’ effects on the 22<br />
stress field become more pronounced, Fig. 4b;<br />
3. the region of the highest tensile stress ahead of the<br />
crack tip, responsible for crack advance (the region<br />
denoted by the darkest shade of gray), is substantially<br />
reduced at K I/K I0=1.48, Fig. 4b, in comparison<br />
to that at the onset of crack extension, Fig. 3b.<br />
This finding is fully consistent with the results<br />
shown in Fig. 2, which indicate a sharp increase in<br />
K I/K I0. This implies that higher loading is needed to<br />
extend the region of maximum tensile stress ahead<br />
of the crack tip before significant crack extension<br />
can take place.<br />
A comparison of the results shown in Fig. 3c and<br />
Fig. 4c indicates that as loading proceeds the deformation<br />
bands become more developed. As in the case of<br />
Fig. 3c, the position of the crack tip is denoted by an<br />
arrow.<br />
The <strong>dislocation</strong> structure, a contour plot of the total<br />
normal stress, 22, and the distorted finite element mesh<br />
in the process window at the normalized stress intensity<br />
factor K I/K I0=2.10 are shown in Fig. 5a–c, respectively.<br />
At this level of K I/K I0, the crack extends relatively<br />
easily (i.e. the K I/K I0 versus a curve has a small<br />
slope, Fig. 2).<br />
Comparison of the results shown in Fig. 5a with their<br />
counterparts shown in Fig. 3a and Fig. 4a indicates that<br />
<strong>dislocation</strong> density increases fairly monotonically with<br />
UNCORRECTED PROOF<br />
Fig. 3. (a) The <strong>dislocation</strong> structure; (b) the 22 stress contour plot and (c) the deformed finite element mesh for the <strong>discrete</strong> <strong>dislocation</strong> analysis<br />
at the onset of crack extension (K I/K I0=1.10, arrows indicate position of crack tip).