Development of the parametric tolerance modeling and optimization ...
Development of the parametric tolerance modeling and optimization ...
Development of the parametric tolerance modeling and optimization ...

Create successful ePaper yourself
Turn your PDF publications into a flip-book with our unique Google optimized e-Paper software.
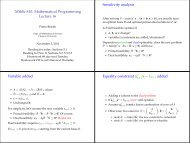
Innovative Applications <strong>of</strong> O.R.<br />
<strong>Development</strong> <strong>of</strong> <strong>the</strong> <strong>parametric</strong> <strong>tolerance</strong> <strong>modeling</strong> <strong>and</strong> <strong>optimization</strong> schemes<br />
<strong>and</strong> cost-effective solutions<br />
Sangmun Shin a, *, Pauline Kongsuwon a , Byung Rae Cho b<br />
a Department <strong>of</strong> Systems Management <strong>and</strong> Engineering, Inje University, Gimhae 621749, South Korea<br />
b Department <strong>of</strong> Industrial Engineering, Clemson University, Clemson, SC 29634, USA<br />
article info<br />
Article history:<br />
Received 5 December 2008<br />
Accepted 7 July 2010<br />
Available online 17 July 2010<br />
Keywords:<br />
Process parameters<br />
Tolerance<br />
Quality loss<br />
Lambert W function<br />
Optimization<br />
1. Introduction<br />
abstract<br />
The continuous improvement <strong>of</strong> <strong>the</strong> quality <strong>of</strong> products has<br />
become an integral part <strong>of</strong> <strong>the</strong> business strategy <strong>of</strong> most enterprises.<br />
Designing for quality, in particular, has proven to be a key<br />
concept, helping many companies not only to improve product<br />
quality but also to reduce costs. It is widely accepted that approximately<br />
70% <strong>of</strong> production expenses are incurred by <strong>tolerance</strong>-related<br />
design efforts (Caleb Li <strong>and</strong> Chen, 2001). A tight <strong>tolerance</strong><br />
usually implies high manufacturing cost due to <strong>the</strong> additional<br />
manufacturing operations, slow processing rates, additional care<br />
required on <strong>the</strong> part <strong>of</strong> <strong>the</strong> operator, <strong>and</strong> <strong>the</strong> expensive measuring<br />
<strong>and</strong> processing equipment. As a result, <strong>the</strong> functional performance<br />
is improved. On <strong>the</strong> o<strong>the</strong>r h<strong>and</strong>, a loose <strong>tolerance</strong> reduces <strong>the</strong> manufacturing<br />
cost but may, at <strong>the</strong> same time, lower <strong>the</strong> product quality<br />
level considerably. Thus, determining <strong>the</strong> optimal <strong>tolerance</strong><br />
involves a trade-<strong>of</strong>f between <strong>the</strong> level <strong>of</strong> quality based on functional<br />
performance <strong>and</strong> <strong>the</strong> associated costs. To facilitate this economic<br />
trade-<strong>of</strong>f, researchers typically express quality in monetary<br />
terms using a quality loss function. This function is widely used in<br />
<strong>the</strong> literature as a reasonable approximation <strong>of</strong> <strong>the</strong> actual loss to<br />
<strong>the</strong> customer due to <strong>the</strong> deviation <strong>of</strong> <strong>the</strong> product performance from<br />
its target value. By expressing <strong>the</strong> level <strong>of</strong> quality in monetary<br />
* Corresponding author. Tel.: +82 55 320 3670; fax: +82 55 320 3632.<br />
E-mail addresses: sshin@inje.ac.kr (S. Shin), p_kongsuwan@yahoo.com (P.<br />
Kongsuwon), bcho@clemson.edu (B.R. Cho).<br />
European Journal <strong>of</strong> Operational Research 207 (2010) 1728–1741<br />
Contents lists available at ScienceDirect<br />
European Journal <strong>of</strong> Operational Research<br />
journal homepage: www.elsevier.com/locate/ejor<br />
0377-2217/$ - see front matter Crown Copyright Ó 2010 Published by Elsevier B.V. All rights reserved.<br />
doi:10.1016/j.ejor.2010.07.009<br />
Most <strong>of</strong> previous research on <strong>tolerance</strong> <strong>optimization</strong> seeks <strong>the</strong> optimal <strong>tolerance</strong> allocation with process<br />
parameters such as fixed process mean <strong>and</strong> variance. This research, however, differs from <strong>the</strong> previous<br />
studies in two ways. First, an integrated <strong>optimization</strong> scheme is proposed to determine both <strong>the</strong> optimal<br />
settings <strong>of</strong> those process parameters <strong>and</strong> <strong>the</strong> optimal <strong>tolerance</strong> simultaneously which is called a <strong>parametric</strong><br />
<strong>tolerance</strong> <strong>optimization</strong> problem in this paper. Second, most <strong>tolerance</strong> <strong>optimization</strong> models require rigorous<br />
<strong>optimization</strong> processes using numerical methods, since closed-form solutions are rarely found. This<br />
paper shows how <strong>the</strong> Lambert W function, which is <strong>of</strong>ten used in physics, can be applied efficiently to this<br />
<strong>parametric</strong> <strong>tolerance</strong> <strong>optimization</strong> problem. By using <strong>the</strong> Lambert W function, one can express <strong>the</strong> optimal<br />
solutions to <strong>the</strong> <strong>parametric</strong> <strong>tolerance</strong> <strong>optimization</strong> problem in a closed-form without resorting to<br />
numerical methods. For verification purposes, numerical examples for three cases are conducted <strong>and</strong> sensitivity<br />
analyses are performed.<br />
Crown Copyright Ó 2010 Published by Elsevier B.V. All rights reserved.<br />
terms, <strong>the</strong> problem <strong>of</strong> product trade-<strong>of</strong>f with costs is converted<br />
into a problem <strong>of</strong> minimizing <strong>the</strong> total expense, which is <strong>the</strong><br />
sum <strong>of</strong> <strong>the</strong> quality loss <strong>and</strong> <strong>the</strong> costs, i.e., those associated with<br />
<strong>the</strong> <strong>tolerance</strong>, including manufacturing, inspection, <strong>and</strong> rejection<br />
costs. Determining <strong>the</strong> optimal <strong>tolerance</strong> is equivalent to determining<br />
<strong>the</strong> optimal specification limits because <strong>the</strong> term <strong>tolerance</strong><br />
refers to <strong>the</strong> distance between <strong>the</strong> lower <strong>and</strong> upper specification<br />
limits <strong>of</strong> a product.<br />
Most previous research addresses <strong>the</strong> <strong>tolerance</strong> <strong>optimization</strong><br />
problem through models seeking <strong>the</strong> optimal <strong>tolerance</strong> allocation<br />
by using fixed settings <strong>of</strong> process parameters (i.e., <strong>the</strong> process<br />
mean <strong>and</strong> variance). This research, however, differs from previous<br />
studies <strong>of</strong> this problem in three ways. First, in this paper, an integrated<br />
<strong>optimization</strong> scheme is proposed in order to determine <strong>the</strong><br />
optimal settings <strong>of</strong> those process parameters <strong>and</strong> <strong>the</strong> optimal <strong>tolerance</strong><br />
by simultaneously considering <strong>the</strong> quality loss incurred<br />
by <strong>the</strong> customer, <strong>and</strong> <strong>the</strong> manufacturing <strong>and</strong> rejection costs<br />
incurred by <strong>the</strong> producer. Second, this paper proposes three cases<br />
in order to conduct a sequential <strong>optimization</strong> procedure by optimizing<br />
process parameters <strong>and</strong> <strong>tolerance</strong>. Third, this paper <strong>the</strong>n<br />
shows how <strong>the</strong> Lambert W function, widely used in physics<br />
(Corless et al., 1996), can be applied efficiently to <strong>the</strong> <strong>tolerance</strong><br />
<strong>optimization</strong> problem. There are two significant benefits from<br />
using <strong>the</strong> Lambert W function in this context. Most current <strong>tolerance</strong><br />
<strong>optimization</strong> models require rigorous <strong>optimization</strong> processes<br />
using complicated numerical methods since closed-form solutions<br />
are rarely found. By using <strong>the</strong> Lambert W function, however,
quality practitioners can express <strong>the</strong>ir solutions in a closed-form,<br />
in addition to being able to determine optimal <strong>tolerance</strong>s quickly<br />
without resorting to numerical methods, since a number <strong>of</strong> popular<br />
ma<strong>the</strong>matical s<strong>of</strong>tware packages contain this function. Finally,<br />
numerical examples for three cases are conducted <strong>and</strong> sensitivity<br />
analyses are performed for verification purposes. An overview <strong>of</strong><br />
<strong>the</strong> proposed procedure is illustrated in Fig. 1.<br />
2. Literature review<br />
Determining <strong>the</strong> optimal process mean <strong>and</strong> <strong>tolerance</strong> is usually<br />
considered separately in <strong>the</strong> literature. The following review investigates<br />
<strong>the</strong> current methodologies used in both areas.<br />
2.1. Process parameter <strong>optimization</strong><br />
The initial work in determining an optimal process mean probably<br />
was began by Springer (1951), who considered <strong>the</strong> problem<br />
with specified upper <strong>and</strong> lower specification limits under <strong>the</strong><br />
assumption <strong>of</strong> constant net income functions. However, when<br />
<strong>the</strong> minimum content was dictated by government legislation, as<br />
is <strong>of</strong>ten <strong>the</strong> situation, <strong>the</strong> lower limit was fixed while <strong>the</strong> upper<br />
was arbitrary. In such a case, underfilled cans, for example, need<br />
to be ei<strong>the</strong>r reprocessed or sold at a lower price on a secondary<br />
market. Golhar (1987) <strong>and</strong> Golhar <strong>and</strong> Pollock (1988) developed<br />
models for <strong>the</strong> optimal process mean problem under <strong>the</strong> assumption<br />
that overfilled cans could be sold in a regular market, while<br />
underfilled ones require reprocessing. A more generalized treatment<br />
<strong>of</strong> <strong>the</strong> optimal process mean problem, involving <strong>the</strong> determi-<br />
S. Shin et al. / European Journal <strong>of</strong> Operational Research 207 (2010) 1728–1741 1729<br />
Fig. 1. The overview <strong>of</strong> <strong>the</strong> proposed procedure.<br />
nation <strong>of</strong> both <strong>the</strong> optimal process mean <strong>and</strong> <strong>the</strong> upper<br />
specification limit when a filling amount follows an arbitrary continuous<br />
distribution, was suggested by Liu <strong>and</strong> Raghavachari<br />
(1997). In addition, Pakkala <strong>and</strong> Rahim (1999) presented a model<br />
for <strong>the</strong> most economical process mean <strong>and</strong> production run, while<br />
Al-Sultan <strong>and</strong> Pulak (2000) proposed an algorithm by considering<br />
a manufacturing system for a two-stage series to find an optimal<br />
mean based on a product lower specification limit.<br />
While most researchers considered <strong>the</strong> process variance as a given<br />
value, Rahim <strong>and</strong> Al-Sultan (2000) <strong>and</strong> Rahim et al. (2002)<br />
studied <strong>the</strong> problem <strong>of</strong> jointly determining <strong>the</strong> process mean <strong>and</strong><br />
variance. In <strong>the</strong>ir research, <strong>the</strong> concept <strong>of</strong> variance reduction in<br />
quality improvement <strong>and</strong> cost reduction is emphasized. Similarly,<br />
Al-Fawzan <strong>and</strong> Rahim (2001) applied a Taguchi loss function to<br />
determine <strong>the</strong> optimal process mean <strong>and</strong> variance jointly. Shao<br />
et al. (2000) examined several methods for process mean <strong>optimization</strong><br />
when several levels <strong>of</strong> customer specifications are needed<br />
within <strong>the</strong> same market, while Kim et al. (2000) achieved this joint<br />
determination by integrating <strong>the</strong> variance reduction principles into<br />
process mean <strong>optimization</strong> <strong>modeling</strong> using a process capability<br />
concept.<br />
Recent research has been concentrated in two areas. The first<br />
area involves <strong>the</strong> approach used to determine product performance.<br />
In this situation, where empirical data concerning <strong>the</strong> costs<br />
associated with product performance are available, regression<br />
analysis is typically used as exemplified by Teeravaraprug et al.<br />
(2001), who showed a model for determining a cost-effective process<br />
mean. In <strong>the</strong> absence <strong>of</strong> such data, however, Teeravaraprug<br />
<strong>and</strong> Cho (2002) applied a quadratic loss function concept, based<br />
on a multivariate normal distribution, to a process mean problem
1730 S. Shin et al. / European Journal <strong>of</strong> Operational Research 207 (2010) 1728–1741<br />
with multiple quality characteristics. The second area considers<br />
more complex manufacturing situations involving a sequential<br />
production system. Using a multi-stage production system, Bowling<br />
et al. (2004) proposed a method for determining <strong>the</strong> optimum<br />
process mean for each stage by integrating a Markovian model to<br />
represent <strong>the</strong> production system, while Kang et al. (2004) applied<br />
robust economic <strong>optimization</strong> concepts to optimize <strong>the</strong> process<br />
mean <strong>and</strong> <strong>the</strong> robustness measure for a chemical process within<br />
a multiobjective <strong>optimization</strong> framework. Jeong <strong>and</strong> Kim (2009)<br />
also proposed a multi-response <strong>optimization</strong> method by using an<br />
interactive desirability function incorporating decision maker’s<br />
preference information.<br />
2.2. Tolerance <strong>optimization</strong><br />
Tolerance, <strong>the</strong> second important focus in this research area, involves<br />
<strong>the</strong> problem <strong>of</strong> determining optimal specification limits<br />
from <strong>the</strong> viewpoint <strong>of</strong> cost reduction <strong>and</strong> functional performance.<br />
For example, early work by Speckhart (1972), Spotts (1973), Chase<br />
et al. (1990) <strong>and</strong> Kim <strong>and</strong> Cho (2000b) considered <strong>the</strong> reduction <strong>of</strong><br />
manufacturing cost in a <strong>tolerance</strong> allocation problem whereas<br />
Fathi (1990), Phillips <strong>and</strong> Cho (1998) <strong>and</strong> Kim <strong>and</strong> Cho (2000a)<br />
studied <strong>the</strong> issue <strong>of</strong> <strong>tolerance</strong> design from <strong>the</strong> viewpoint <strong>of</strong> functional<br />
performance, expressing it in monetary terms using <strong>the</strong><br />
Taguchi quality loss concept. In an integrated study considering<br />
<strong>the</strong> effect <strong>of</strong> both cost reduction <strong>and</strong> functional performance toge<strong>the</strong>r,<br />
Tang (1988) developed an economic model for selecting<br />
<strong>the</strong> most pr<strong>of</strong>itable <strong>tolerance</strong> in situations where inspection cost<br />
is a linear function. Tang <strong>and</strong> Tang (1989) <strong>the</strong>n extended this investigation<br />
to include screening inspection for multiple performance<br />
variables in a serial production process. Also, in 1994, <strong>the</strong>y comprehensively<br />
addressed <strong>the</strong> concerns inherent in <strong>the</strong> design <strong>of</strong> such<br />
screening procedures (Tang <strong>and</strong> Tang, 1994).<br />
When integrating both viewpoints, i.e., cost <strong>and</strong> functional performance,<br />
a trade-<strong>of</strong>f is <strong>of</strong>ten necessary. Along this line, Jeang<br />
(1997) considered <strong>the</strong> simultaneous <strong>optimization</strong> <strong>of</strong> manufacturing<br />
cost, rejection cost, <strong>and</strong> quality loss using a process capability<br />
index to establish a relationship between <strong>tolerance</strong> <strong>and</strong> st<strong>and</strong>ard<br />
deviation. In an attempt to achieve a more realistic basis for use<br />
in industrial settings, Kapur <strong>and</strong> Cho (1996) investigated <strong>tolerance</strong><br />
<strong>optimization</strong> problems using truncated normal, Weibull, <strong>and</strong> multivariate<br />
normal distributions, respectively. However, in situations<br />
where <strong>the</strong> historical data <strong>of</strong> losses are available, regression analysis<br />
can be applied, as exemplified by Phillips <strong>and</strong> Cho (1998), who<br />
studied <strong>the</strong> minimization <strong>of</strong> <strong>the</strong> quality loss <strong>and</strong> <strong>the</strong> rejection costs.<br />
They developed <strong>optimization</strong> models using <strong>the</strong> first-order <strong>and</strong> second-order<br />
empirical loss functions.<br />
Research in <strong>the</strong> past several years has focused on an increasingly<br />
more complex manufacturing environment. By Plante<br />
(2002), trade-<strong>of</strong>fs are considered for multivariate cases when conducting<br />
<strong>parametric</strong> <strong>and</strong> non<strong>parametric</strong> <strong>tolerance</strong> allocation. A genetic<br />
algorithm is utilized to determine complex <strong>optimization</strong><br />
problems encountered by <strong>the</strong> selection <strong>of</strong> design <strong>and</strong> manufacturing<br />
<strong>tolerance</strong>s under different stack-up conditions (Singh et al.,<br />
2003). Manarvi <strong>and</strong> Juster (2004) developed an integrated <strong>tolerance</strong><br />
syn<strong>the</strong>sis model for <strong>tolerance</strong> allocation in assembly design.<br />
Wang <strong>and</strong> Liang (2005) studied <strong>the</strong> <strong>tolerance</strong> <strong>optimization</strong> problem<br />
in <strong>the</strong> context <strong>of</strong> machining processes, such as milling, turning,<br />
drilling, reaming, boring, <strong>and</strong> grinding. Shin <strong>and</strong> Cho (2007) studied<br />
two separate process parameters, such as process mean <strong>and</strong><br />
variability, in <strong>the</strong> bi-objective <strong>optimization</strong> framework. Recently,<br />
Prabhaharan et al. (2007) <strong>and</strong> Peng et al. (2008) considered optimal<br />
process <strong>tolerance</strong>s for mechanical assemblies as a combinatorial<br />
<strong>optimization</strong> problem by considering stack-up conditions. Lee<br />
et al. (2007) proposed a method to find <strong>the</strong> process mean maximizing<br />
<strong>the</strong> expected pr<strong>of</strong>it for a multi-product production process.<br />
Hong <strong>and</strong> Cho (2007) suggested a joint <strong>optimization</strong> method associated<br />
with <strong>the</strong> process target <strong>and</strong> <strong>tolerance</strong> limits based on measurement<br />
errors. Jeang <strong>and</strong> Chung (2008) developed an<br />
<strong>optimization</strong> model for product quality performance to determine<br />
optimal use time, initial settings, a process mean, <strong>and</strong> a process <strong>tolerance</strong><br />
that simultaneously minimize total cost, quality loss, failure<br />
cost, <strong>and</strong> <strong>tolerance</strong> cost. Chen <strong>and</strong> Kao (2009) proposed a process<br />
control model for <strong>the</strong> canning/filling industry to find <strong>the</strong> process<br />
mean <strong>and</strong> screening limits that minimize <strong>the</strong> expected total costs<br />
by utilizing <strong>the</strong> concept <strong>of</strong> <strong>the</strong> surrogate variable which is assumed<br />
to be highly correlated by <strong>the</strong> performance variable.<br />
3. Cost structure for process parameter <strong>optimization</strong><br />
Loss to customers due to quality performance is zero when <strong>the</strong><br />
performance <strong>of</strong> all key quality characteristics occurs at <strong>the</strong>ir customer-identified<br />
target values. However, due to <strong>the</strong> inherent variability<br />
associated with <strong>the</strong> characteristics, <strong>the</strong> loss is always<br />
incurred by <strong>the</strong> customer <strong>and</strong> it can be reduced by minimizing<br />
<strong>the</strong> deviation from <strong>the</strong> target value <strong>of</strong> each quality characteristic.<br />
However, it is <strong>of</strong>ten <strong>the</strong> case that process costs <strong>of</strong>ten increase as<br />
we try to achieve a smaller deviation from <strong>the</strong> process target value.<br />
An <strong>optimization</strong> <strong>of</strong> process parameter settings involves determining<br />
<strong>the</strong> optimal process mean <strong>and</strong> st<strong>and</strong>ard deviation which simultaneously<br />
minimize <strong>the</strong> loss incurred by <strong>the</strong> customer <strong>and</strong> <strong>the</strong><br />
process cost incurred by <strong>the</strong> manufacturer.<br />
When <strong>modeling</strong> a problem to optimize <strong>the</strong> process parameter<br />
settings, <strong>the</strong> customer loss <strong>and</strong> <strong>the</strong> process cost need to be expressed<br />
in terms <strong>of</strong> <strong>the</strong> decision variables (process mean <strong>and</strong><br />
st<strong>and</strong>ard deviation). In <strong>the</strong> following sections, <strong>the</strong> loss incurred<br />
by <strong>the</strong> customer is written in terms <strong>of</strong> <strong>the</strong>se decision variables<br />
by using a quadratic loss function, whereas <strong>the</strong> relationship between<br />
<strong>the</strong> process cost <strong>and</strong> <strong>the</strong> decision variables is empirically<br />
determined.<br />
3.1. Loss due to process variability<br />
A quality loss function (QLF) can be employed to quantify <strong>the</strong><br />
product quality on a monetary scale when its performance deviates<br />
from customer-identified target value(s) in terms <strong>of</strong> one or more<br />
key characteristics. The quality loss includes long-term losses related<br />
to reliability <strong>and</strong> <strong>the</strong> cost <strong>of</strong> warranties, excess inventory,<br />
customer dissatisfaction, <strong>and</strong> eventual loss in market share. A popular<br />
QLF is a quadratic QLF which is a quasi-convex function with<br />
many desirable ma<strong>the</strong>matical properties including unimodality,<br />
non-negative loss, zero loss due to target values, <strong>and</strong> accommodation<br />
<strong>of</strong> discontinuities (Cho <strong>and</strong> Leonard, 1997). The quadratic QLF<br />
can be applied to <strong>the</strong> situations ei<strong>the</strong>r where <strong>the</strong>re is little or no<br />
information about <strong>the</strong> functional relationship between quality<br />
<strong>and</strong> cost, or where <strong>the</strong>re is no direct evidence to refute a quadratic<br />
representation. Compared to o<strong>the</strong>r QLFs, such as step-loss or piecewise<br />
linear loss functions, <strong>the</strong> quadratic QLF may be a good approximation<br />
<strong>of</strong> measuring <strong>the</strong> quality <strong>of</strong> a product, particularly over <strong>the</strong><br />
range <strong>of</strong> characteristic values in <strong>the</strong> neighborhood <strong>of</strong> <strong>the</strong> target<br />
values.<br />
Assuming L(y) to be a measure <strong>of</strong> losses associated with <strong>the</strong><br />
quality characteristic y whose target value is T, <strong>the</strong> quadratic loss<br />
function is given by<br />
LðyÞ ¼kðy TÞ 2 ; ð1Þ<br />
where k is a positive coefficient, which can be determined from <strong>the</strong><br />
information on losses relating to exceeding <strong>the</strong> <strong>tolerance</strong> given by<br />
<strong>the</strong> customer. The expected loss is <strong>the</strong>n defined as<br />
E½L1ðyÞŠ ¼<br />
Z 1<br />
1<br />
LðyÞf ðyÞdy ¼<br />
Z 1<br />
1<br />
kðy TÞ 2 f ðyÞdy; ð2Þ
where L1(y) denotes <strong>the</strong> quality loss when inspection is not implemented,<br />
<strong>the</strong> quality characteristic Y is normally distributed with<br />
mean l <strong>and</strong> variance r 2 , <strong>and</strong> f(y) denotes <strong>the</strong> probability density<br />
function <strong>of</strong> Y.<br />
3.2. Process cost<br />
To minimize <strong>the</strong> process bias (<strong>the</strong> distance between <strong>the</strong> process<br />
mean <strong>and</strong> <strong>the</strong> process target) <strong>and</strong> <strong>the</strong> process variance, <strong>the</strong><br />
process parameter settings need to be optimized by achieving<br />
<strong>the</strong> minimum process cost <strong>and</strong> quality loss. The process cost<br />
can be empirically represented using <strong>the</strong> decision variables. The<br />
following empirical linear model is <strong>of</strong>ten (Chase <strong>and</strong> Parkinson,<br />
1991):<br />
CM1 ¼ c0 þ c1l þ c2r þ c3lr: ð3Þ<br />
3.3. Total cost<br />
The expected total cost for determining <strong>the</strong> optimal process<br />
parameters is <strong>the</strong>n given as<br />
E½TC1Š ¼E½L1ðyÞŠ þ E½CM1Š: ð4Þ<br />
Using Eqs. (2) <strong>and</strong> (3), Eq. (4) can be exp<strong>and</strong>ed to<br />
E½TC1Š ¼<br />
Z 1<br />
1<br />
kðy TÞ 2 f ðyÞdy þðc0 þ c1l þ c2r þ c3lrÞ: ð5Þ<br />
Eq. (5) can be written in terms <strong>of</strong> a st<strong>and</strong>ard normal r<strong>and</strong>om<br />
variable (z) using <strong>the</strong> transformation z =(y l)/r. Thus, Eq. (5)<br />
becomes<br />
E½TC1Š ¼<br />
Z 1<br />
1<br />
kfðl þ zrÞ Tg 2 /ðzÞdz þðc0 þ c1l þ c2r þ c3lrÞ:<br />
Using <strong>the</strong> following properties <strong>of</strong> st<strong>and</strong>ard normal r<strong>and</strong>om<br />
variables:<br />
Z 1<br />
1<br />
/ðzÞdz ¼ 1;<br />
Z 1<br />
1<br />
z/ðzÞdz ¼ 0; <strong>and</strong><br />
Z 1<br />
<strong>the</strong>n <strong>the</strong> expected total cost can be rewritten as<br />
1<br />
ð6Þ<br />
z 2 /ðzÞdz ¼ 1; ð7Þ<br />
E½TC1Š ¼kfðl TÞ 2 þ r 2 gþc0 þ c1l þ c2r þ c3lr: ð8Þ<br />
The optimum values, l* <strong>and</strong> r*, can be determined by simultaneously<br />
equating dE[TC 1]/dl <strong>and</strong> dE[TC 1]/dr to zero. Then, <strong>the</strong><br />
closed-form solutions <strong>of</strong> <strong>the</strong> optimal process mean <strong>and</strong> <strong>the</strong> variance<br />
are obtained. The stationary points can be easily verified by<br />
satisfying <strong>the</strong> following condition:<br />
d 2 E½TC1Š<br />
dl 2<br />
!<br />
d 2 E½TC1Š<br />
dr 2<br />
!<br />
> d2 ! 2<br />
E½TC1Š<br />
dldr<br />
4. Cost structure for <strong>tolerance</strong> <strong>optimization</strong><br />
: ð9Þ<br />
A quadratic loss function is used to evaluate a quality loss<br />
when an inspection with specification limits is implemented. Besides<br />
<strong>the</strong> loss incurred by <strong>the</strong> customer, <strong>the</strong> costs incurred by <strong>the</strong><br />
manufacturer, such as <strong>the</strong> rejection <strong>and</strong> <strong>the</strong> manufacturing costs,<br />
are also included. Depending on customer requirements, lower<br />
<strong>and</strong> upper specification limits (LSL <strong>and</strong> USL) can be defined<br />
respectively as l dr <strong>and</strong> l + dr, orT dr <strong>and</strong> T + dr where d<br />
represents <strong>the</strong> number <strong>of</strong> st<strong>and</strong>ard deviations from <strong>the</strong> middle<br />
<strong>of</strong> a <strong>tolerance</strong> range to each specification limit <strong>and</strong> it is always<br />
greater than zero.<br />
S. Shin et al. / European Journal <strong>of</strong> Operational Research 207 (2010) 1728–1741 1731<br />
4.1. Quality loss<br />
A quality loss is incurred by <strong>the</strong> customer when <strong>the</strong> product<br />
performance determined by y falls inside <strong>the</strong> specification limits.<br />
By modifying Eq. (1), <strong>the</strong> expected quality loss E[L2(y)], incurred<br />
when <strong>the</strong> process inspection is implemented at <strong>the</strong> LSL <strong>and</strong> USL,<br />
can be given as<br />
E½L2ðyÞŠ ¼<br />
Z USL<br />
LSL<br />
LðyÞf ðyÞdy ¼<br />
Z USL<br />
LSL<br />
kðy TÞ 2 f ðyÞdy: ð10Þ<br />
Letting z =(y l*)/r* where l* <strong>and</strong> r* denote <strong>the</strong> optimal process<br />
mean <strong>and</strong> st<strong>and</strong>ard deviation resulting from <strong>the</strong> process<br />
parameter <strong>optimization</strong> phase, Eq. (10) can be rewritten as<br />
E½L2ðyÞŠ ¼<br />
Z ðUSL l Þ=r<br />
ðLSL l Þ=r<br />
4.2. Rejection cost<br />
kðzr þ l TÞ 2 /ðzÞdz: ð11Þ<br />
A rejection cost is incurred by <strong>the</strong> manufacturer when <strong>the</strong> product<br />
performance determined by y falls outside <strong>the</strong> specification<br />
limits. Denoting CRas <strong>the</strong> rejection unit cost incurred when <strong>the</strong><br />
quality characteristic <strong>of</strong> a product falls below a lower specification<br />
limit or above an upper specification limit, <strong>the</strong> expected rejection<br />
cost E[CR] is defined as<br />
E½CRŠ ¼CR<br />
Z LSL<br />
1<br />
f ðyÞdy þ<br />
Z 1<br />
USL<br />
f ðyÞdy : ð12Þ<br />
Using z =(y l*)/r*, Eq. (12) can be modified as<br />
Z ðUSL l Þ=r<br />
!<br />
E½CRŠ ¼CR 1<br />
/ðzÞdz : ð13Þ<br />
ðLSL l Þ=r<br />
4.3. Manufacturing cost<br />
Additional manufacturing operations, slow processing rates,<br />
<strong>and</strong> improved care on <strong>the</strong> part <strong>of</strong> operators in achieving a tight <strong>tolerance</strong><br />
may increase manufacturing cost. The manufacturing cost<br />
usually constitutes a significant portion <strong>of</strong> <strong>the</strong> unit production cost,<br />
<strong>and</strong> its exclusion from <strong>the</strong> <strong>tolerance</strong> <strong>optimization</strong> model may result<br />
in a suboptimal <strong>tolerance</strong>. The <strong>tolerance</strong> allocation models<br />
(Speckhart, 1972; Spotts, 1973; Chase et al., 1990; Kim <strong>and</strong> Cho,<br />
2000b) found in <strong>the</strong> literature enforce <strong>the</strong> 3r assumption in order<br />
to minimize <strong>the</strong> manufacturing cost. The manufacturing cost-<strong>tolerance</strong><br />
relationship proposed in this paper is free <strong>of</strong> <strong>the</strong> ad hoc 3r<br />
assumption. Even though <strong>the</strong> middle <strong>of</strong> a <strong>tolerance</strong> range is ei<strong>the</strong>r<br />
a process mean (l) or a process target (T), <strong>the</strong> <strong>tolerance</strong> range t can<br />
be defined in terms <strong>of</strong> d, l, T <strong>and</strong> r as<br />
t ¼ USL LSL ¼ðlþ drÞ ðl drÞ ¼ðT þ drÞ ðT drÞ ¼2dr:<br />
ð14Þ<br />
The manufacturing cost (CM2) is <strong>of</strong>ten described in literature<br />
(Patel, 1980; Bjorke, 1989) as a first-order model<br />
CM2 ¼ a0 þ a1t þ e; ð15Þ<br />
where e represents <strong>the</strong> least-squares regression error. The expected<br />
manufacturing cost E[CM2], after t is replaced with 2dr from Eq.<br />
(14), can be written as<br />
E½CM2Š ¼a0 þ 2a1dr: ð16Þ<br />
4.4. Total cost<br />
The expected total cost when <strong>the</strong> process inspection is implemented<br />
can be given by<br />
E½TC2Š ¼E½L2ðyÞŠ þ E½CRŠþE½CM2Š: ð17Þ
1732 S. Shin et al. / European Journal <strong>of</strong> Operational Research 207 (2010) 1728–1741<br />
Using <strong>the</strong> optimal process mean l* <strong>and</strong> st<strong>and</strong>ard deviation r*<br />
determined in <strong>the</strong> process parameter <strong>optimization</strong> toge<strong>the</strong>r with<br />
Eqs. (11), (13) <strong>and</strong> (16), <strong>the</strong> proposed <strong>tolerance</strong> <strong>optimization</strong> model<br />
is formulated as<br />
Minimize E½TC2Š ¼<br />
5. Proposed model<br />
Z ðUSL l Þ=r<br />
kðzr þ l TÞ<br />
ðLSL l Þ=r<br />
2 /ðzÞdz<br />
Z ðUSL l Þ=r<br />
!<br />
þ CR 1<br />
ðLSL l Þ=r<br />
/ðzÞdz<br />
þ a0 þ 2a1dr:<br />
ð18Þ<br />
When determining optimal <strong>tolerance</strong>s, most research reported<br />
in <strong>the</strong> literature assumes that <strong>the</strong> levels <strong>of</strong> <strong>the</strong> two process parameters,<br />
i.e., mean <strong>and</strong> variance, are typically treated as given constants.<br />
However, <strong>the</strong> arbitrary settings <strong>of</strong> <strong>the</strong>se parameters in<br />
connection with <strong>the</strong> <strong>tolerance</strong> <strong>optimization</strong> <strong>of</strong>ten affect <strong>the</strong> defective<br />
rate, material cost, scrap or rework cost, <strong>and</strong> possibly cause a<br />
loss to customers due to <strong>the</strong> deviation <strong>of</strong> <strong>the</strong> product performance<br />
from its target value. Once <strong>the</strong> minimum process variability is<br />
achieved by determining <strong>the</strong> optimal process parameter settings,<br />
<strong>tolerance</strong> <strong>optimization</strong> can <strong>the</strong>n be implemented. There are three<br />
possible cases as shown in Fig. 1. First, when an arbitrary target<br />
is considered in a new process design, a typical <strong>tolerance</strong> <strong>optimization</strong><br />
scheme focuses on <strong>the</strong> process mean by specifying<br />
USL = l + dr <strong>and</strong> LSL = l dr. Second, when <strong>the</strong> process mean is<br />
fixed at an arbitrary target, USL = T + dr <strong>and</strong> LSL = T dr are specified.<br />
This case is usually applied to existing processes. The last<br />
possible case is when <strong>the</strong> process can absorb some bias, <strong>the</strong>reby<br />
allowing <strong>the</strong> process mean to be slightly <strong>of</strong>f <strong>the</strong> target. The categorized<br />
<strong>optimization</strong> strategy for each case is proposed.<br />
Case I: Minimize E[TC1] for <strong>the</strong> process parameter <strong>optimization</strong><br />
Minimize E[TC 2] where USL = l + dr <strong>and</strong> LSL = l dr for <strong>the</strong><br />
<strong>tolerance</strong> <strong>optimization</strong><br />
Case II: Minimize E[TC 1] where l = T for <strong>the</strong> process parameter<br />
<strong>optimization</strong><br />
Minimize E[TC 2] where USL = l + dr <strong>and</strong> LSL = l dr for <strong>the</strong><br />
<strong>tolerance</strong> <strong>optimization</strong><br />
Case III: Minimize E[TC 1] for <strong>the</strong> process parameter <strong>optimization</strong><br />
Minimize E[TC2] where USL = T + dr <strong>and</strong> LSL = T dr for <strong>the</strong><br />
<strong>tolerance</strong> <strong>optimization</strong><br />
The models for finding optimal process parameter settings <strong>and</strong><br />
<strong>tolerance</strong> range, toge<strong>the</strong>r with an investigation <strong>of</strong> <strong>the</strong> conditions<br />
for convexity are presented in each case.<br />
5.1. Case I<br />
5.1.1. Process parameter <strong>optimization</strong><br />
From Eq. (8), by equating @E[TC1]/@l <strong>and</strong> @E[TC1]/@r to zero, <strong>the</strong><br />
closed-form solutions for <strong>the</strong> optimal process mean l* <strong>and</strong> deviation<br />
r* are obtained as<br />
l ¼ 4k2T 2kc1 þ c2c3<br />
4k 2<br />
c2 ; ð19Þ<br />
3<br />
<strong>and</strong><br />
r ¼ 2kc2 þ 2kc3T c1c3<br />
4k 2 þ c2 : ð20Þ<br />
3<br />
To verify that l* <strong>and</strong> r* represent <strong>the</strong> global minima <strong>of</strong> <strong>the</strong><br />
E[TC1], <strong>the</strong> following condition developed from Eq. (9) must be<br />
satisfied:<br />
ð2kÞð2kÞ > c 2<br />
3 or 4k2 > c 2<br />
3 :<br />
5.1.2. Tolerance <strong>optimization</strong><br />
Replacing USL <strong>and</strong> LSL in Eq. (11) with l + dr <strong>and</strong> l dr,<br />
respectively, <strong>and</strong> using <strong>the</strong> following results associated with <strong>the</strong><br />
normal probability density function:<br />
Z r<br />
1<br />
Z r<br />
1<br />
/ðzÞdz ¼ UðrÞ;<br />
Z r<br />
1<br />
z/ðzÞdz ¼ /ðrÞ; <strong>and</strong><br />
z 2 /ðzÞdz ¼ UðrÞ r/ðrÞ; ð21Þ<br />
where r is a value <strong>of</strong> <strong>the</strong> st<strong>and</strong>ard normal r<strong>and</strong>om variable, <strong>the</strong> expected<br />
quality loss can be determined as<br />
E½L2ðyÞŠ ¼ 2k r 2 þðl TÞ 2<br />
n o<br />
UðdÞ 2kr 2 d/ðdÞ<br />
n o<br />
; ð22Þ<br />
k r 2 þðl TÞ 2<br />
<strong>and</strong> <strong>the</strong> expected rejection cost determined in Eq. (13) can be written<br />
as:<br />
Z d<br />
E½CRŠ ¼CR 1 /ðzÞdz ¼ 2CR½1 UðdÞŠ: ð23Þ<br />
d<br />
Substituting Eqs. (22), (23) <strong>and</strong> (16) into Eq. (17), <strong>the</strong> expected<br />
total cost is calculated as<br />
E½TC2Š ¼2k r 2 þðl TÞ 2<br />
n o<br />
UðdÞ 2kr 2 d/ðdÞ<br />
k r 2 þðl TÞ 2<br />
n o<br />
þ 2CRf1 UðdÞg þ a0<br />
þ 2a1dr : ð24Þ<br />
The optimum total cost can be derived by minimizing Eq. (24).<br />
In order to determine <strong>the</strong> optimum value d*, <strong>the</strong> first derivative <strong>of</strong><br />
E[TC2] with respect to d is calculated as<br />
@E½TC2Š<br />
@d ¼ 2k/ðdÞ ðl TÞ2 þ d 2 r 2 CR<br />
k þ 2a1r : ð25Þ<br />
Then, equating Eq. (25) to zero <strong>and</strong> substituting /(d) with<br />
e 1<br />
2 d2=<br />
ffiffiffiffiffiffi p<br />
2p,<br />
<strong>the</strong> result can be identified as follows:<br />
1<br />
e 2<br />
2k d2<br />
!<br />
pffiffiffiffiffiffi<br />
or<br />
r 2<br />
2p<br />
ðl TÞ 2 þ d 2 r 2 CR<br />
k þ 2a1r ¼ 0;<br />
2k<br />
pffiffiffiffiffiffi d 2 " #<br />
kðl TÞ2 CR<br />
þ<br />
2p<br />
kr 2<br />
e 1<br />
2 d2<br />
¼ 2a1r : ð26Þ<br />
Since it is nearly impossible to obtain a closed-form solution to<br />
this complex equation, <strong>the</strong> Lambert W function is employed to obtain<br />
such a solution <strong>of</strong> d effectively. Details are presented in Lemma<br />
1, <strong>and</strong> in Propositions 1 <strong>and</strong> 2 <strong>of</strong> Appendix B. According to Proposition<br />
2, ifg1 v2 þ g2 eg3v2 ¼ g4 where g1, g2, g3, <strong>and</strong> g4 are not<br />
functions <strong>of</strong> v, <strong>the</strong>n <strong>the</strong> solution for v can be given by<br />
ffiffiffiffiffiffiffiffiffiffiffiffiffiffiffiffiffiffiffiffiffiffiffiffiffiffiffiffiffiffiffiffiffiffiffiffiffiffiffiffiffiffiffiffiffiffiffiffiffiffiffiffiffiffiffiffiffi<br />
Lambert W<br />
v ¼<br />
g3g4 e g2g v<br />
u<br />
3<br />
u<br />
t<br />
g1 : ð27Þ<br />
g 3<br />
g 2<br />
Therefore, v, g1, g2, g3, <strong>and</strong> g4 in Proposition 2 can be respectively<br />
substituted by d; 2k=r 2<br />
p ffiffiffiffiffiffi<br />
2<br />
2p;<br />
kðl TÞ CR =kr 2 ;<br />
1=2, <strong>and</strong> 2a1r* from Eq. (26). Then, <strong>the</strong> closed-form solution<br />
<strong>of</strong> d is defined as follows:<br />
ffiffiffiffiffiffiffiffiffiffiffiffiffiffiffiffiffiffiffiffiffiffiffiffiffiffiffiffiffiffiffiffiffiffiffiffiffiffiffiffiffiffiffiffiffiffiffiffiffiffiffiffiffiffiffiffiffiffiffiffiffiffiffiffiffiffiffiffiffiffiffiffiffiffiffiffiffiffiffiffiffiffiffiffiffiffiffiffiffiffiffiffiffiffiffiffiffiffiffiffiffiffiffiffiffiffiffiffiffiffiffiffiffiffiffiffiffiffiffiffiffiffiffiffiffi<br />
d ¼ 2Lambert W a1<br />
pffiffiffi ð<br />
pe<br />
1 2 Þ<br />
kðl TÞ2 CR kr 2<br />
r k ffiffiffi<br />
0<br />
1<br />
B<br />
C<br />
B<br />
@ p C<br />
kðl TÞ<br />
2<br />
A<br />
2 CR<br />
kr 2<br />
v<br />
u<br />
!<br />
u<br />
;<br />
t<br />
ð28Þ
where l*, <strong>and</strong> d 2 , are <strong>the</strong> optimal process mean <strong>and</strong> variance obtained<br />
from <strong>the</strong> process parameter <strong>optimization</strong> phase. Although<br />
<strong>the</strong> closed-from solution presented in Eq. (28) consists <strong>of</strong> <strong>the</strong> Lambert<br />
W function component, its computation is very simple. A negative<br />
value <strong>of</strong> d* is ignored because d is always greater than zero, so<br />
<strong>the</strong> negative sign from Eq. (28) is removed. After computing d*, <strong>the</strong><br />
optimal LSL <strong>and</strong> USL can be respectively calculated from l* d*r*<br />
<strong>and</strong> l* + d*r*.<br />
5.1.3. Investigation <strong>of</strong> <strong>the</strong> second derivative <strong>and</strong> <strong>the</strong> conditions for<br />
convexity<br />
To verify <strong>the</strong> validity <strong>of</strong> d*, <strong>the</strong> second derivative is computed<br />
<strong>and</strong> <strong>the</strong> conditions for obtaining <strong>the</strong> minimum value <strong>of</strong> E[TC2] are<br />
investigated. The second derivative <strong>of</strong> E[TC2] with respect to d is<br />
@ 2 E½TC2Š<br />
@ 2 d<br />
CR 2<br />
¼ 2kd/ðdÞ þ 2r<br />
k<br />
ðl TÞ 2<br />
d 2 r 2<br />
: ð29Þ<br />
d*obtained from Eq. (28) is <strong>the</strong> global minimum <strong>of</strong> E[TC2] if <strong>the</strong> value<br />
<strong>of</strong> Eq. (29) at d* is greater than zero. Therefore, <strong>the</strong> following<br />
conditions must be satisfied:<br />
2kd/ðdÞ CR 2<br />
þ 2r<br />
k<br />
ðl TÞ 2<br />
d 2 r 2 > 0;<br />
or<br />
ffiffiffiffiffiffiffiffiffiffiffiffiffiffiffiffiffiffiffiffiffiffiffiffiffiffiffiffiffiffiffiffiffiffiffiffiffiffiffiffiffiffiffiffiffiffiffiffiffiffiffi<br />
CR þ 2kr<br />
0 < d <<br />
2 kðl TÞ 2<br />
s<br />
; ð30Þ<br />
<strong>and</strong><br />
kr 2<br />
CR þ 2kr 2 kðl TÞ 2<br />
kr 2 > 0: ð31Þ<br />
In many industrial situations, <strong>the</strong> validity <strong>of</strong> this solution is fur<strong>the</strong>r<br />
suggested by setting <strong>the</strong> value <strong>of</strong> CR to a very large number<br />
compared to <strong>the</strong> values <strong>of</strong> l* T <strong>and</strong> r 2 (Phillips <strong>and</strong> Cho, 1998).<br />
5.2. Case II<br />
5.2.1. Process parameter <strong>optimization</strong><br />
Applying <strong>the</strong> condition l = T to Eq. (8) <strong>and</strong> <strong>the</strong>n equating<br />
oE[TC 1]/@r to zero, <strong>the</strong> closed-form solutions for <strong>the</strong> optimal process<br />
mean l* <strong>and</strong> deviation r* are obtained as<br />
l ¼ T; ð32Þ<br />
<strong>and</strong><br />
r ¼ c3l þ c2<br />
2k<br />
or r ¼ c3T þ c2<br />
: ð33Þ<br />
2k<br />
5.2.2. Tolerance <strong>optimization</strong><br />
Replacing l, USL, <strong>and</strong> LSL in Eqs. (11) <strong>and</strong> (13) with T, l + dr,<br />
<strong>and</strong> l dr, respectively, <strong>and</strong> exploiting <strong>the</strong> properties defined in<br />
Eq. (21), <strong>the</strong> expected quality loss E[L 2(y)] <strong>and</strong> <strong>the</strong> expected rejection<br />
cost E[CR] are respectively presented as follows:<br />
E½L2ðyÞŠ ¼ kr 2 ½2UðdÞ 2d/ðdÞ 1Š; ð34Þ<br />
<strong>and</strong><br />
E½CRŠ ¼CR 1<br />
Z d<br />
/ðzÞdz ¼ 2CRf1 UðdÞg: ð35Þ<br />
d<br />
Substituting Eqs. (34), (35) <strong>and</strong> (16) into Eq. (17), <strong>the</strong> expected<br />
total cost can be defined as<br />
E½TC2Š ¼kr 2 f2UðdÞ 2d/ðdÞ 1gþ2CRf1 UðdÞg þ a0 þ 2a1dr :<br />
ð36Þ<br />
S. Shin et al. / European Journal <strong>of</strong> Operational Research 207 (2010) 1728–1741 1733<br />
The minimum total cost <strong>and</strong> d* can be obtained by minimizing<br />
Eq. (36). The first derivative <strong>of</strong> E[TC 2] with respect to d is calculated<br />
as follows:<br />
@E½TC2Š<br />
@d ¼ 2a1r 2CR/ðdÞþ2kd 2 r 2 /ðdÞ: ð37Þ<br />
e 1<br />
2 d2<br />
Then, equating Eq. (37) to zero <strong>and</strong> substituting /(d) with<br />
= ffiffiffiffiffiffi p<br />
2p,<br />
<strong>the</strong> result is given as<br />
kr d 2 CR 1<br />
e 2<br />
kr 2 d2<br />
¼ a1<br />
p : ð38Þ<br />
ffiffiffiffiffiffi<br />
2p<br />
d,<br />
According to Proposition 2, substituting v, g1, g2, g3, <strong>and</strong> g4 with<br />
kr*, CR=kr 2 pffiffiffiffiffiffi , 1/2, <strong>and</strong>a1 2p into Eq. (27), <strong>the</strong> closed-form<br />
solution <strong>of</strong> d* is given by<br />
d ¼<br />
ffiffiffiffiffiffiffiffiffiffiffiffiffiffiffiffiffiffiffiffiffiffiffiffiffiffiffiffiffiffiffiffiffiffiffiffiffiffiffiffiffiffiffiffiffiffiffiffiffiffiffiffiffiffiffiffiffiffiffiffiffiffiffiffiffiffiffiffiffiffiffiffiffiffiffiffiffiffiffiffiffiffiffiffiffiffiffiffiffi<br />
2Lambert W a1<br />
C pffiffiffiffiffiffi<br />
R<br />
2kr 2p e<br />
2<br />
0<br />
1<br />
B<br />
C CR<br />
B<br />
C<br />
@ 2r k A þ<br />
kr 2<br />
v<br />
u<br />
;<br />
t<br />
ð39Þ<br />
where l* <strong>and</strong> r 2 are <strong>the</strong> optimal process mean <strong>and</strong> variance obtained<br />
from <strong>the</strong> process parameter <strong>optimization</strong> phase. After computing<br />
d*, <strong>the</strong> optimal LSL <strong>and</strong> USL can be calculated from<br />
l* d*r* <strong>and</strong> l* + d*r*, respectively.<br />
5.2.3. Investigation <strong>of</strong> <strong>the</strong> second derivative <strong>and</strong> <strong>the</strong> conditions for<br />
convexity<br />
The validity <strong>of</strong> d* can be verified by <strong>the</strong> second derivative <strong>of</strong><br />
E[TC2] with respect to d. The closed-form solution presented in<br />
Eq. (39) <strong>of</strong> d* is <strong>the</strong> global minimum if <strong>the</strong> following conditions<br />
are satisfied:<br />
@ 2 E½TC2Š<br />
@ 2 d<br />
¼ 2kd/ðdÞ CR<br />
k þ 2r 2 ð1 d 2 Þ > 0;<br />
or<br />
ffiffiffiffiffiffiffiffiffiffiffiffiffiffiffiffiffiffiffiffiffi<br />
0 < d < 1 þ CR<br />
r<br />
; ð40Þ<br />
<strong>and</strong><br />
2kr 2<br />
1 þ CR<br />
> 0: ð41Þ<br />
2kr 2<br />
5.3. Case III<br />
5.3.1. Process parameter <strong>optimization</strong><br />
After applying <strong>the</strong> conditions for this case to Eq. (8), <strong>the</strong> expected<br />
total cost is <strong>the</strong> same as that <strong>of</strong> Case I. Thus, <strong>the</strong> optimal<br />
process mean l* <strong>and</strong> deviation r* are determined by Eqs. (19)<br />
<strong>and</strong> (20), respectively. For more details, please see Section 5.1.<br />
5.3.2. Tolerance <strong>optimization</strong><br />
Replacing USL, <strong>and</strong> LSL in Eqs. (11) <strong>and</strong> (13) with T + dr, <strong>and</strong><br />
T dr, respectively, <strong>and</strong> exploiting <strong>the</strong> properties defined in Eq.<br />
(21), <strong>the</strong> expected quality loss E[L2(y)] <strong>and</strong> <strong>the</strong> expected rejection<br />
cost E[CR] are respectively presented as follows:<br />
Z sþd<br />
E½L2ðyÞŠ ¼ kðzr þ l TÞ 2 /ðzÞdz;<br />
or<br />
s d<br />
n o<br />
Uðs þ dÞ<br />
k 2r ðl TÞþr 2<br />
n o<br />
ðs þ dÞ /ðs þ dÞ<br />
k ðl TÞ 2 þ r 2<br />
n o<br />
Uðs dÞ<br />
n o<br />
/ðs dÞ; ð42Þ<br />
E½L2ðyÞŠ ¼ k ðl TÞ 2 þ r 2<br />
þ k 2r ðl TÞþr 2<br />
ðs dÞ
1734 S. Shin et al. / European Journal <strong>of</strong> Operational Research 207 (2010) 1728–1741<br />
<strong>and</strong><br />
E½CRŠ ¼CR<br />
Z s d<br />
/ðzÞdz þ<br />
1<br />
Z 1<br />
sþd<br />
/ðzÞdz<br />
¼ CRf1 Uðs þ dÞþUðs dÞg; ð43Þ<br />
where s =(T l*)/r*. Substituting Eqs. (42), (43) <strong>and</strong> (16) into Eq.<br />
(17), <strong>the</strong> expected total cost can be written as<br />
E½TC2Š ¼k ðl TÞ 2 þ r 2<br />
n o<br />
Uðs þ dÞ k ðl TÞ 2 þ r 2<br />
n o<br />
Uðs<br />
k 2r ðl TÞþr<br />
dÞ<br />
2<br />
n o<br />
ðs þ dÞ /ðs þ dÞ<br />
þ k 2r ðl TÞþr 2<br />
n<br />
ðs<br />
o<br />
dÞ /ðs dÞ<br />
þ CRf1 Uðs þ dÞþUðs dÞg þ a0 þ 2a1dr : ð44Þ<br />
Even though <strong>the</strong> closed-form solution <strong>of</strong> d* for this case cannot<br />
be provided, <strong>the</strong> optimum expected total cost <strong>and</strong> d* can be found<br />
by minimizing Eq. (44). After d* is generated, <strong>the</strong> optimal LSL <strong>and</strong><br />
USL can be computed from T d*r* <strong>and</strong> T + d*r*, respectively.<br />
6. Numerical example<br />
To illustrate <strong>the</strong> application <strong>of</strong> <strong>the</strong> proposed models, an electronic<br />
chip manufacturing company experiencing high warranty<br />
costs <strong>and</strong> customer dissatisfaction associated with component failures<br />
in a prime product will be used. This company is considering a<br />
new process for manufacturing electronic chips. In view <strong>of</strong> <strong>the</strong> high<br />
Fig. 2. Plots <strong>of</strong> E[TC1], E[L1], <strong>and</strong>E[CM1] with respect to r <strong>and</strong> l.<br />
Table 1<br />
Effect <strong>of</strong> r on E[TC 1] when l = l*.<br />
r l E[L1(y)] E[CM1] E[TC1] 0.50 49.99 25.01 307.16 332.17<br />
0.60 49.99 36.01 287.60 323.61<br />
0.70 49.99 49.01 268.05 317.06<br />
0.80 49.99 64.01 248.49 312.50<br />
0.90 49.99 81.01 228.93 309.94<br />
1.00 49.99 100.01 209.38 309.39<br />
1.10 49.99 121.01 189.82 310.83<br />
1.20 49.99 144.01 170.27 314.28<br />
1.30 49.99 169.01 150.71 319.72<br />
1.40 49.99 196.01 131.15 327.16<br />
1.50 49.99 225.01 111.60 336.61<br />
1.60 49.99 256.01 92.04 348.05<br />
1.70 49.99 289.01 72.48 361.49<br />
1.80 49.99 324.01 52.93 376.94<br />
1.90 49.99 361.01 33.37 394.38<br />
2.00 49.99 400.01 13.82 413.83<br />
costs associated with <strong>the</strong> failure <strong>of</strong> <strong>the</strong> components <strong>and</strong> <strong>the</strong> low<br />
inspection costs, <strong>the</strong> company follows a 100% inspection policy<br />
on a key quality characteristic Y which is normally distributed with<br />
mean l <strong>and</strong> st<strong>and</strong>ard deviation r.<br />
Fig. 3. Plots <strong>of</strong> E[TC2], E[CR], E[L2], <strong>and</strong> E[CM2] with respect to d.<br />
Fig. 4. Plot <strong>of</strong> @E[TC2]/@d with respect to d.<br />
Fig. 5. Plot <strong>of</strong> @ 2 E[TC 2]/@d 2 with respect to d.
A quality loss incurred due to <strong>the</strong> deviation from <strong>the</strong> target value<br />
<strong>of</strong> quality characteristic Y(T) is described as <strong>the</strong> quadratic function:<br />
k(y T) 2 , where k <strong>and</strong> T are 100 <strong>and</strong> 50, respectively. The<br />
quality loss coefficient k is a coefficient representing <strong>the</strong> magni-<br />
Fig. 6. Plots <strong>of</strong> E[TC1], E[L1], <strong>and</strong>E[CM1] with respect to r <strong>and</strong> l.<br />
Fig. 7. Plots <strong>of</strong> E[TC2], E[CR], E[L2], <strong>and</strong> E[CM2] with respect to d.<br />
Fig. 8. Plot <strong>of</strong> @E[TC 2]/@d with respect to d.<br />
S. Shin et al. / European Journal <strong>of</strong> Operational Research 207 (2010) 1728–1741 1735<br />
tude <strong>of</strong> <strong>the</strong> loss incurred by <strong>the</strong> deviation <strong>of</strong> y from <strong>the</strong> target value.<br />
As shown in Fig. 2, <strong>the</strong> relationship between <strong>the</strong> expected total<br />
cost, <strong>the</strong> quality loss, <strong>and</strong> <strong>the</strong> manufacturing cost is defined in<br />
Eq. (4) (i.e., E[TC 1]=E[L 1(y)] + E[CM 1]). If <strong>the</strong> loss coefficient k<br />
Fig. 9. Plot <strong>of</strong> @ 2 E[TC2]/@d 2 with respect to d.<br />
Fig. 10. Plots <strong>of</strong> E[TC 2], E[C R], E[L 2], <strong>and</strong> E[C M2] with respect to d.<br />
Fig. 11. Plot <strong>of</strong> @E[TC 2]/@dwith respect to d.
1736 S. Shin et al. / European Journal <strong>of</strong> Operational Research 207 (2010) 1728–1741<br />
increases, <strong>the</strong> expected quality loss E[L1(y)] <strong>and</strong> <strong>the</strong> expected total<br />
cost E[TC 1] also increase.<br />
When inspection is not implemented, <strong>the</strong> empirical model associated<br />
with manufacturing costs is described by <strong>the</strong> polynomial<br />
presented in Eq. (3) where its regression coefficients c0, c1, c2,<br />
<strong>and</strong> c 3 are 100, 6.1, 3.1, <strong>and</strong> 3.85, respectively. When inspection<br />
is implemented, <strong>the</strong> manufacturing cost (CM2) is defined as <strong>the</strong><br />
polynomial model presented in Eq. (16) where a 0 <strong>and</strong> a 1 are 100<br />
Fig. 12. Plot <strong>of</strong> @ 2 E[TC2]/@d 2 with respect to d.<br />
Fig. 13. Plots <strong>of</strong> <strong>the</strong> effect <strong>of</strong> r on E[TC1], E[L1], <strong>and</strong> E[CM1] when l = l*.<br />
Table 2<br />
Effect <strong>of</strong> l on E[TC 1] when r = r*.<br />
l r E[L1(y)] E[CM1] E[TC1]<br />
49.00 0.98 196.04 210.99 407.03<br />
49.20 0.98 160.04 211.45 371.49<br />
49.40 0.98 132.04 211.92 343.96<br />
49.60 0.98 112.04 212.38 324.42<br />
49.70 0.98 105.04 212.61 317.65<br />
49.80 0.98 100.04 212.85 312.89<br />
49.90 0.98 97.04 213.08 310.12<br />
50.00 0.98 96.04 213.31 309.35<br />
50.10 0.98 97.04 213.54 310.58<br />
50.20 0.98 100.04 213.78 313.82<br />
50.40 0.98 112.04 214.24 326.28<br />
50.50 0.98 121.04 214.48 335.52<br />
50.60 0.98 132.04 214.71 346.75<br />
50.80 0.98 160.04 215.17 375.21<br />
51.00 0.98 196.04 215.64 411.68<br />
<strong>and</strong> 0.2, respectively. When <strong>the</strong> product performance determined<br />
by y falls outside <strong>the</strong> product specification limits, <strong>the</strong> rejection unit<br />
cost (CR) is set to an arbitrary value such as 100 in this numerical<br />
example.<br />
6.1. Case I<br />
6.1.1. Determining optimal settings <strong>of</strong> process parameters<br />
Using <strong>the</strong> closed-form solution given in Eqs. (19) <strong>and</strong> (20), l*<br />
<strong>and</strong> r* become 49.9883 <strong>and</strong> 0.9778, respectively. Fig. 2 plots<br />
Fig. 14. Plots <strong>of</strong> <strong>the</strong> effect <strong>of</strong> l on E[TC1], E[L1], <strong>and</strong> E[CM1] when r = r*.<br />
Table 3<br />
Effect <strong>of</strong> r on d* when l = l*.<br />
r l jl Tj d* E[CM2] E[CR] E[L2(y)] E[TC2] 0.80 49.99 0.01 1.2522 99.5993 21.0511 21.3398 141.9903<br />
0.85 49.99 0.01 1.1790 99.5991 23.8395 21.1143 144.5529<br />
0.90 49.99 0.01 1.1141 99.5989 26.5241 20.8129 146.9359<br />
0.95 49.99 0.01 1.0561 99.5987 29.0913 20.4613 149.1513<br />
1.00 49.99 0.01 1.0041 99.5984 31.5343 20.0792 151.2119<br />
1.05 49.99 0.01 0.9571 99.5980 33.8506 19.6812 153.1298<br />
1.10 49.99 0.01 0.9146 99.5976 36.0408 19.2786 154.9170<br />
1.15 49.99 0.01 0.8759 99.5971 38.1075 18.8798 156.5845<br />
1.20 49.99 0.01 0.8406 99.5965 40.0547 18.4912 158.1424<br />
1.25 49.99 0.01 0.8084 99.5958 41.8868 18.1174 159.6001<br />
1.30 49.99 0.01 0.7788 99.5950 43.6089 17.7623 160.9662<br />
Fig. 15. Plots <strong>of</strong> <strong>the</strong> effect <strong>of</strong> r on E[TC 2], E[C R], E[L 2], E[C M2], <strong>and</strong> d* when l = l*.
E[TC1] versus l <strong>and</strong> r, where <strong>the</strong> minimum value <strong>of</strong> E[TC1] obtained<br />
at l* <strong>and</strong> r* is 309.3380.<br />
The sensitivity analysis <strong>of</strong> E[TC1] to <strong>the</strong> variation in process<br />
st<strong>and</strong>ard deviation when <strong>the</strong> process mean is fixed at l* is presented<br />
in Table 1 <strong>and</strong> Fig. 13. A similar analysis is conducted when<br />
<strong>the</strong> process st<strong>and</strong>ard deviation is fixed at r* <strong>and</strong> it is shown in Table<br />
2 <strong>and</strong> Fig. 14.<br />
6.1.2. Determining optimal <strong>tolerance</strong><br />
Using <strong>the</strong> closed-form solution defined in Eq. (28), d* becomes<br />
1.0269. This optimal value generates <strong>the</strong> minimum E[TC 2], optimal<br />
LSL, <strong>and</strong> optimal USL at 150.3168, 48.9842, <strong>and</strong> 50.9924, respec-<br />
Table 4<br />
Effect <strong>of</strong> jl Tj on d* when r = r*.<br />
l jl Tj r d* E[CM2] E[CR] E[L2(y)] E[TC2] 49.0 1.00 0.98 0.0685 99.9731 94.5356 5.4726 199.9813<br />
49.1 0.90 0.98 0.4516 99.8230 65.1579 30.4354 195.4162<br />
49.2 0.80 0.98 0.6182 99.7577 53.6425 35.0573 188.4574<br />
49.3 0.70 0.98 0.7345 99.7121 46.2616 34.9641 180.9377<br />
49.4 0.60 0.98 0.8222 99.6777 41.0981 32.8406 173.6164<br />
49.5 0.50 0.98 0.8896 99.6513 37.3676 29.9179 166.9368<br />
49.6 0.40 0.98 0.9412 99.6310 34.6598 26.8931 161.1839<br />
49.7 0.30 0.98 0.9795 99.6160 32.7348 24.1974 156.5482<br />
49.8 0.20 0.98 1.0059 99.6057 31.4458 22.1055 153.1570<br />
49.9 0.10 0.98 1.0215 99.5996 30.7041 20.7882 151.0919<br />
50.0 0.00 0.98 1.0266 99.5976 30.4619 20.3391 150.3987<br />
Fig. 16. Plots <strong>of</strong> <strong>the</strong> effect <strong>of</strong> jl Tj on E[TC2], E[CR], E[L2], E[CM2], <strong>and</strong> d* when<br />
r = r*.<br />
Table 5<br />
Effect <strong>of</strong> r on E[TC 1] when l = l*.<br />
r l E[L1(y)] E[CM1] E[TC1] 0.5 50.00 25.00 307.20 332.20<br />
0.6 50.00 36.00 287.64 323.64<br />
0.7 50.00 49.00 268.08 317.08<br />
0.8 50.00 64.00 248.52 312.52<br />
0.9 50.00 81.00 228.96 309.96<br />
1.0 50.00 100.00 209.40 309.40<br />
1.1 50.00 121.00 189.84 310.84<br />
1.2 50.00 144.00 170.28 314.28<br />
1.3 50.00 169.00 150.72 319.72<br />
1.4 50.00 196.00 131.16 327.16<br />
1.5 50.00 225.00 111.60 336.60<br />
1.6 50.00 256.00 92.04 348.04<br />
1.7 50.00 289.00 72.48 361.48<br />
1.8 50.00 324.00 52.92 376.92<br />
1.9 50.00 361.00 33.36 394.36<br />
2.0 50.00 400.00 13.80 413.80<br />
S. Shin et al. / European Journal <strong>of</strong> Operational Research 207 (2010) 1728–1741 1737<br />
tively. Plots <strong>of</strong> E[TC2], E[CM2], E[CR] <strong>and</strong> E[L2] with respect to d are<br />
presented in Fig. 3.<br />
Figs. 4 <strong>and</strong> 5 show that <strong>the</strong> first derivative <strong>of</strong> E[TC2] with respect<br />
to d at d* is zero <strong>and</strong> <strong>the</strong> second derivative <strong>of</strong> E[TC 2] with respect to<br />
d at d* is greater than zero, respectively. The latter figure also validates<br />
<strong>the</strong> conditions for convexity presented in Eqs. (30) <strong>and</strong> (31).<br />
Table 6<br />
Effect <strong>of</strong> l on E[TC 1] when r = r*.<br />
l r E[L1(y)] E[CM1] E[TC1] 49.0 0.98 96.04 210.99 307.03<br />
49.2 0.98 96.04 211.45 307.49<br />
49.4 0.98 96.04 211.92 307.96<br />
49.6 0.98 96.04 212.38 308.42<br />
49.7 0.98 96.04 212.61 308.65<br />
49.8 0.98 96.04 212.85 308.89<br />
49.9 0.98 96.04 213.08 309.12<br />
50.0 0.98 96.04 213.31 309.35<br />
50.1 0.98 96.04 213.54 309.58<br />
50.2 0.98 96.04 213.78 309.82<br />
50.3 0.98 96.04 214.01 310.05<br />
50.4 0.98 96.04 214.24 310.28<br />
50.5 0.98 96.04 214.48 310.52<br />
50.6 0.98 96.04 214.71 310.75<br />
50.8 0.98 96.04 215.17 311.21<br />
51.0 0.98 96.04 215.64 311.68<br />
Fig. 17. Plots <strong>of</strong> <strong>the</strong> effect <strong>of</strong> r on E[TC 1], E[L 1], <strong>and</strong> E[C M1] when l = l*.<br />
Fig. 18. Plots <strong>of</strong> <strong>the</strong> effect <strong>of</strong> l on E[TC 1], E[L 1], <strong>and</strong> E[C M1] when r = r*.
1738 S. Shin et al. / European Journal <strong>of</strong> Operational Research 207 (2010) 1728–1741<br />
This is a solid pro<strong>of</strong> that E[TC2] is a convex function <strong>and</strong> d* is <strong>the</strong><br />
global minimum because its value is between 0 <strong>and</strong> 1.7452.<br />
The sensitivity analysis <strong>of</strong> d* to <strong>the</strong> change in r can be seen in<br />
Table 3 or Fig. 15. It can be observed that d* gradually decreases<br />
as r increases. Additionally, E[CM2] depends on d* <strong>and</strong> r <strong>and</strong> its value<br />
is <strong>the</strong> lowest when r is 1.30. Similarly, <strong>the</strong> sensitivity analysis<br />
<strong>of</strong> <strong>the</strong> effect <strong>of</strong> <strong>the</strong> process bias (or jl Tj)ond* is shown in Table 4<br />
or Fig. 16. It is shown that, as <strong>the</strong> process bias increases, d* decreases<br />
while E[CR] increases. For <strong>the</strong> 100% inspection <strong>of</strong> Y, E[L2]<br />
is more affected by <strong>the</strong> process bias than by r, whereas E[C R]is<br />
sensitive to both.<br />
Table 7<br />
Effect <strong>of</strong> r on d* when l = l*.<br />
r l l Tj d* E[CM2] E[CR] E[L2(y)] E[TC2] 0.80 50.00 0.00 1.2555 99.5982 20.9297 21.4541 141.9821<br />
0.85 50.00 0.00 1.1815 99.5983 23.7405 21.2063 144.5451<br />
0.90 50.00 0.00 1.1158 99.5983 26.4520 20.8781 146.9284<br />
0.95 50.00 0.00 1.0570 99.5983 29.0509 20.4949 149.1442<br />
1.00 50.00 0.00 1.0041 99.5983 31.5310 20.0756 151.2050<br />
1.05 50.00 0.00 0.9563 99.5983 33.8904 19.6344 153.1232<br />
1.10 50.00 0.00 0.9129 99.5983 36.1303 19.1818 154.9105<br />
1.15 50.00 0.00 0.8732 99.5983 38.2539 18.7256 156.5778<br />
1.20 50.00 0.00 0.8369 99.5983 40.2658 18.2713 158.1354<br />
1.25 50.00 0.00 0.8035 99.5983 42.1712 17.8230 159.5925<br />
1.30 50.00 0.00 0.7726 99.5982 43.9758 17.3836 160.9576<br />
Fig. 19. Plots <strong>of</strong> <strong>the</strong> effect <strong>of</strong> r on E[TC 2], E[C R], E[L 2], E[C M2], <strong>and</strong> d* when l = l*.<br />
Table 8<br />
Effect <strong>of</strong> r on d* when l = l*.<br />
r l jl Tj d* E[CM2] E[CR] E[L2(y)] E[TC2] 0.80 49.99 0.01 1.2555 99.5982 20.9346 21.4538 141.9866<br />
0.85 49.99 0.01 1.1815 99.5983 23.7450 21.2058 144.5491<br />
0.90 49.99 0.01 1.1158 99.5983 26.4560 20.8776 146.9319<br />
0.95 49.99 0.01 1.0570 99.5983 29.0546 20.4944 149.1473<br />
1.00 49.99 0.01 1.0041 99.5983 31.5344 20.0750 151.2077<br />
1.05 49.99 0.01 0.9563 99.5983 33.8935 19.6338 153.1256<br />
1.10 49.99 0.01 0.9129 99.5983 36.1330 19.1813 154.9126<br />
1.15 49.99 0.01 0.8732 99.5983 38.2564 18.7250 156.5797<br />
1.20 49.99 0.01 0.8369 99.5983 40.2680 18.2708 158.1371<br />
1.25 49.99 0.01 0.8035 99.5983 42.1732 17.8226 159.5941<br />
1.30 49.99 0.01 0.7726 99.5982 43.9776 17.3831 160.9590<br />
6.2. Case II<br />
6.2.1. Determining optimal settings <strong>of</strong> process parameters<br />
Similarly to case I, <strong>the</strong> minimum value <strong>of</strong> E[TC 1] obtained at <strong>the</strong><br />
optimal process mean <strong>and</strong> st<strong>and</strong>ard deviation (which are determined<br />
by Eqs. (32) <strong>and</strong> (33), i.e., l* = 50.0000 <strong>and</strong> r* = 0.9780) is<br />
309.3516 as illustrated in Fig. 6. In addition, <strong>the</strong> results <strong>of</strong> <strong>the</strong> sensitivity<br />
analysis <strong>of</strong> E[TC 1] are given in Tables 5 <strong>and</strong> 6, <strong>and</strong> Figs. 17<br />
<strong>and</strong> 18.<br />
6.2.2. Determining optimal <strong>tolerance</strong><br />
Following <strong>the</strong> closed-form solution presented in Eq. (39), d* becomes<br />
1.0267. This optimal value generates <strong>the</strong> minimum E[TC2],<br />
<strong>the</strong> optimal LSL, <strong>and</strong> <strong>the</strong> optimal USL at 150.3166, 48.9959, <strong>and</strong><br />
51.0041, respectively. Plots <strong>of</strong> E[TC2], E[CM2], E[CR] <strong>and</strong> E[L2(y)] with<br />
respect to d are presented in Fig. 7.<br />
Fig. 8 shows that <strong>the</strong> first derivative <strong>of</strong> E[TC2] with respect to d<br />
becomes zero when d is at <strong>the</strong> optimum point. The conditions <strong>of</strong><br />
convexity for E[TC2] discussed in Section 5.2 are presented in<br />
Fig. 9, which shows that when d is at <strong>the</strong> optimum point (d*), <strong>the</strong><br />
value <strong>of</strong> @ 2 E[TC2]/@d 2 is greater than zero. It also shows <strong>the</strong> range<br />
<strong>of</strong> d, which can be derived from Eq. (40). The result is <strong>the</strong> range between<br />
0 <strong>and</strong> 1.2340, which contains <strong>the</strong> value <strong>of</strong> d*.<br />
The effect <strong>of</strong> r on d* can be seen in Table 7 or Fig. 19. It can be<br />
observed that d* decreases as r increases, <strong>and</strong> E[CR] is inversely<br />
proportional to d*. For this case, <strong>the</strong> effect <strong>of</strong> <strong>the</strong> process bias (or<br />
jl Tj) ond* is not provided because no l in <strong>the</strong> closed-form solution<br />
<strong>of</strong> d* defined in Eq. (39). It can be concluded that l has no effect<br />
to d*. For <strong>the</strong> 100% inspection <strong>of</strong> Y, to decrease <strong>the</strong> total cost,<br />
E[L2] <strong>and</strong> r should be controlled because <strong>the</strong>y are directly proportional<br />
to <strong>the</strong> total cost.<br />
Fig. 20. Plots <strong>of</strong> <strong>the</strong> effect <strong>of</strong> r on E[TC2], E[CR], E[L2], E[CM2], <strong>and</strong> d* when l = l*.<br />
Table 9<br />
Effect <strong>of</strong> jl Tj on d* when r = r*.<br />
l jl Tj r d* E[CM2] E[CR] E[L2(y)] E[TC2] 49.0 1.00 0.98 1.0272 99.5974 51.7607 16.0869 167.4449<br />
49.1 0.90 0.98 1.0271 99.5974 48.2578 16.8773 164.7325<br />
49.2 0.80 0.98 1.0270 99.5974 44.9205 17.5967 162.1146<br />
49.3 0.70 0.98 1.0270 99.5974 41.8078 18.2389 159.6441<br />
49.4 0.60 0.98 1.0269 99.5974 38.9766 18.7994 157.3734<br />
49.5 0.50 0.98 1.0269 99.5974 36.4801 19.2753 155.3528<br />
49.6 0.40 0.98 1.0269 99.5974 34.3663 19.6651 153.6289<br />
49.7 0.30 0.98 1.0269 99.5974 32.6769 19.9680 152.2423<br />
49.8 0.20 0.98 1.0269 99.5974 31.4452 20.1840 151.2267<br />
49.9 0.10 0.98 1.0269 99.5974 30.6961 20.3135 150.6070<br />
50.0 0.00 0.98 1.0269 99.5974 30.4448 20.3565 150.3987
Fig. 21. Plots <strong>of</strong> <strong>the</strong> effect <strong>of</strong> jl Tj on E[TC 2], E[C R], E[L 2], E[C M2], <strong>and</strong> d* when<br />
r = r*.<br />
6.3. Case III<br />
6.3.1. Determining optimal settings <strong>of</strong> process parameters<br />
Since <strong>the</strong> closed-form solutions <strong>of</strong> l* <strong>and</strong> r* for this case are <strong>the</strong><br />
same as those <strong>of</strong> Case I, see <strong>the</strong> first part <strong>of</strong> Section 6.1 for more<br />
details.<br />
6.3.2. Determining optimal <strong>tolerance</strong><br />
Although <strong>the</strong> closed-form solution <strong>of</strong> d* for this case cannot be<br />
formulated, d* can be generated by minimizing E[TC 2] given in Eq.<br />
(44). By using MATLAB s<strong>of</strong>tware package, <strong>the</strong> minimum E[TC2] is<br />
obtained at 150.4008 when d is 1.0269, defined as d*. This optimal<br />
value can be verified from <strong>the</strong> plots shown in Figs. 11 <strong>and</strong> 12. The<br />
former shows that <strong>the</strong> first derivative <strong>of</strong> E[TC2] is zero at d* <strong>and</strong> <strong>the</strong><br />
latter shows that <strong>the</strong> second derivative <strong>of</strong> E[TC2] atd* is greater<br />
than zero. The change <strong>of</strong> d to E[TC2], E[CM2], E[CR] <strong>and</strong> E[L2] is depicted<br />
in Fig. 10. From d*, <strong>the</strong> optimum LSL <strong>and</strong> USL are set at<br />
48.9959 <strong>and</strong> 51.0041, respectively.<br />
The sensitivity analysis <strong>of</strong> <strong>the</strong> effect <strong>of</strong> r on d* is provided in Table<br />
8 <strong>and</strong> Fig. 20. It can be observed that r has inverse variation in<br />
d* but it has direct variation in E[C R]. Similarly, <strong>the</strong> sensitivity analysis<br />
<strong>of</strong> <strong>the</strong> effect <strong>of</strong> <strong>the</strong> process bias (or jl Tj) ond* is provided in<br />
Table 9 <strong>and</strong> Fig. 21. It shows that <strong>the</strong> process bias directly affect d*<br />
<strong>and</strong> E[CR]. For <strong>the</strong> 100% inspection <strong>of</strong> Y, E[L2] is slightly affected by<br />
r <strong>and</strong> jl Tj, whereas E[C R] is greatly affected by both r <strong>and</strong><br />
jl Tj.<br />
7. Conclusions <strong>and</strong> fur<strong>the</strong>r study<br />
Very <strong>of</strong>ten, engineers face <strong>the</strong> problem <strong>of</strong> determining <strong>the</strong> optimal<br />
<strong>tolerance</strong> in many industrial settings. This paper proposed an<br />
integrated scheme for determining <strong>the</strong> optimal process parameters<br />
<strong>and</strong> <strong>tolerance</strong>s, <strong>the</strong> algorithm to quantify <strong>the</strong> cost <strong>of</strong> achieving optimal<br />
process parameters <strong>and</strong> <strong>tolerance</strong>s, toge<strong>the</strong>r with a procedure<br />
to incorporate Lambert W function to generate closed-form solutions<br />
for <strong>tolerance</strong> <strong>optimization</strong> problems. The proposed methodologies<br />
are superior to earlier models that determine optimal<br />
<strong>tolerance</strong> assuming fixed settings for <strong>the</strong> process parameters.<br />
Moreover, <strong>the</strong> proposed models <strong>and</strong> solutions might be appealing<br />
to engineers because <strong>the</strong> function is found in most st<strong>and</strong>ard <strong>optimization</strong><br />
s<strong>of</strong>tware packages. Continuous research efforts over <strong>the</strong><br />
past few decades in <strong>the</strong> area <strong>of</strong> <strong>tolerance</strong> <strong>optimization</strong> has led to<br />
<strong>the</strong> formulation <strong>of</strong> effective <strong>optimization</strong> models that are free <strong>of</strong><br />
<strong>the</strong> restrictive assumptions imposed by earlier ones. Along <strong>the</strong>se<br />
lines, a fruitful area for future research is to extend <strong>the</strong> <strong>modeling</strong><br />
S. Shin et al. / European Journal <strong>of</strong> Operational Research 207 (2010) 1728–1741 1739<br />
methodology presented in this paper to a generalized <strong>tolerance</strong><br />
<strong>optimization</strong> problem involving multiple quality characteristics.<br />
Fur<strong>the</strong>r, <strong>the</strong> consideration <strong>of</strong> interactions between quality characteristics<br />
<strong>and</strong> <strong>the</strong> use <strong>of</strong> a surrogate variable may be potential topics<br />
for future investigations.<br />
Acknowledgements<br />
This work was supported by <strong>the</strong> Korea Science <strong>and</strong> Engineering<br />
Foundation (KOSEF) grant funded by <strong>the</strong> Korea Government<br />
(MOST) (No. R01-2007-000-21070-0). This work was supported<br />
by <strong>the</strong> Korea Research Foundation Grant funded by <strong>the</strong> Korean<br />
Government (MOEHRD, Basic Research Promotion Fund) (KRF-<br />
2008-331-D00686).<br />
Appendix A<br />
Key notations, used in <strong>the</strong> model developments, are summarized<br />
<strong>and</strong> explained as follows:<br />
Y <strong>the</strong> quality characteristic Y <strong>of</strong> <strong>the</strong> product<br />
y <strong>the</strong> observed value <strong>of</strong> Y<br />
f(y) <strong>the</strong> density function <strong>of</strong> Y<br />
l <strong>the</strong> process mean <strong>of</strong> Y<br />
l* <strong>the</strong> optimum process mean <strong>of</strong> Y<br />
r <strong>the</strong> st<strong>and</strong>ard deviation <strong>of</strong> Y<br />
r* <strong>the</strong> optimum process st<strong>and</strong>ard deviation <strong>of</strong> Y<br />
r2 <strong>the</strong> variance <strong>of</strong> Y<br />
T <strong>the</strong> target value <strong>of</strong> Y<br />
s <strong>the</strong> target value <strong>of</strong> Y in <strong>the</strong> st<strong>and</strong>ard normal distribution<br />
domain, s =(y l)/r<br />
k <strong>the</strong> quality loss coefficient<br />
L(y) <strong>the</strong> quality loss associated with Y<br />
L1(y) <strong>the</strong> quality loss associated with Y <strong>and</strong> incurred when process<br />
inspection is not implemented<br />
L2(y) <strong>the</strong> quality loss associated with Y <strong>and</strong> incurred when process<br />
inspection is implemented<br />
QLF quality loss function<br />
CM1 <strong>the</strong> manufacturing unit cost incurred when process inspection<br />
is not implemented<br />
c0 <strong>the</strong> constant in <strong>the</strong> CM1 regression function<br />
c1 <strong>the</strong> coefficient <strong>of</strong> l in <strong>the</strong> CM1 regression function<br />
c2 <strong>the</strong> coefficient <strong>of</strong> r in <strong>the</strong> CM1 regression function<br />
c3 <strong>the</strong> coefficient <strong>of</strong> lr in <strong>the</strong> CM1 regression function<br />
d <strong>the</strong> number <strong>of</strong> st<strong>and</strong>ard deviations where <strong>the</strong> specification<br />
limit is located from <strong>the</strong> middle <strong>of</strong> its <strong>tolerance</strong> range<br />
LSL <strong>the</strong> lower specification limit associated with Y<br />
USL <strong>the</strong> upper specification limit associated with Y<br />
E[ ] <strong>the</strong> expected value<br />
CR <strong>the</strong> rejection unit cost<br />
/( ) <strong>the</strong> st<strong>and</strong>ard normal probability density function<br />
U(.) <strong>the</strong> st<strong>and</strong>ard normal cumulative distribution function<br />
z <strong>the</strong> st<strong>and</strong>ard normal r<strong>and</strong>om variable<br />
t <strong>the</strong> <strong>tolerance</strong> range<br />
CM2 <strong>the</strong> manufacturing unit cost incurred when process inspection<br />
is implemented<br />
a0 <strong>the</strong> constant in <strong>the</strong> CM2 regression function<br />
a1 <strong>the</strong> coefficient <strong>of</strong> t in <strong>the</strong> CM2 regression function<br />
e <strong>the</strong> least-squares regression error<br />
TC1 <strong>the</strong> process total cost incurred when <strong>the</strong> process inspection<br />
is not implemented<br />
TC2 <strong>the</strong> total cost incurred when <strong>the</strong> process inspection is implemented<br />
Appendix B<br />
Lemma 1. Suppose v 2 R 1 <strong>and</strong> a mapping g:v ? Risg = ve v , <strong>the</strong>n<br />
<strong>the</strong> solution for v is given by v = LambertW(g).
1740 S. Shin et al. / European Journal <strong>of</strong> Operational Research 207 (2010) 1728–1741<br />
Pro<strong>of</strong>. See Corless et al. (1996). h<br />
Proposition 1. If g2 =(v + g1)e v where g1 <strong>and</strong> g2 are not functions <strong>of</strong><br />
v, <strong>the</strong>n v ¼ Lambert W g2eg ð 1Þ<br />
g1 .<br />
Pro<strong>of</strong>. Consider <strong>the</strong> following equation:<br />
g 2 ¼ðv þ g 1 Þe v : ðA-1Þ<br />
Let v + g1 = w so Eq. (A-1) becomes<br />
g 2 ¼ we w g 1: ðA-2Þ<br />
To convert Eq. (A-2) in <strong>the</strong> st<strong>and</strong>ard form g = ve v , we first modify<br />
Eq. (A-2) as follows:<br />
g 2 e g 1 ¼ we w : ðA-3Þ<br />
Next, substitute g 2 e g 1 ¼ x to <strong>the</strong> right h<strong>and</strong> side <strong>of</strong> Eq. (A-3)<br />
<strong>the</strong>n we obtain x = we w . From Lemma 1, w is given by:<br />
w ¼ Lambert WðxÞ: ðA-4Þ<br />
Therefore, v is obtained as<br />
v ¼ Lambert W g2e g ð 1Þ<br />
g1 :<br />
Proposition 2. If g4 ¼ g1 v2 þ g2 eg3v2 , where g1, g2, g3, <strong>and</strong> g4 are<br />
not functions <strong>of</strong> v, <strong>the</strong>n<br />
v ¼<br />
ffiffiffiffiffiffiffiffiffiffiffiffiffiffiffiffiffiffiffiffiffiffiffiffiffiffiffiffiffiffiffiffiffiffiffiffiffiffiffiffiffiffiffiffiffiffiffiffiffiffiffiffiffiffiffiffiffi<br />
Lambert W g3g4 e g2g v<br />
u<br />
3<br />
u<br />
t<br />
g1 :<br />
g 3<br />
g 2<br />
Pro<strong>of</strong>. In order to prove Proposition 2 using Lemma 1, we first consider<br />
<strong>the</strong> equation<br />
g4 ¼ g1 v2 þ g2 e g3v2 : ðA-5Þ<br />
g 3g 4<br />
g 1<br />
Multiplied both sides with g3/g1, Eq. (A-5) becomes<br />
¼ g3 v2 þ g2 e g3v2 : ðA-6Þ<br />
Let w = g 3(v 2 + g 2), Eq. (A-6) can be written as<br />
g 3g 4 e g 2g 3<br />
g 1<br />
¼ we w : ðA-7Þ<br />
Fur<strong>the</strong>r, substituted g3g4 e g2g3 g1 dard form g = ve v .<br />
¼ x, Eq. (A-7) is now in <strong>the</strong> stan-<br />
w ¼ Lambert WðxÞ: ðA-8Þ<br />
Replaced x ¼ g3g4 e g2g3 g back into Eq. (A-8), <strong>the</strong> st<strong>and</strong>ard form in<br />
1<br />
Eq. (A-8) can be written as w ¼ Lambert W g3g4 e g2g3 g . Eq. (A-9)<br />
1<br />
can be exp<strong>and</strong>ed to express <strong>the</strong> solution in terms <strong>of</strong> v by replacing<br />
w with g3(v + g2). Thus, <strong>the</strong> solution for v is given by<br />
ffiffiffiffiffiffiffiffiffiffiffiffiffiffiffiffiffiffiffiffiffiffiffiffiffiffiffiffiffiffiffiffiffiffiffiffiffiffiffiffiffiffiffiffiffiffiffiffiffiffiffiffiffiffiffiffiffi<br />
Lambert W<br />
v ¼<br />
g3g4 e g2g v<br />
u<br />
3<br />
u<br />
t<br />
g1 : ðA-9Þ<br />
References<br />
g 3<br />
g 2<br />
Al-Fawzan, M.A., Rahim, M.A., 2001. Optimal control <strong>of</strong> deteriorating process with a<br />
quadratic loss function. Quality <strong>and</strong> Reliability Engineering International 17 (6),<br />
459–466.<br />
Al-Sultan, K.S., Pulak, M.F.S., 2000. Optimum target values for two machines in<br />
series with 100% inspection. European Journal <strong>of</strong> Operational Research 120 (1),<br />
181–189.<br />
Bjorke, O., 1989. Computer-Aided Tolerancing. American Society <strong>of</strong> Mechanical<br />
Engineers, USA.<br />
Bowling, S.R., Khasawneh, M.T., Kaewkuekool, S., Cho, B.R., 2004. A Markovian<br />
approach to determining optimum process target levels for a multi-stage<br />
serial production system. European Journal <strong>of</strong> Operational Research 159 (3),<br />
636–650.<br />
Caleb Li, M.H., Chen, J.C., 2001. Determining process mean for machining while<br />
unbalanced <strong>tolerance</strong> design occurs. Journal <strong>of</strong> Industrial Technology 17 (1), 1–<br />
6.<br />
Chase, K.W., Parkinson, A.R., 1991. A survey <strong>of</strong> research in <strong>the</strong> application <strong>of</strong><br />
<strong>tolerance</strong> analysis to <strong>the</strong> design <strong>of</strong> mechanical assemblies. Research in<br />
Engineering Design 3 (1), 23–27.<br />
Chase, K.W., Greenwood, W.H., Loosli, B.G., Haughlund, L.F., 1990. Least-cost<br />
<strong>tolerance</strong>s allocation for mechanical assemblies with automated process<br />
selection. Manufacturing Review 3 (1), 49–59.<br />
Chen, C.H., Kao, H.S., 2009. The determination <strong>of</strong> optimum process mean <strong>and</strong><br />
screening limits based on quality loss function. Expert Systems with<br />
Applications 36 (3-2), 7332–7335.<br />
Cho, B.R., Leonard, M.S., 1997. Identification <strong>and</strong> extensions <strong>of</strong> quasiconvex quality<br />
loss functions. International Journal <strong>of</strong> Reliability, Quality <strong>and</strong> Safety<br />
Engineering 4 (2), 191–204.<br />
Corless, R.M., Gonnet, G.H., Hare, D.E.G., Jeffrey, D.J., Knuth, D.E., 1996. On <strong>the</strong><br />
Lambert W function. Advances in Computational Ma<strong>the</strong>matics 5, 329–359.<br />
Fathi, Y., 1990. Producer–consumer <strong>tolerance</strong>s. Journal <strong>of</strong> Quality Technology 22 (2),<br />
138–145.<br />
Golhar, D.Y., 1987. Determination <strong>of</strong> <strong>the</strong> best mean contents for a canning problem.<br />
Journal <strong>of</strong> Quality Technology 19 (2), 82–84.<br />
Golhar, D.Y., Pollock, S.M., 1988. Determination <strong>of</strong> <strong>the</strong> optimal process mean <strong>and</strong><br />
<strong>the</strong> upper limit for a canning problem. Journal <strong>of</strong> Quality Technology 20 (3),<br />
188–192.<br />
Hong, S.H., Cho, B.R., 2007. Joint <strong>optimization</strong> <strong>of</strong> process target mean <strong>and</strong> <strong>tolerance</strong><br />
limits with measurement errors under multi-decision alternatives. European<br />
Journal <strong>of</strong> Operational Research 183, 327–335.<br />
Jeang, A., 1997. An approach <strong>of</strong> <strong>tolerance</strong> design for quality improvement <strong>and</strong><br />
cost reduction. International Journal <strong>of</strong> Production Research 35 (5), 1193–<br />
1211.<br />
Jeang, A., Chung, C.P., 2008. Process mean, process <strong>tolerance</strong>, <strong>and</strong> use time<br />
determination for product life application under deteriorating process. The<br />
International Journal <strong>of</strong> Advanced Manufacturing Technology 36 (1–2), 97–<br />
113.<br />
Jeong, I.J., Kim, K.J., 2009. An interactive desirability function method to<br />
multiresponse <strong>optimization</strong>. European Journal <strong>of</strong> Operational Research 195,<br />
412–426.<br />
Kang, J.S., Suh, M.H., Lee, T.Y., 2004. Robust economic <strong>optimization</strong> <strong>of</strong> process design<br />
under uncertainty. Engineering Optimization 36 (1), 51–75.<br />
Kapur, K.C., Cho, B.R., 1996. Economic design <strong>of</strong> <strong>the</strong> specification region for multiple<br />
quality characteristics. IIE Transactions 28 (3), 401–417.<br />
Kim, Y.J., Cho, B.R., 2000a. Economic integration <strong>of</strong> design <strong>optimization</strong>. Quality<br />
Engineering 12 (4), 561–567.<br />
Kim, Y.J., Cho, B.R., 2000b. The use <strong>of</strong> response surface designs in <strong>the</strong> selection <strong>of</strong><br />
optimum <strong>tolerance</strong> allocation. Quality Engineering 13 (1), 35–42.<br />
Kim, Y.J., Cho, B.R., Phillips, M.D., 2000. Determination <strong>of</strong> <strong>the</strong> optimum process<br />
mean with <strong>the</strong> consideration <strong>of</strong> variance reduction <strong>and</strong> process capability.<br />
Quality Engineering 13 (2), 251–260.<br />
Lee, M.K., Kwon, H.M., Hong, S.H., Kim, Y.J., 2007. Determination <strong>of</strong> <strong>the</strong> optimum<br />
target value for a production process with multiple products. International<br />
Journal <strong>of</strong> Production Economics 107 (1), 173–178.<br />
Liu, W., Raghavachari, M., 1997. The target mean problem for an arbitrary quality<br />
characteristic distribution. International Journal <strong>of</strong> Production Research 35 (6),<br />
1713–1728.<br />
Manarvi, I.A., Juster, N.P., 2004. Framework <strong>of</strong> an integrated <strong>tolerance</strong> syn<strong>the</strong>sis<br />
model <strong>and</strong> using FE simulation as a virtual tool for <strong>tolerance</strong> allocation in<br />
assembly design. Journal <strong>of</strong> Materials Processing Technology 150 (1–2), 182–<br />
193.<br />
MATLAB. .<br />
Pakkala, T.P.M., Rahim, M.A., 1999. Determination <strong>of</strong> an optimal setting <strong>and</strong><br />
production run using Taguchi’s loss function. International Journal <strong>of</strong> Reliability,<br />
Quality <strong>and</strong> Safety Engineering 6 (4), 335–346.<br />
Patel, A.M., 1980. Computer-aided assignment <strong>of</strong> <strong>tolerance</strong>s. In: Proceedings <strong>of</strong> <strong>the</strong><br />
17th Design <strong>and</strong> Automation Conference, Minneapolis, USA.<br />
Peng, H.P., Jiang, X.Q., Liu, X.J., 2008. Concurrent optimal allocation <strong>of</strong> design <strong>and</strong><br />
process <strong>tolerance</strong>s for mechanical assemblies with interrelated dimension<br />
chains. International Journal <strong>of</strong> Production Research 46 (24), 6963–6979.<br />
Phillips, M.D., Cho, B.R., 1998. An empirical approach to designing product<br />
specifications: A case study. Quality Engineering 11 (1), 91–100.<br />
Plante, R., 2002. Multivariate <strong>tolerance</strong> design for a quadratic design parameter<br />
model. IIE Transactions 34 (6), 565–571.<br />
Prabhaharan, G., Ramesh, R., Asokan, P., 2007. Concurrent <strong>optimization</strong> <strong>of</strong> assembly<br />
<strong>tolerance</strong>s for quality with position control using scatter search approach.<br />
International Journal <strong>of</strong> Production Research 45 (21), 4959–4988.<br />
Rahim, M.A., Al-Sultan, K.S., 2000. Joint determination <strong>of</strong> <strong>the</strong> target mean <strong>and</strong><br />
variance <strong>of</strong> a process. Journal <strong>of</strong> Quality Maintenance Engineering 6 (3), 192–<br />
199.<br />
Rahim, M.A., Bhadury, J., Al-Sultan, K.S., 2002. Joint economic selection <strong>of</strong> target<br />
mean <strong>and</strong> variance. Engineering Optimization 34 (1), 1–14.<br />
Shao, R.L., Fowler, J.W., Runger, G.C., 2000. Determining <strong>the</strong> optimal target for a<br />
process with multiple markets <strong>and</strong> variable holding cost. International Journal<br />
<strong>of</strong> Production Economics 65 (3), 229–242.
Shin, S., Cho, B.R., 2007. Integrating a bi-objective paradigm to <strong>tolerance</strong><br />
<strong>optimization</strong>. International Journal <strong>of</strong> Production Research 45 (23), 5509–5525.<br />
Singh, P.K., Jain, P.K., Jain, S.C., 2003. Simultaneous optimal selection <strong>of</strong> design <strong>and</strong><br />
manufacturing <strong>tolerance</strong>s with different stack-up conditions using genetic<br />
algorithms. International Journal <strong>of</strong> Production Research 41 (11), 2411–2429.<br />
Speckhart, F.H., 1972. Calculation <strong>of</strong> <strong>tolerance</strong> based on a minimum cost approach.<br />
Transactions <strong>of</strong> <strong>the</strong> ASME, Journal <strong>of</strong> Engineering for Industry 94, 447–453.<br />
Spotts, M.F., 1973. Allocation <strong>of</strong> <strong>tolerance</strong>s to minimize cost <strong>of</strong> assembly.<br />
Transactions <strong>of</strong> <strong>the</strong> ASME, Journal <strong>of</strong> Engineering for Industry 95, 762–764.<br />
Springer, C.H., 1951. A method for determining <strong>the</strong> most economic position <strong>of</strong> a<br />
process mean. Industrial Quality Control 8 (1), 36–39.<br />
Tang, K., 1988. Economic design <strong>of</strong> product specifications for a complete inspection<br />
plan. International Journal <strong>of</strong> Production Research 26 (2), 203–217.<br />
S. Shin et al. / European Journal <strong>of</strong> Operational Research 207 (2010) 1728–1741 1741<br />
Tang, K., Tang, J., 1989. Design <strong>of</strong> product specifications for multi-characteristic<br />
inspection. Management Science 35 (6), 743–756.<br />
Tang, K., Tang, J., 1994. Design <strong>of</strong> screening procedures: A review. Journal <strong>of</strong> Quality<br />
Technology 26 (3), 209–226.<br />
Teeravaraprug, J., Cho, B.R., 2002. Designing <strong>the</strong> optimal target levels for multiple<br />
quality characteristics. International Journal <strong>of</strong> Production Research 40 (1), 37–<br />
54.<br />
Teeravaraprug, J., Cho, B.R., Kennedy, W.J., 2001. Designing <strong>the</strong> most cost effective<br />
process target using regression analysis: A case study. Process Control <strong>and</strong><br />
Quality 11 (6), 469–477.<br />
Wang, P., Liang, M., 2005. An integrated approach to <strong>tolerance</strong> syn<strong>the</strong>sis, process<br />
selection <strong>and</strong> machining parameter <strong>optimization</strong> problems. International<br />
Journal <strong>of</strong> Production Research 43 (11), 2237–2262.