Development of the parametric tolerance modeling and optimization ...
Development of the parametric tolerance modeling and optimization ...
Development of the parametric tolerance modeling and optimization ...

You also want an ePaper? Increase the reach of your titles
YUMPU automatically turns print PDFs into web optimized ePapers that Google loves.
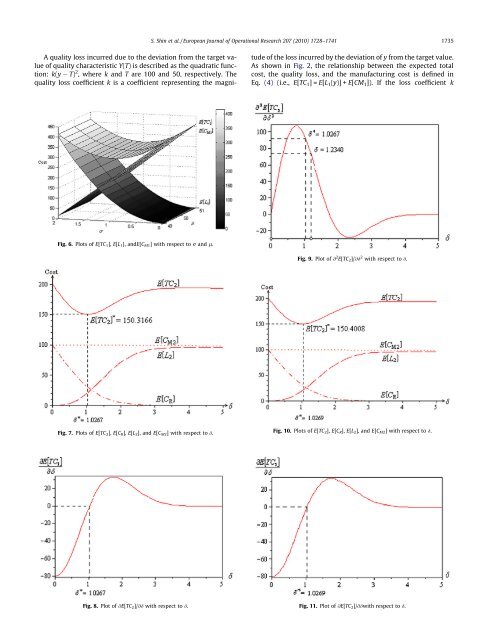
A quality loss incurred due to <strong>the</strong> deviation from <strong>the</strong> target value<br />
<strong>of</strong> quality characteristic Y(T) is described as <strong>the</strong> quadratic function:<br />
k(y T) 2 , where k <strong>and</strong> T are 100 <strong>and</strong> 50, respectively. The<br />
quality loss coefficient k is a coefficient representing <strong>the</strong> magni-<br />
Fig. 6. Plots <strong>of</strong> E[TC1], E[L1], <strong>and</strong>E[CM1] with respect to r <strong>and</strong> l.<br />
Fig. 7. Plots <strong>of</strong> E[TC2], E[CR], E[L2], <strong>and</strong> E[CM2] with respect to d.<br />
Fig. 8. Plot <strong>of</strong> @E[TC 2]/@d with respect to d.<br />
S. Shin et al. / European Journal <strong>of</strong> Operational Research 207 (2010) 1728–1741 1735<br />
tude <strong>of</strong> <strong>the</strong> loss incurred by <strong>the</strong> deviation <strong>of</strong> y from <strong>the</strong> target value.<br />
As shown in Fig. 2, <strong>the</strong> relationship between <strong>the</strong> expected total<br />
cost, <strong>the</strong> quality loss, <strong>and</strong> <strong>the</strong> manufacturing cost is defined in<br />
Eq. (4) (i.e., E[TC 1]=E[L 1(y)] + E[CM 1]). If <strong>the</strong> loss coefficient k<br />
Fig. 9. Plot <strong>of</strong> @ 2 E[TC2]/@d 2 with respect to d.<br />
Fig. 10. Plots <strong>of</strong> E[TC 2], E[C R], E[L 2], <strong>and</strong> E[C M2] with respect to d.<br />
Fig. 11. Plot <strong>of</strong> @E[TC 2]/@dwith respect to d.