Lab 6
Lab 6
Lab 6

You also want an ePaper? Increase the reach of your titles
YUMPU automatically turns print PDFs into web optimized ePapers that Google loves.
5. Repeat for gains of 5 and 6.<br />
6. Download and open the file AnalyzeTachoData.vi from the course website. Input the sample<br />
period for your data the dt control. If you’re not sure what this is, you can open any of your<br />
.txt files and read the dt value in Excel.<br />
7. Run this vi and open one of your data files. It will then ask you to input a name to save the<br />
data. The data saved is after the input data has been rectified and filtered. You will see two<br />
waveform graphs. The first one shows the data exactly as it was read in. The second one is the<br />
rectified and filtered data.<br />
8. Experiment with the filter block in the VI. The default filter is a 3 rd -order butterworth filter<br />
with a 25 Hz cutoff frequency. Try adjusting cutoff frequency to a lower and higher<br />
frequency. What do you observe? Next, try changing the filter order. Does this have any<br />
effect on your result?<br />
9. Open the filtered data in Excel. Plot all three on the same graph, determine the 63% rise times<br />
and record the values in the table below. Make sure to label the axis and hand in the plots<br />
with your lab write up.<br />
C. Create a VI to make steady-state measurements of current & motor speed vs voltage<br />
In this part of the lab you will write a VI based on the VI from <strong>Lab</strong> 2 (lab2.vi) to automatically<br />
measure the steady-state speed and input current of the motor as the input voltage is increased.<br />
This time, instead of graphing the results you will store the RMS tachometer voltage and the<br />
mean input current to a file for later analysis.<br />
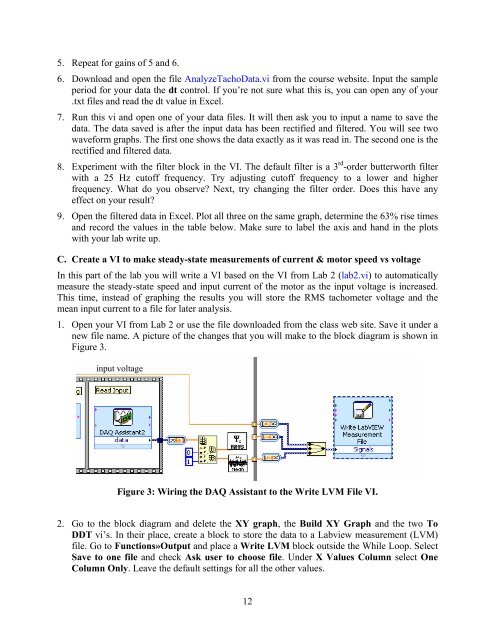
1. Open your VI from <strong>Lab</strong> 2 or use the file downloaded from the class web site. Save it under a<br />
new file name. A picture of the changes that you will make to the block diagram is shown in<br />
Figure 3.<br />
input voltage<br />
Figure 3: Wiring the DAQ Assistant to the Write LVM File VI.<br />
2. Go to the block diagram and delete the XY graph, the Build XY Graph and the two To<br />
DDT vi’s. In their place, create a block to store the data to a <strong>Lab</strong>view measurement (LVM)<br />
file. Go to Functions»Output and place a Write LVM block outside the While Loop. Select<br />
Save to one file and check Ask user to choose file. Under X Values Column select One<br />
Column Only. Leave the default settings for all the other values.<br />
12