Lab 6
Lab 6
Lab 6

You also want an ePaper? Increase the reach of your titles
YUMPU automatically turns print PDFs into web optimized ePapers that Google loves.
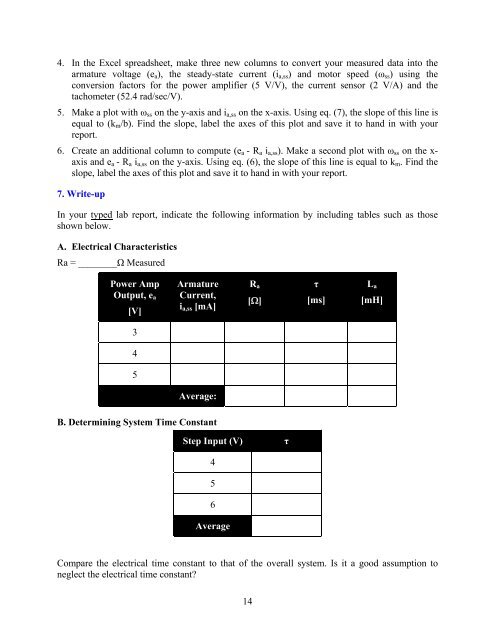
4. In the Excel spreadsheet, make three new columns to convert your measured data into the<br />
armature voltage (ea), the steady-state current (ia,ss) and motor speed (ωss) using the<br />
conversion factors for the power amplifier (5 V/V), the current sensor (2 V/A) and the<br />
tachometer (52.4 rad/sec/V).<br />
5. Make a plot with ωss on the y-axis and ia,ss on the x-axis. Using eq. (7), the slope of this line is<br />
equal to (km/b). Find the slope, label the axes of this plot and save it to hand in with your<br />
report.<br />
6. Create an additional column to compute (ea - Ra ia,ss). Make a second plot with ωss on the xaxis<br />
and ea - Ra ia,ss on the y-axis. Using eq. (6), the slope of this line is equal to km. Find the<br />
slope, label the axes of this plot and save it to hand in with your report.<br />
7. Write-up<br />
In your typed lab report, indicate the following information by including tables such as those<br />
shown below.<br />
A. Electrical Characteristics<br />
Ra = ________Ω Measured<br />
Power Amp<br />
Output, ea<br />
[V]<br />
3<br />
4<br />
5<br />
Armature<br />
Current,<br />
ia,ss [mA]<br />
Average:<br />
B. Determining System Time Constant<br />
14<br />
Ra<br />
[Ω]<br />
Step Input (V) τ<br />
4<br />
5<br />
6<br />
Average<br />
τ<br />
[ms]<br />
La<br />
[mH]<br />
Compare the electrical time constant to that of the overall system. Is it a good assumption to<br />
neglect the electrical time constant?