Download - Coordinates
Download - Coordinates
Download - Coordinates

You also want an ePaper? Increase the reach of your titles
YUMPU automatically turns print PDFs into web optimized ePapers that Google loves.
GNSS<br />
Water vapour estimation at few<br />
GPS sites in Indian subcontinent<br />
Precipitable Water Vapor (PWV) in the atmosphere can be estimated from GPS data by<br />
determining the travel time delay of GPS radio signals through the troposphere<br />
SRIDEVI JADE AND MSM VIJAYAN<br />
Atmospheric water vapour<br />
estimation from the GPS<br />
data, surface total pressure<br />
and the mean tropospheric<br />
temperature is the most cost effective<br />
method which gives all weather<br />
good spatio-temporal coverage.<br />
Precipitable Water Vapor (PWV)<br />
in the atmosphere can be estimated<br />
from GPS data by determining<br />
the travel time delay of GPS radio<br />
signals through the troposphere.<br />
Water vapour is already identified as<br />
an important scientific input needed<br />
at various sites for atmospheric and<br />
space related studies: improving<br />
short term cloud and precipitation<br />
forecasts, sharpening images of<br />
mesospheric and stratospheric<br />
phenomena, to name a few. Its<br />
systematic estimation at and around<br />
GPS sites would, in turn, considerably<br />
enhance the vertical precision of<br />
site coordinates, thereby making it<br />
a valuable tool in monitoring and<br />
modelling of the vertical deformation<br />
of environmentally stressed sites.<br />
Radio signals transmitted by GPS<br />
satellites are refracted by the earth’s<br />
atmosphere and the ionosphere, thereby<br />
resulting in their delayed arrival at<br />
a receiving station, relative to their<br />
vacuum path. The delay caused by<br />
the ionosphere depends on the total<br />
electron content along the path and the<br />
signal frequency. Signals monitored at<br />
two frequencies using dual frequency<br />
GPS receivers, therefore, provide a<br />
tractable means of estimating the time<br />
delay contributed by the ionosphere,<br />
and this quantity can be subsequently<br />
used to estimate the distribution of<br />
TEC (Total Electronic Content) in the<br />
regional ionosphere. The troposphere,<br />
on the other hand, is non-dispersive.<br />
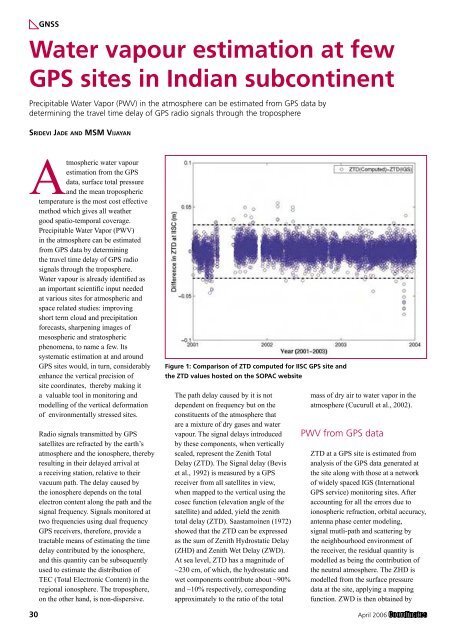
Figure 1: Comparison of ZTD computed for IISC GPS site and<br />
the ZTD values hosted on the SOPAC website<br />
The path delay caused by it is not<br />
dependent on frequency but on the<br />
constituents of the atmosphere that<br />
are a mixture of dry gases and water<br />
vapour. The signal delays introduced<br />
by these components, when vertically<br />
scaled, represent the Zenith Total<br />
Delay (ZTD). The Signal delay (Bevis<br />
et al., 1992) is measured by a GPS<br />
receiver from all satellites in view,<br />
when mapped to the vertical using the<br />
cosec function (elevation angle of the<br />
satellite) and added, yield the zenith<br />
total delay (ZTD). Saastamoinen (1972)<br />
showed that the ZTD can be expressed<br />
as the sum of Zenith Hydrostatic Delay<br />
(ZHD) and Zenith Wet Delay (ZWD).<br />
At sea level, ZTD has a magnitude of<br />
~230 cm, of which, the hydrostatic and<br />
wet components contribute about ~90%<br />
and ~10% respectively, corresponding<br />
approximately to the ratio of the total<br />
mass of dry air to water vapor in the<br />
atmosphere (Cucurull et al., 2002).<br />
PWV from GPS data<br />
ZTD at a GPS site is estimated from<br />
analysis of the GPS data generated at<br />
the site along with those at a network<br />
of widely spaced IGS (International<br />
GPS service) monitoring sites. After<br />
accounting for all the errors due to<br />
ionospheric refraction, orbital accuracy,<br />
antenna phase center modeling,<br />
signal mutli-path and scattering by<br />
the neighbourhood environment of<br />
the receiver, the residual quantity is<br />
modelled as being the contribution of<br />
the neutral atmosphere. The ZHD is<br />
modelled from the surface pressure<br />
data at the site, applying a mapping<br />
function. ZWD is then obtained by<br />
30 April 2006